

 PDF
PDF ePub
ePub Citation
 Print
Print


INTRODUCTION
Allergic rhinitis is characterized by one or more of the following symptoms: nasal itching, sneezing, watery nasal discharge and/or nasal congestion. The symptoms result from the inflammatory reaction of the nose caused by the interplay of inflammatory cells and its mediators induced by exposure to allergens.
It is a burdensome disease that affects patients of all ages. Aside from symptoms related to allergic rhinitis, patients often complain of fatigue, irritability, frustration, self-consciousness, having less energy and motivation, alertness and ability to concentrate. Likewise the presence of co-morbidities like asthma, otitis media and sinusitis also impacts on the quality of life of the patients. Thus the annual costs of treating asthma and allergic rhinitis, both direct costs (medications and hospitalization) and indirect costs (time lost from work, premature death) are substantial and can take their toll especially in a developing country like the Philippines. Approximately US$ 20 billion are spent globally each year in relation to allergic rhinitis which includes the cost of medications, lost work productivity and physician consultations [1]. This socio-economic impact can be attributed to the increasing prevalence of allergic rhinitis. The 2008 State of the World Allergy Report stated that an estimated 400 million persons worldwide have allergic rhinitis [2]. In the US, allergic rhinitis affects 30-60 million people annually with the children more affected than adults [3]. Two large international studies namely the European Community Respiratory Health Survey and International Study of Asthma and Allergies of Childhood (ISAAC) Phase 1 have studied the prevalence of asthma and allergic rhinitis worldwide using standardized questionnaires. Results showed variation in prevalence between centers and regions with highest prevalence (>30%) reported mainly in the centers from middle and low income countries, particularly in Africa and Latin America. Other areas with high prevalence of rhinitis were Australia, New Zealand, United Kingdom and Hong Kong. The lowest prevalence of rhinoconjunctivitis (<5%) were found in parts of Eastern Europe, Indonesia, Greece, China, Taiwan, Uzbekistan, India, and Ethiopia [2].
In Asia, a rising trend in the prevalence of allergic rhinitis and asthma was observed, particularly in low to middle-income countries according to the epidemiologic data from the ISAAC phase III. According to the 2008 World Allergy Report [2], the estimated prevalence of allergic rhinitis among adults in the Asia Pacific region was between 10% and 32%.
In 1996, the Philippines which participated in the ISAAC survey had a reported 26-32% prevalence of allergic rhinitis among subjects aged 13-14 years [4, 5]. In 2003, during the 6th National Health and Nutrition Survey (NNHeS), the prevalence of allergic rhinitis among adults 20 years and above using the ISAAC core questionnaire was 26.8% (unpublished data). However the survey was conducted only within Metro Manila. Since then, there has been little information regarding the nationwide prevalence of allergic rhinitis in the Philippines. In 2008, NNHeS conducted a nationwide survey on the prevalence of leading diseases including atopic diseases. This article reports the prevalence of allergic rhinitis in adults nationwide.
MATERIALS AND METHODS
Sampling design of National Nutrition Survey (NNS)
The 7th (2003) NNS utilized the National Statistics Office 2008 Labor Force Survey master sample employing a stratified multi-stage sampling design in order to represent each of the 17 regions in the country. The first stage of the sampling was the selection of the Primary Sampling Units (PSUs) with probability proportional to the estimated number of households. PSUs consisted of a barangay or contiguous barangays with at least 500 households. The second stage was the selection of Enumeration Areas (EAs) within sampled PSUs with the probability proportional to size. EAs consisted of contiguous area in a barangay or a barangay with 150-200 households and served as the Secondary Sampling Unit. The last stage was the selection of housing units within the sampled EAs and served as the ultimate sampling unit. As such, the household was considered as a cluster in which all the units within a cluster were part of the survey. The clinical and health component in particular covered only one of the four replicates of the master sample and 25 percent of sample households were considered as sub-sample. Sub-sampling of households for clinical and health component was resorted due to budgetary constraints. A replicate is defined as a sub-sample that possesses the properties of the full master sample such that each replicate is able to generate national level estimates of adequate precision.
According to the National Statistic Coordinating Board, the following are the definitions of topography and location of respondents.
Based on topography there were three recorded variables:
Based on location, "urban" areas fall under the following categories:
In their entirety, all municipal jurisdictions which, whether designated chartered cities, provincial capital or not, have a population density of at least 1,000 persons per square kilometer: all barangays;
Poblaciones or central districts of municipalities and cities which have a population density of at least 500 persons square kilometer;
-
Poblaciones or central districts not included in (1) and (2) regardless of the population size which have the following:
Barangays having at least 1,000 inhabitants which meet the conditions set forth in (3) above and where the occupation of the inhabitants is predominantly non-farming or fishing.
"Rural" areas are defined as all poblaciones or central districts and all barrios that do not meet the requirements for classification of urban.
Questionnaires
The NNHeS survey instrument used for the diagnosis of rhinitis was a standardized questionnaire that was validated locally. This questionnaire contained 4 items from a pre-validated ISAAC screening instrument for nose problems among children and adolescents [6]. Based on the questionnaire, rhinitis was described as "a problem with sneezing" or "a runny or blocked nose". Concurrent validity of the core questionnaire was determined in the SCARPOL study. The core questionnaire was tested by comparing them with results of skin test among Swiss children [7]. Results showed that the specificity of the questions was high (77.5-97.6%) but sensitivity was low (2.6-42.7%).
Prior to the survey, the core questionnaire was pretested among residents of Bicutan, Taguig City, Metro Manila in April 2008. This was performed in order to test the correctness, clarity, time requirement and suitability of each question before the booklets were finalized and reproduced. The survey questionnaire was also approved by the Ethics and Clearance Committee of the National Statistical Coordination Board.
Data collection
Face-to-face interview on various questions on selected signs and symptoms including clinical histories to elicit information regarding other non communicable diseases such as "bangungot" (sudden unexpected cardiac death in the Philippines), peripheral vascular disease, cardiovascular disease, chronic kidney disease, hyperuricemia, microalbuminuria, musculoskeletal disease, osteoporosis, asthma, rhinitis, and allergy. In addition, lifestyle risk factors such as smoking, alcohol intake, physical inactivity and diet were included. A guide for interviewing was taken into consideration in the conduct of face-to-face interview developed by the FNRI-DOST.
Data editing, encoding and analysis
All team leaders conducted field data editing based on the manual of instructions to ensure correctness, completeness and validity of collected data. Team coordinators, on the other hand, performed spot checking of accomplished forms as part of field editing process in order to reduce errors in data entry. Simultaneously with data collection, data encoding was done by hired encoders at FNRI-DOST.
Data encoding used the MySQL database. To ensure correctness and validity of data, a two-round proofreading of the databases was done by hired validators. The first-round involved manual validation and the second was done through machine validation. When the data were cleaned, several data files were merged to create a master dataset followed by another checking and validation of the dataset to eliminate errors and inconsistencies. Weights were assigned and attached to the master dataset by a statistician in order that the distributions of the sample correspond more closely to their actual distributions in the whole population.
Stata software (StataCorp., USA) was used to process and analyze the clinical and health data to come up with the prevalence of disease and risk factors according to age.
RESULTS
In the 7th NNS Clinical and Health Component, a total of 3,744 eligible households were covered from 79 provinces and 3,377 EAs. The response rate obtained from interview of adults using the questionnaires was 93.7%. The survey covered all respondents of the randomly selected households consisting of 7,202 subjects 20 years old and above, 54% (3,885) were females and 46% (3,317) were males.
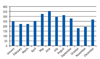
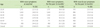
The overall prevalence of nose symptoms at any time in the past was 23.8%. The proportion among both sexes was similar. The prevalence was highest among the respondents aged 40-49 (Table 1).
Twenty percent reported nose symptoms in the past 12 months. The proportion of respondents who reported nose symptoms in the past 12 months was also similar between males and females and was likewise noted to be highest in the 40-49 age group (Table 1).
Nose as well as eye problems were also reported according to age group and sex. The over-all prevalence of nose and eye symptoms was 14.0% The over-all prevalence of nose and eye symptoms in the past 12 months showed a statistically significant difference across age groups with respondents in 40-49 and 70 & over age group having the highest prevalence at 15.3 and 16.5% respectively (Table 1).
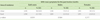
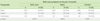
Respondents from the rural area reported a higher prevalence of nose symptoms in the past twelve months compared to respondents from the urban area (p value 0.0519) (Table 2).
DISCUSSION
Although not a life threatening disease, allergic rhinitis significantly reduces the quality of life of sufferers leading to employee absenteeism and presenteeism (loss of productivity at work). Approximately US$ 20 billion are spent globally each year in relation to allergic rhinitis, which includes the cost of medications, lost work productivity and physician consultations [1]. Improvement in identification of risk factors and triggers, health care delivery, public awareness, appropriate management and implementation of preventive measures are needed to improve the quality of life of allergic patients. One of the initial steps towards attaining this goal is a prevalence survey to assess the burden of illness and its economic impact.
In 2008, the reported prevalence of allergic rhinitis worldwide was 10-30% while in the Asia Pacific region, the prevalence ranged from 10 to 32% in adults [2]. The prevalence is still increasing worldwide. However, prevalence reports in the Philippines among adults are scarce. Literature search covering the past 20 years showed only one prevalence report from the ISAAC study [4]. In 1996, the Philippines was one of the 38 countries in Europe, Africa and Asia-Pacific that participated in the ISAAC study. Results showed that Filipinos in Metro Manila aged 13-14 years had one of the highest prevalence rates of allergic rhinitis at 32.5% [4]. During the 2003 6th NNHeS survey, the reported prevalence of allergic rhinitis based on nose problems in the past 12 months among Filipinos in the National Capital Region (NCR) ages 20 and above was 26.8% (6-35%). The highest prevalence was reported among the 30-39 age group. In 2009, another survey was conducted by the NHES among residents 40 years and above in the NCR using the same ISAAC core questionnaire. Result of the unpublished data showed that the overall prevalence of allergic rhinitis based on nose problems in the past twelve months was 16.3%.
In the 2008 NNHeS survey the estimated over-all prevalence of allergic rhinitis based on nose symptoms in the past 12 months (sneezing, or any runny, blocked nose in the absence of cold or the flu) and at any time in the past were 20% and 23.8% respectively. The results showed that the nationwide prevalence of rhinitis is within the range of rhinitis prevalence in the Asia Pacific region [2].
However comparison of the present survey with previous epidemiologic surveys done locally such as the 1996 ISAAC, the 2003 and 2009 NNHeS may prove to be inaccurate for several reasons. Although the 1996 ISAAC report, the 2003, 2008 and 2009 NNHeS survey utilized the same rhinitis definition and questionnaire (ISAAC core questionnaire), they differed in the age group of the subjects and the geographic areas surveyed. The 1996 ISAAC survey, the 2003 and 2009 NNHeS survey were conducted in MetroManila and the NCR respectively, involving subjects from different age groups. The ISAAC surveyed teens 13-14 years old while the 2003 NNHeS survey included all adults 20 years and above. The 2009 survey included only residents 40 years old and above. On the other hand the present survey (2008), using the ISAAC core questionnaire was expanded to include all adult patients ages 20 and above, nationwide. The difference in the choice of subjects in terms of age and location are important factors that may contribute significantly to the different outcome of the surveys. A more logical and useful approach is to compare longitudinal studies using the same method at different periods of time.
The prevalence of nose symptoms within the past 12 months was 20.0%. When nose and eye symptoms were combined, the prevalence rate was 14%. Allergic rhinitis is often accompanied by allergic conjunctivitis (a disease complex sometimes referred to as allergic rhinoconjunctivitis) that produces conjunctival injection and chemosis associated with symptoms of itchy eyes and tearing. Sensitivity to pollens is more frequently seen in patients with rhinoconjunctivitis, whereas sensitivity to dust mites is reported to cause less ocular symptoms [6].
The present survey also showed that the prevalence of nose symptoms was similar across the 12 months of the year indicating the perennial nature of the nose problem in the Philippines. Perennial rhinitis is more commonly observed in tropical countries like the Philippines while seasonal allergic rhinitis is more evident in temperate countries where the four seasons are experienced. Common aeroallergens that sensitize patients with perennial allergic rhinitis are indoor allergens that are present throughout the year such as house dust mite. According to the study of Dr. Cua-Lim [7] in 1994 and unpublished observations of Dr. Distor in 2005, the most common allergens to sensitize Filipino patients were house dust mite and cockroach which are indoor allergens present throughout the year.
Aside from allergens, perennial rhinitis may also be attributable to exposure to irritant pollutants. Although there is a downward trend demonstrated in the levels of Total Suspended Particles (TSP) from 2003-2007, from 144 to 97 µgm/Ncu.m., TSP geometric mean concentrations are still above the 90 µg/Ncu.m annual mean TSP guideline value for one year [8]. Other diseases with symptoms that overlap with allergic rhinitis are sinusitis, respiratory infections and vasomotor rhinitis.
Studies in North America, Europe and Central America have shown a higher prevalence of allergic rhinitis in urban than in rural areas [9]. However in the present survey, the respondents from the rural area reported a higher prevalence of nose symptoms for the past twelve months compared to respondents from urban area. This variation in rates may be due to differences in risk factors and triggers present in different geographical areas [9].
The high prevalence noted in the elderly is not consistent with the natural history of allergic rhinitis. In general, symptoms of allergic rhinitis tend to improve and skin test reactivity slowly disappears with increasing age [10]. Problems encountered in surveys using questionnaires may account for these results. It has been observed that in surveys using rhinitis questionnaire, around 50-60% of non allergic rhinitis and rhino sinusitis have been attributed to allergy [11]. Non-allergic rhinitis such as irritant and atrophic rhinitis are commonly experienced by the elderly that can be mistaken for allergic rhinitis. The elderly population is also susceptible to medication related rhinitis considering the wide array of medications prescribed for age related diseases and co-morbidities [9]. Patients may exaggerate symptoms of rhinitis while some may dismiss or ignore these symptoms.
An inherent problem in wide epidemiologic surveys using questionnaires is the failure to comply with the strict definition of allergic rhinitis [11]. This is one limitation of our survey. It is difficult especially in terms of logistic and manpower resources, to obtain laboratory or objective evidence of allergic response (e.g. skin test) or for physicians and specialists to visit our respondents individually considering the epidemiologic setting involving a large population nationwide. Hence, the figures obtained in prevalence studies may be an exaggeration of the actual prevalence. On the other hand, the reported specificity of the core questionnaire during validation in the SCARPOL study was high (77.5% to 97.6%), which makes it useful for ruling out but not helpful in detecting atopy since the sensitivity is low (2.6% to 42.7%). This may lead to an underestimation of the prevalence [12].
The potential for over- or under-estimation of prevalence rates in wide epidemiologic surveys is a well-recognized limitation. However, what is deemed more important in these types of surveys is to have a standard epidemiologic tool (eg. definition of rhinitis, asthma, etc.), which may be utilized across nations. This will allow a more meaningful and relevant comparison of prevalence rates worldwide.
In the past, allergic rhinitis was generally considered to be a trivial condition. However, more recent reports recognize the substantial impact it has on the socio-economic realm as well as on the quality of life of patients with allergic rhinitis. Knowing the trends in the prevalence of allergic diseases can assist stakeholders in mapping out health policies and plans, in improving access to medical care and in achieving better control of symptoms, thus eventually improvement the quality of life of our patients.
In conclusion, the over-all prevalence of allergic rhinitis in Filipino adults in this study is 20%. This value is considered to be within the range of the reported prevalence rates in the Asia-Pacific Region.
 XML Download