

 PDF
PDF ePub
ePub Citation
 Print
Print


Abstract
The present study deals with the determination of optimal values of operating parameters such as the temperature of heating, the mass of the plant material and the volume of water leading to the best yield of electromagnetic induction (EMI) heating extraction of Algerian Thymus fontanesii essential oil. After an appropriate choice of the three critical variables, eight experiments leaded to a mathematical model as a first-degree polynomial presenting the response function (yield) in the relation to the operating parameters. From the retained model, we were able to calculate the average response, the different effects and their interactions. The maximum of essential oil recovery percentage relative to the initial mass of plant material was 1.69%, and was obtained at (140oC, 250 g and 4.5 L). The chemical composition of the Algerian T. fontanesii essential oil under the obtained optimal conditions (140oC, 250 g and 4.5 L), determined by GC/MS and GC/FID, reveled of the presence of major components such as: carvacrol (70.6 ± 0.1%), followed by p-cymene (8.2 ± 0.2%).
Go to : 
References
(1). Morales R.., Stahl-Biskup E.., Sáez, F. The history botany and taxonomy of the genus Thymus. Thyme: the genus Thymus; Medicinal and Aromatic Plants; Taylor and Francis: U.K,. 2002. 1–43.
(2). Nabavi S. M.., Marchese A.., Izadi M.., Curti V.., Daglia M.., Nabavi S. F.Food Chem. 2015. 173:339–347.
(3). Barros L.., Heleno S. A.., Carvalho A. M.., Ferreira I. C.LWT-Food Sci. Technol. 2010. 43:544–550.
(4). Zarzuelo A.., Crespo E.The medicinal and non-medicinal uses of thyme. In Thyme: the genus Thymus, CRC Press:. 2002.
(5). Mann J.Phytochemistry. 1998. 48:585.
(6). Casiglia S.., Bruno M.., Scandolera E.., Senatore F.Arab. J. Chem, In Press, 2015. In Press,. 2015.
(7). Stahl-Biskup E.., Sáez F.Thyme: the genus Thymus; Medicinal and Aromatic Plants; Taylor and Francis: London,. 2002.
(8). Ghannadi A.., Sajjadi S. E.., Kabouche A. Z.Naturforsch. C. 2004. 59:187–189.
(9). Starmans D. A.., Nijhuis H. H.Trends Food Sci. Technol. 1996. 7:191–197.

(10). Wang L.., Weller C. L.Trends Food Sci. Technol. 2006. 17:300–312.
(11). El Asbahani A.., Miladi K.., Badri W.., Sala M.., Aït Addi E. H.., Casabianca H.., El Mousadik A.., Hartmann D.., Jilale A.., Renaud F. N. R.., Elaissari A.Int. J. Pharm. 2015. 483:220–243.
(12). Ammar A. H.., Zagrouba F.., Romdhane M.Flavour Frag. J. 2010. 25:503–507.
(13). Adams R. P.Quadrupole mass spectra of compounds listed in order of their retention time on DB-5. Identification of essential oils components by gas chromatography: quadrupole mass spectroscopy; Allured Publishing Corporation: USA,. 2001. , 3rd ed.
(14). Joulain D.., König, W. A. J. The Atlas of Spectral Data of Sesquiterpene Hydrocarbons. E.B. –Verlag Hambourg J.Nat. Prod.,. 1999. 62(8):1212–1213.
(15). Babushok V. I.., Linstrom P. J.., Zenkevich I. G. J.Phys. Chem. Ref. Data. 2011. 40:043101.
(16). Huiping L.., Guoqun Z.., Shanting N.., Yiguo L.Comput. Mater. Sci. 2007. 38:561–570.
(17). Ravikumar K.., Krishnan S.., Ramalingam S.., Balu K.Dyes Pigm. 2007. 72:66–74.
(18). Bekhechi C.., Bekkara F. A.., Abdelouahid D. E.., Tomi F.., Casanova J. J.Essent. Oil Res. 2007. 19:594–596.
(19). Sidali L.., Brada M.., Fauconnier M. L.., Lognay G.., Heuskin S.PhytoChem Biosub J. 2017. 11:11.
(20). Mouhi L.., Moghrani H.., Nasrallah N.., Amrane A.., Maachi R. J.Food Biochem. 2017. 41:1–9.
(21). Dob T.., Dahmane D.., Benabdelkader T.., Chelghoum C.Pharm. Biol. 2006. 44:607–612.
(22). Bailer J.., Aichinger T.., Hackl G.., de Hueber K.., Dachler M.Ind. Crops Prod. 2001. 14:229–239.
(23). Desai M. A.., Parikh J.., De A. K.Modelling and optimization studies on extraction of lemongrass oil from Cymbopogon flexuosus (Steud.) Wats Chem. Eng. Res. Des. 2014. 92:793–803.
Go to :
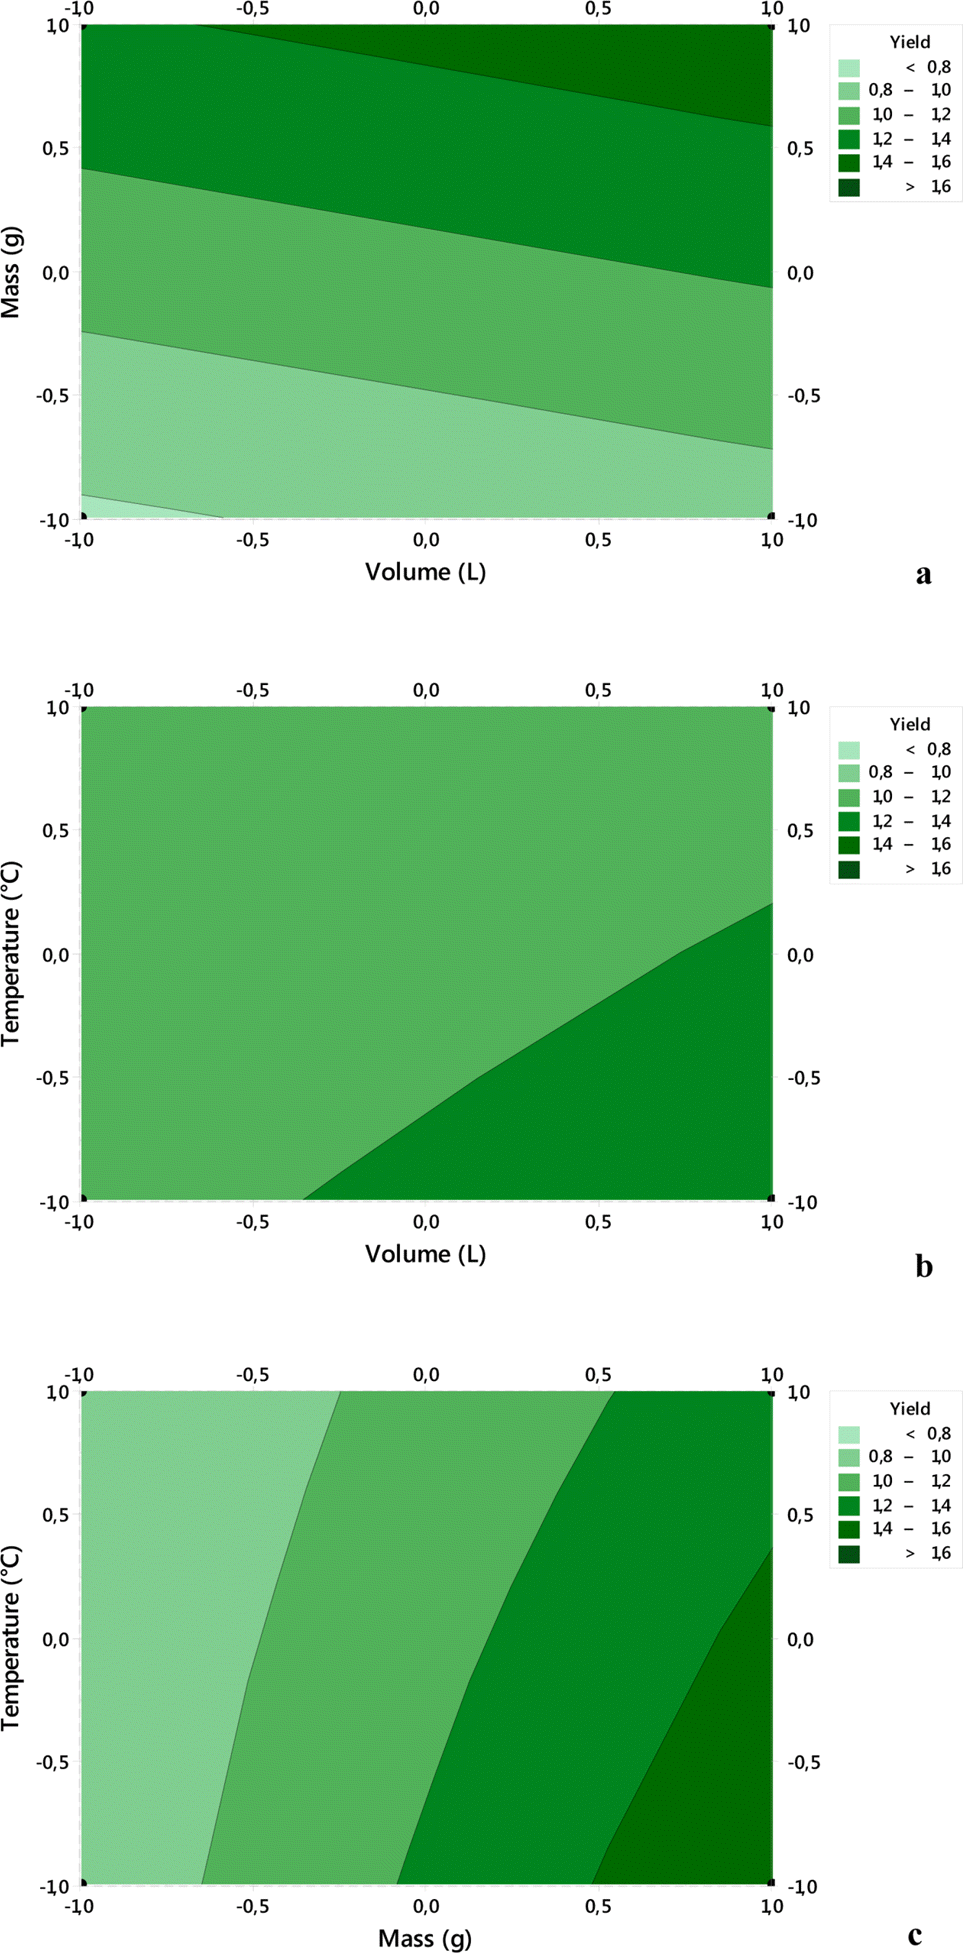 | Fig. 2.Interaction effects of parameters on the essential oil yield using the 2D contours: (a): mass and volume, (b) temperature and volume, (c) Temperature and mass. |
Table 1.
Codes and levels of independent variables used in the experimental design
| Independent variables | Symbols | Coded levels | |
|---|---|---|---|
| Low (−1) | High (+1) | ||
| Temperature (°C) | X1 | 140 | 220 |
| Mass (g) | X2 | 100 | 250 |
| Volume (L) | X3 | 2 | 4.5 |
Table 2.
Experimental matrix
Table 3.
ANOVA of the fitted model
| Statistics | |||||||||
|---|---|---|---|---|---|---|---|---|---|
| Factors (coded) | Effect | Standard error | Sum of squares | DF | Mean squares | F-value | ta | pb | Remark |
| a0 | 1.1463 | 0.0187 | 61.13 | 0.01 | significant | ||||
| a1 | –0.0837 | 0.0187 | 0.0561 | 1 | 0.0561 | 19.95 | 4.47 | 0.14 | |
| a2 | 0.3037 | 0.0187 | 0.7381 | 1 | 0.7381 | 262.44 | –16.2 | 0.039 | signifucant |
| a3 | 0.0737 | 0.0187 | 0.0435 | 1 | 0.0435 | 15.47 | –3.93 | 0.158 | |
| a12 | –0.0512 | 0.0187 | 0.0210 | 1 | 0.0210 | 7.47 | –2.73 | 0.223 | |
| a13 | –0.0112 | 0.0187 | 0.0010 | 1 | 0.0010 | 0.36 | –0.6 | 0.656 | |
| a23 | –0.0013 | 0.0187 | 0,0001 | 1 | 0,0001 | 0.00 | 0.07 | 0.958 | |
| Pure error | 0.0028 | 1 | 0.0028 | ||||||
| Total | 0.8625 | 7 | |||||||
Table 4.
Chemical composition of T. fontanesii essential oil
 XML Download