

 PDF
PDF ePub
ePub Citation
 Print
Print


Introduction
Helminthostachys zeylanica (Linnaeus) Hook is a terrestrial, herbaceous, fern-like plant native to south-east Asia and Australia.1 They can be found in open shade and places with clay or laterite soil. The young leaves of H. zeylanica are popular as salad vegetables as they are excellent source of phophorus and iron. The plant was traditionally used in the treatment of tuberculosis, asthma, snake bite, malaria and diarrhea.1 The antioxidant properties of H. zeylanica have been well-characterized. A few phenylated flavonoids were isolated from the rhizome extract, which contribute to its excellent free radical scavenging activity.2 Besides, Suja et al. also reported that the rhizome extract exhibited significant hepato-protective effect in their in vivo studies.3
Foodborne illnesses remain as a global public health problem. These illnesses are caused by the presence of microorganisms in food mainly due to inappropriate food preparation or cooking process.4 Based on the study conducted in United States, 14% of the foodborne illnesses were caused by Bacillus cereus, with an estimated treatment cost of USD 166 per illness.5 B. cereus are Gram positive rod bacteria that commonly found in soil and food. They are well known as a food poisoning causing agent since 1955 via production of toxic metabolites.5 B. cereus are also commonly found in variety of dried food products as vegetative cells or endospores, which are hardly destroyed during the cooking process.6 The emetic form of the disease is caused by the heat stable emetic toxin, ETE that resembles to Staphylococcus aureus food poisoning in term of its symptoms and incubation period.7 Diarrheal form of B. cereus food poisoning is primarily characterized by abdominal cramps and diarrhea following an incubation period of 8 to 16 h due to the heat labile enterotoxin produced by the bacterium.6
In Malaysia, food poisoning cases are common due to its hot and humid climate that promotes the growth of foodborne microorganisms.7 B. cereus outbreak is taken into serious account because rice is regarded as staple food in Malaysia. Sandra et al. reported that both raw and cooked rice sampled in Selangor, Malaysia were detected with B. cereus contamination, with 100% prevalence rate in the rice sample.8 Besides, Abdul-Mutalib et al. also reported the detection of B. cereus on restaurant cutting boards collected in Seri Kembangan, Malaysia via pyrosequencing analysis.9 Prevention and control of B. cereus is important to control the incidence and mortality of foodborne intoxications caused by the bacterium. Thus, this study was aimed to investigate the antimicrobial potential of H. zeylanica on foodborne B. cereus, including the effects of the extract on growth dynamic and cellular morphology. Besides, the chemical composition of its ethanolic extract was also determined.
Experimental
Collection of Plant Materials
The plant samples were collected at Kampung Kebun Relong, Pendang, Kedah, Malaysia. The area of cultivation is a rubber estate. The fronds of the plant collected were free from any visible symptoms of plant disease. The samples were deposited at herbarium, Universiti Kuala Lumpur. All the samples were then dried at 60℃ until a constant weight were obtained. After that, the dried samples were ground using food blender until fine granules were obtained.
Extraction
The dried frond samples were soaked in ethanol (Fisher) at a ratio of 1:20 (w/v) for 3 days. The mixture was stirred from time to time to ensure the homogeneity of the sample. Then, the mixture was filtered with Whatman No1 filter paper. The filtrate was concentrated with rotary evaporator at 50℃ under reduced pressure until a crude extract paste was obtained.
Test Bacterium
The test bacterium, B. cereus was previously isolated from cooked rice sample. The bacterial culture was maintained at Upstream Bioprocessing Laboratory, Universiti Kuala Lumpur. The bacterial inoculum used for bioassays was prepared by transferring a loopful of bacterial colony into sterile saline. The turbidity of the suspension was adjusted to match with Mc Farland 0.5 standard.
Kirby Bauer Assay
The assay was performed to screen the antibacterial potential of the frond extract. 100 µL of bacterial inoculum was spread on Muller Hinton broth (Merck) plate by using a bent glass rod. Then, 20 µL of 50 mg/ml frond extract dissolved in methanol (Fisher) was pipetted onto the sterile paper disc. Chloramphenicol at concentration 50 µg/mL was used as positive control, and 20 µL of methanol was also included to detect the solvent effect. The plate was then incubated at 37℃ for 24 h. The diameter of the clear zone surrounding the paper disc was measured by using a ruler after the incubation period.
Broth Microdilution Assay
The assay was performed according to protocol defined by Tong et al.10 to determine the antimicrobial susceptibility of the frond extract. The bacterial inoculum prepared was diluted with double strength Muller Hinton broth (Merck) at a ratio of 1:10 (v/v). A sterile 96 well microtiter plate with flat bottom was used for this assay. The extract was prepared at initial concentration of 1.56 to 50 mg/mL by diluting the extract with methanol. The prepared extract was then diluted to the concentration to be tested after addition of 100 µL diluted inoculums. The final volume in each well was 200 µl. Methanol added with bacterial inoculums was included as growth control. The plate was incubated at 37 ℃ for 24 h. After that, 40 µL of 0.2 mg/mL Iodonitrotetrazolium Violet (INT) (Sigma) was added into each well and incubated for 30 min at 37℃. The INT was served as a growth indicator where the color change of the broth from yellow to pink indicates bacterial growth. The minimal inhibitory concentration (MIC) is defined as the lowest concentration of the frond extract to prevent the color change of INT. Then, to determine the viability of bacterial cells, one loopful of the sample in each well was streaked on Muller Hinton agar plates. The plates were then incubated at 37℃ for 24 h. Minimal bactericidal concentration (MBC) is defined as the lowest concentration of the extract that killed the bacterial cells.
Growth Dynamic Analysis
In this study, 20 ml of Muller Hinton broth was incubated with 1 ml of bacterial inoculum for 2 h at 37℃. The extract was added into the broth at 3 different concentrations: MIC, MBC and 2× MBC. The flasks were then incubated at 37℃ with a rotational speed of 120 rpm. Methanol was included as negative control in this experiment. Sampling times for the cultures included 0, 4, 8, 12, 16, 20, 24, 28, 32, 36, 40, 44 and 48 h. Samples (500 µl) were withdrawn from each flask at each designated time point and suitably diluted with 1:10 (v/v) serial dilution technique in sterile saline. The diluents were then spread on Muller Hinton agar plates. Plates were incubated for 24 h at 37℃. Then, the number of colony forming unit (CFU) on each plate was enumerated, and an average was recorded for each time point. A growth dynamic curve was plotted based on the data obtained.
Cellular Morphology Change in Bacillus cereus
In this study, the bacterial inoculum was streaked on the surface of Muller Hinton agar plate by using a sterile cotton swab. Plates were incubated at 37℃ for 24 h. Then, 1 ml of 50 mg/mL extract was pipette onto the bacterial culture. The extract was spread by swirling the agar plate. Methanol was served as negative control. The plates were further incubated at 37℃ for 24 h. The morphology of the bacterial cells was observed under scanning electron microscope (Leo Supra 50VP).
Gas Chromatography Mass Spectrometry (GCMS) Analysis
GCMS analysis was performed with Hewlett-Packard 6890N gas chromatography system equipped with mass spectrometer (Hewlett-Packard 5973 inert mass selective detector). The compounds were separated in HP-5MS column (length 30.0 m, internal diameter. 0.25 mm, film- 0.25 µm). The ethanolic extract was injected with a split ratio of 5:1, helium was used as carrier at 1.2 mL/min. The column temperature was set at 70℃ for 1 min after sample injection then increased at 30℃/min to the final temperature of 280℃. The mass spectrum library NIST02 was applied for the identification of detected compounds.
Result and Discussion
The treatment of the fern samples prior to extraction is crucial as it affects the bioactive compounds extracted. This is because the compounds present in the sample can be rapidly degraded by oxidative, enzymatic or polymerization process. Hence, the samples need to be dried prior to extraction to reduce the spoilage and chemical degradation.11 Selection of extraction solvent is crucial so that desired bioactive compounds can be isolated from the plant sample. Tong et al. stated that the type of organic solvents affect the type of natural product extracted, and hence the biological activity of the crude extract.10 Ethanol was commonly used as extraction solvent for antibacterial study of ferns.12 Their studies showed the presence of antibacterial compounds in the ethanolic extract of the fern samples. The crude extract obtained was dark green in color, with an extraction yield of 5.11%. Puri et al. also reported that the ethanol improves the extraction yield of bioactive compounds by disrupting the plant cell wall.13
Table 1 shows the antibacterial efficacy of the frond extract on B. cereus. The ethanolic extract showed significant inhibitory activity on B. cereus with a sizeable clear zone (16.3 ± 0.6 mm) detected on the plate. The negative control did not show any inhibitory effect on B. cereus. The results were in agreed with Batubara et al. where they reported the antibacterial activity of H. zeylanica against a Gram Positive Bacteria, Propionibacterium acne.1 The principal component analysis conducted by Wong et al. also showed that the extract of H. zeylanica was rich in flavonoid compounds.14 Flavonoids are responsible for the antimicrobial activity of some plant extracts, as these compounds can destroy the proteins present on bacterial membrane.15 Huang et al. also stated that the flavonoid compounds present in the H. zeylanica frond extract were ugonin, flavonone and quercetin.2
On broth microdilution assay, the MIC of the extract on B. cereus was 6.25 mg/ml and the MBC was 12.5 mg/mL. The result was acceptable as Banfi et al. stated that the test result is valid if the growth control showed significant microbial growth and the sterility control showed no viable microorganisms.16 The MBC recorded was significantly higher than its MIC, mirroring that the antibacterial activity of the extract was concentration dependent. A higher concentration of extract was needed to subdue the bacterial cells, than just to inhibiting its growth. We can also say that the inhibitory activity of the extract on B. cereus was bactericidal, as the MBC obtained is not more than 4 times of its MIC.17 No data was available for comparison as up to dates, the inhibitory activity of H. zeylanica on B. cereus was not reported.
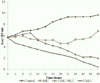
The rate of bactericidal activity can be measured by time-kill analysis as it allows us to access the speed which killing may occur at a given antibiotic concentration.18 The standard plate count method was employed to enumerate the bacterial cells in the sample. This method was used because it enumerates only the living cells present in the sample. This is important to study the bacterial killing efficacy of an antimicrobial agent. Fig. 1. shows the growth dynamic analysis of B. cereus after exposure to H. zeylanica ethanolic extract. The control growth curve showed algorithmic growth throughout the test period, with significantly high CFU recorded throughout 48 h of incubation. In overall, the antibacterial efficacy of H. zeylanica extract was concentration dependent, with a lower CFU count with increased extract concentration. At the concentration of MIC, the extract showed bacteriostatic effect on the bacterial population within 28 h, but a regrowth was observed at 32 h. The extract killed 99.9% of the test bacteria population at 36 h at concentration of MBC and 2× MBC. The results showed significant correlation with the testing results in broth microdilution assay. However, a lower CFU counts were obtained for concentration 2× MBC throughout the test period.
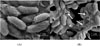
Fig. 2. shows the SEM micrograph of B. cereus cells after exposure to H. zeylanica extract for 24 h. SEM study is crucial to further validate the findings by observing the surface alterations of the bacterial cells after exposure to the frond extract. In general, all control B. cereus cells showed smooth-walled bodies, with typical rod shaped structures. The cell structures showed no sign of shrinkage or cavity formation. However, after 24 h of exposure to the ethanolic extract, many of the bacterial cells showed crumpled cell surfaces. The invaginations of cell wall were observed for some bacterial cells (indicated by the arrows). At this stage, the leakage of cellular material occurred and the cell structures collapsed.19 At this stage, the bacterial cells had completely lost their metabolic function.
The retention time, area and the match factor of the compounds detected in GCMS analysis are reported in Table 2. A total of 4 compounds were detected on the GCMS chromatogram with the match factor ≥ 88%. In general, the major constituents of the extract were phenol (36.26%) and quercetin (29.7%). The major compound in the extract demonstrated high percentage of match factor with phenol (PubChem CID: 996) and quercetin (PubChem CID: 5280343). Phenol is an aromatic organic compound that displays effective antimicrobial activity against a wide range of microorganisms.20 Phenols inhibit microbial growth by interacting with microbial cell membrane and inactivate their intra-cytoplasm.21 Ultee et al. also reported the antimicrobial activity of phenol against B. cereus.21 To date, no report was available on the isolation of phenol by H. zeylanica. Quercetin is a plant flavonoid that exhibits potent antioxidant activity. The antimicrobial activity of quercetin was extensively reported by Gatto et al.22 Quercetin was reported to exhibit its antimicrobial activity by inhibiting DNA gyrase of the target microorganisms.15
Conclusion
The ethanolic extract of H. zeylica fronds exhibited significant inhibitory activity on food borne B. cereus. The study also proved that the extract demonstrated significant damage to the morphology of the bacterial cells. The GCMS analysis of the extract showed the presence of phenol and quercetin.


 XML Download