Abstract
DF formula is comprised of three traditional herbs, Ephedra intermedia, Rheum palmatum and Lithospermum erythrorhizon, and locally used for treating of the metabolic diseases, such as obesity and diabetes in Korea. We tried to optimize the extraction conditions of two major components, (−)-ephedrine and (+)pseudoephedrine, in DF formula using response surface methodology with Box-Behnken design (BBD). The experimental conditions with 70% for EtOH concentrations, 4.8 hour for extraction hours and 8.7 times for the solvent to material ratio were suggested for the optimized extraction of DF formula with the highest amounts of (−)-ephedrine and (+)-pseudoephedrine in the designed model.
References
(1). Uzuner H.., Bauer R.., Fan T. P.., Guo D. A.., Dias A.., El-Nezami H.., Efferth T.., Williamson E. M.., Heinrich M.., Robinson N.., Hylands P. J.., Hendry B. M.., Cheng Y. C.., Xu Q. J.Ethnopharmacol. 2012. 140:458–468.
(2). Ferreira S. L.., Bruns R. E.., da Silva E. G.., Dos Santos W. N.., Quintella C. M.., David J. M.., de Andrade J. B.., Breitkreitz M. C.., Jardim I. C.., Neto B. B. J.Chromatogr. A. 2007. 1158:2–14.
(3). Roman M. C. J.AOAC Int. 2004. 87:1–14.
(4). Ma G.., Bavadekar S. A.., Davis Y. M.., Lalchandani S. G.., Nagmani R.., Schaneberg B. T.., Khan I. A.., Feller D. R. J.Pharmacol. Exp. Ther. 2007. 322:214–221.
(6). Stohs S. J.., Badmaev V.Phytother. Res. 2016. 30:732–740.
(7). Pittler M. H.., Schmidt K.., Ernst E.Obes. Rev. 2005. 6:93–111.
(8). Stohs S. J.Plast. Reconstr. Surg. 2013. 132:876e–877e.
(9). Aichner D.., Ganzera M.Talanta. 2015. 144:1239–1244.
(10). Wang H.., Song H.., Yue J.., Li J.., Hou Y. B.., Deng J. L.Cochrane Database Syst. Rev. 2012. CD008000.
(11). Papageorgiou V. P.., Assimopoulou A. N.., Ballis A. C.Curr. Med. Chem. 2008. 15:3248–3267.
(12). Hu Y.., Jiang Z.., Leung K. S.., Zhao Z.Anal. Chim. Acta. 2006. 577:26–31.
(13). Aslan, N; Cebeci Y.Fuel. 2007. 86:90–97.
(14). Schaneberg B. T.., Crockett S.., Bedir E.., Khan I. A.Phytochemistry. 2003. 62:911–918.
(15). Ichikawa M.., Udayama M.., Imamura K.., Shiraishi S.., Matsuura H.Chem. Pharm. Bull. 2003. 51:635–639.
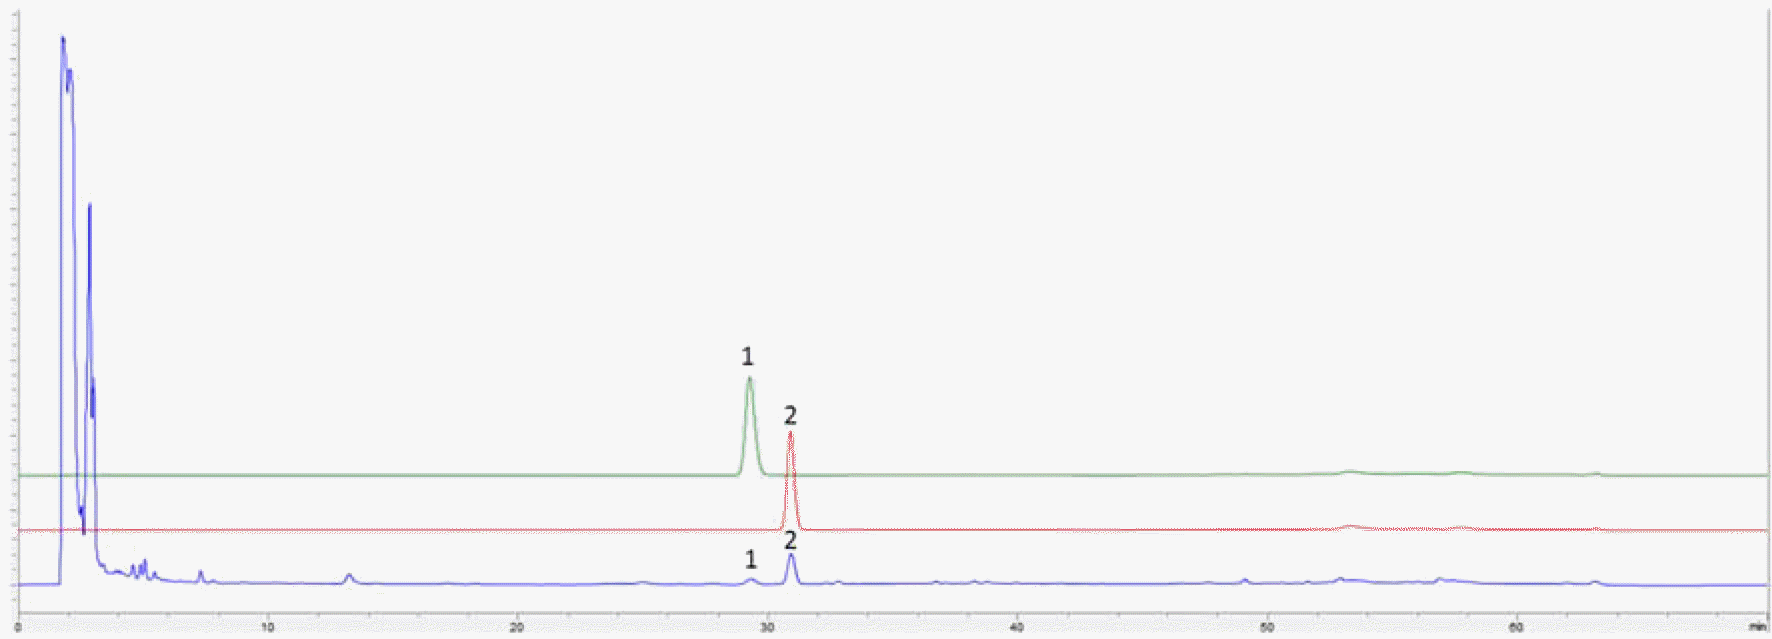
Fig. 1.
HPLC chromatograms of (+)-pseudoephedrine (1), (−)-ephedrine (2) and DF formula. The detailed HPLC conditions described in Experimental section.

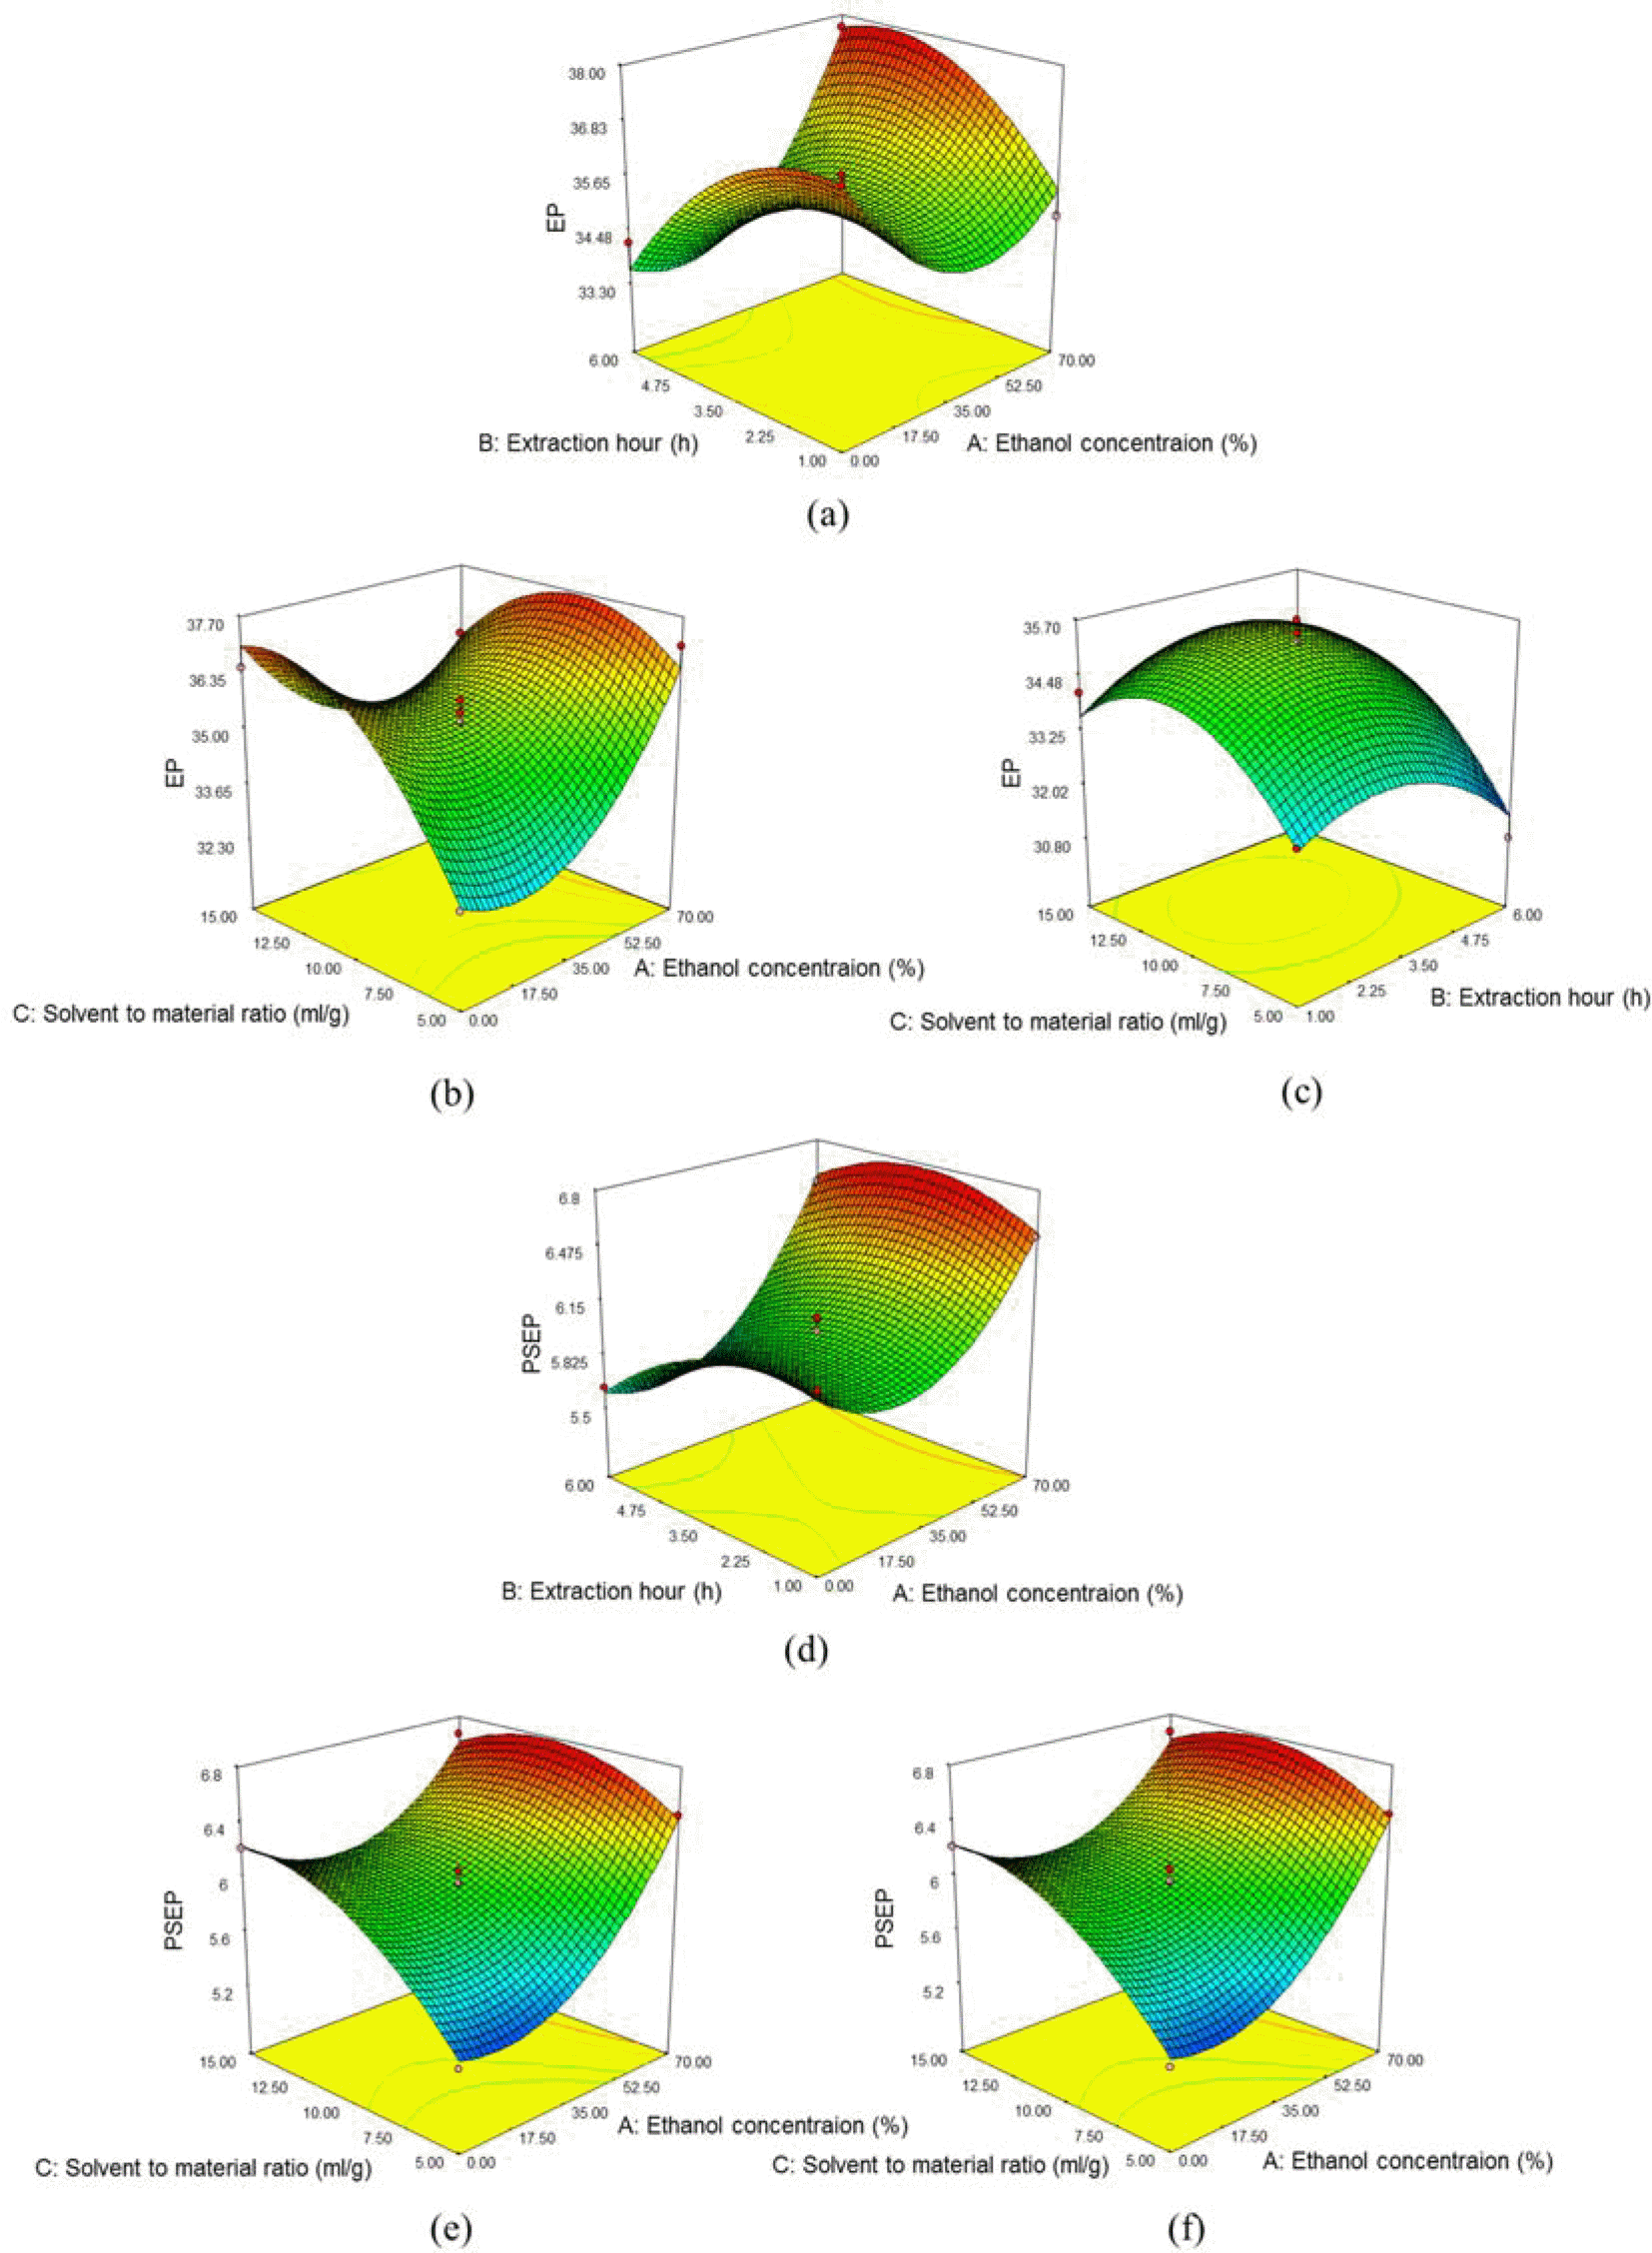
Fig. 2.
3D surface plots of the EtOH concentrations versus the extraction hours (a), the EtOH concentrations versus solvent to material ratio (b) and the extraction hours versus solvent to material ratio (c) for the yield of (−)-ephedrine (e), and the EtOH concentrations versus the extraction hours (d), the EtOH concentrations versus solvent to material ratio (e) and the extraction hours versus solvent to material ratio (f) for the yields of (+)-pseudoephedrine.

Table 1.
Experimental design and responses of the dependent variables to extraction conditions
| Std ordera | Run orderb | Coded variables | Independent variables | Dependent variables (responses) | |||||
|---|---|---|---|---|---|---|---|---|---|
| X1 | X2 | X3 | EtOH concentration (%) | Extraction time (hour) | Solvent to material ratio (ml/g) | EP (mg/g extract) | PSEP (mg/g extract) | ||
| 1 | 4 | 1 | 1 | 0 | 70 | 6.0 | 10 | 37.65 | 6.55 |
| 2 | 1 | –1 | –1 | 0 | 0 | 1.0 | 10 | 37.00 | 6.10 |
| 3 | 6 | 1 | 0 | –1 | 70 | 3.5 | 5 | 37.05 | 6.45 |
| 4 | 7 | –1 | 0 | 1 | 0 | 3.5 | 15 | 36.45 | 6.20 |
| 5 | 5 | –1 | 0 | –1 | 0 | 3.5 | 5 | 32.75 | 5.25 |
| 6 | 10 | 0 | 1 | –1 | 35 | 6.0 | 5 | 30.80 | 5.15 |
| 7 | 16 | 0 | 0 | 0 | 35 | 3.5 | 10 | 35.15 | 5.95 |
| 8 | 14 | 0 | 0 | 0 | 35 | 3.5 | 10 | 35.40 | 6.05 |
| 9 | 13 | 0 | 0 | 0 | 35 | 3.5 | 10 | 35.65 | 6.05 |
| 10 | 9 | 0 | –1 | –1 | 35 | 1.0 | 5 | 32.55 | 5.40 |
| 11 | 17 | 0 | 0 | 0 | 35 | 3.5 | 10 | 35.05 | 5.95 |
| 12 | 3 | –1 | 1 | 0 | 0 | 6.0 | 10 | 34.25 | 5.65 |
| 13 | 8 | 1 | 0 | 1 | 70 | 3.5 | 15 | 35.90 | 6.65 |
| 14 | 11 | 0 | –1 | 1 | 35 | 1.0 | 15 | 34.10 | 5.85 |
| 15 | 15 | 0 | 0 | 0 | 35 | 3.5 | 10 | 35.05 | 5.90 |
| 16 | 12 | 0 | 1 | 1 | 35 | 6.0 | 15 | 33.60 | 5.70 |
| 17 | 2 | 1 | –1 | 0 | 70 | 1.0 | 10 | 34.75 | 6.55 |
Table 2.
ANOVA for the response surface quadratic model of EPa
Table 3.
ANOVA for the response surface quadratic model of PSEPb
Table 4.
The comparison between predicted and experimental values.


 PDF
PDF ePub
ePub Citation
 Print
Print


 XML Download