Abstract
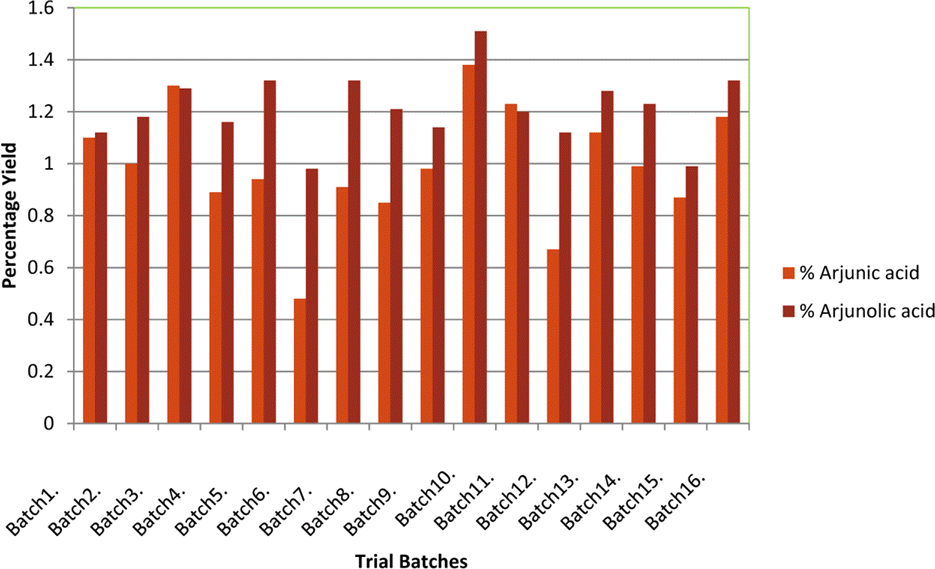
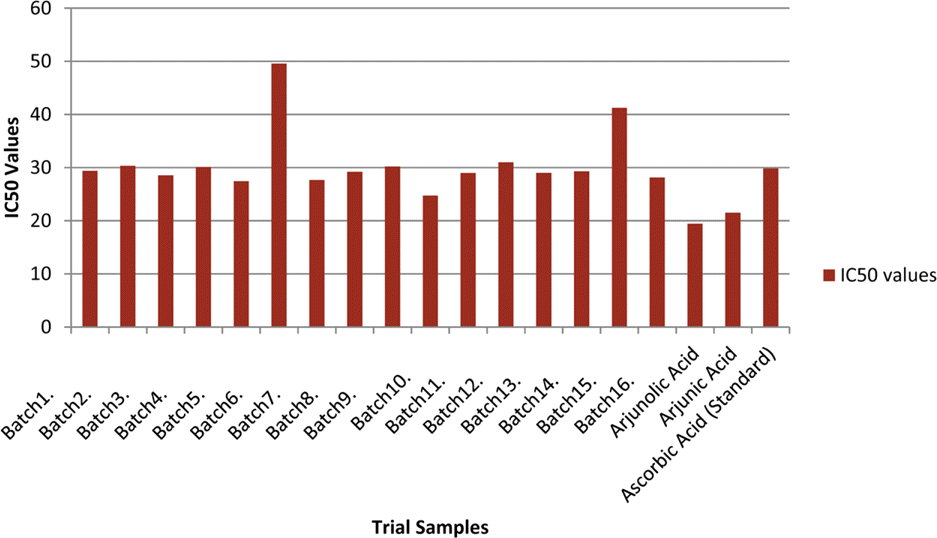
The optimization and microwave assisted extraction of stem bark of Terminalia arjuna, quantitative estimation of the marker compounds arjunic acid and arjunolic acid using HPTLC and the evaluation of free radical scavenging activity has been performed in this study. The central composite design was used for optimization and the values of parameters for optimized batch of microwave assisted extraction were 1000 W (Power), 3 minutes (Time) and 1/120 (Solid/solvent ratio). The solvent system to carry out the HPTLC was toluene: acetic acid: ethyl acetate (5: 5: 0.5) and quantitative estimation was done using standard equations obtained from the marker compounds. The in-vitro free radical scavenging activity was performed spectrophotometrically using ascorbic acid as standard. The value of estimated percentage yield of arjunic acid and arjunolic acid was 1.42% and 1.52% which upon experimentation was obtained as 1.38% and 1.51% respectively. The DPPH assay of the different batches of microwave assisted extraction and marker compounds taken suggested that the marker compounds arjunic acid and the arjunolic acid were responsible for the free radical scavenging activity as the batch having the maximum percentage yield of the marker compounds showed best free radical scavenging effect as compared to standard ascorbic acid. The IC50 value of the optimized batch was found to be 24.72 while that of the standard ascorbic acid was 29.83. Hence, the yield of arjunic acid and arjunolic acid has direct correlation with the free radical scavenging activity of stem bark extract of Terminalia arjuna and have potential to serve as active lead compounds for free radical scavenging activity.
References
(1). Sasidharan S.., Chen Y.., Saravanan D.., Sundram K. M.., Latha L. Y.Afr. J. Tradit. Complement Altern. Med. 2011. 8:1–4.
(2). Rufino M. S. M.., Alves R. E.., de Brito E. S.., Pérez-Jiménez J.., Saura-Calixto F.., Mancini-Filho J.Food Chem. 2010. 121:996–1002.
(4). Vlachojannis J.., Magora F.., Chrubasik S.Phytother. Res. 2011. 25:1102–1104.
(5). Staba E. J.., Chung A. C.Phytochemistry. 1981. 20:2495–2498.
(6). Aslam J.., Mujib A.., Nasim S. A.., Sharma M. P.Sci. Hortic. 2009. 119:325–329.
(7). Xie P.., Chen S.., Liang Y. Z.., Wang X.., Tian R.., Upton R. J.Chromatogr. A. 2006. 1112:171–180.
(8). Pozharitskaya O. N.., Ivanova S. A.., Shikov A. N.., Makarov V. G. J.Sep. Sci. 2007. 30:1250–1254.
(9). Pirisi F. M.., Cabras P.., Cao C. F.., Migliorini M.., Muggelli M. J.Agric. Food Chem. 2000. 48:1191–1196.
(10). de la Torre-Carbot K.., Jauregui O.., Gimeno E.., Castellote A. I.., Lamuela-Raventós R. M.., López-Sabater M. C. J.Agric. Food Chem. 2005. 53:4331–4340.
(11). Daferera D. J.., Ziogas B. N.., Polissiou M. G. J.Agric. Food Chem. 2000. 48:2576–2581.
(12). Akowuah G. A.., Zhari I.., Norhayati I.., Mariam A. J.Food Compos. Anal. 2006. 19:118–126.
(13). Mallavadhani U. V.., Sahu G.., Muralidhar J.Pharm. Biol. 2002. 40:508–511.
(14). Khatoon S.., Srivastava M.., Rawat A.., Mehrotra S.JPC-J. Planar Chromatogr. Mod. TLC. 2005. 18:364–367.
(15). Kumar A.., Lakshman K.., Jayaveera K. N.., Tripathi S. M.., Satish K. V.Jordan J. Pharm. Sci. 2010. 3:63–68.
(16). Pereira C. A.., Yariwake J. H.., Lanças F. M.., Wauters J. N.., Tits M.., Angenot L.Phytochem. Anal. 2004. 15:241–248.
(18). Hawthorne S. B.., Grabanski C. B.., Martin E.., Miller D. J. J.Chromatogr. A. 2000. 892:421–433.
(19). De Castro M. D. L.., Garcýa-Ayuso L. E.Anal. Chim. Acta. 1998. 369:1–10.
(20). Huddleston J. G.., Willauer H. D.., Swatloski R. P.., Visser A. E.., Rogers R. D.Chem. Commun. 1998. 16:1765–1766.
(21). Khan M. K.., Abert-Vian M.., Fabiano-Tixier A. S.., Dangles O.., Chemat F.Food Chem. 2010. 119:851–858.
(22). Dai J.., Mumper R. J.Molecules. 2010. 15:7313–7352.
(23). Núñez Sellés A. J.., Vélez Castro H. T.., Agüero-Agüero J.., González-González J.., Naddeo F.., De Simone F.., Rastrelli L. J.Agric. Food Chem. 2002. 50:762–766.
(24). Pourmortazavi S. M.., Hajimirsadeghi S. S. J.Chromatogr. A. 2007. 1163:2–24.
(25). Routray W.., Orsat V.Food Bioprocess Technol. 2012. 5:409–424.
(26). Kaufmann B.., Christen P.Phytochem. Anal. 2002. 13:105–113.
(27). Lu Y.., Ma W.., Hu R.., Dai X.., Pan Y. J.Chromatogr. A. 2008. 1208:42–46.
(28). Spigno G.., De Faveri D. M. J.Food Eng. 2009. 93:210–217.
(29). Devgan M.., Nanda A.., Ansari S. H.Pak. J. Pharm. Sci. 2013. 26:973–976.
(30). Devgun M.., Nanda A. R. U. N.., Ansari S. H.Acta Pol. Pharm. 2012. 69:475–485.
(31). Devgun M.., Nanda A.., Ansari, S. H; Swamy S. K.Res. J. Pharm. Technol. 2010. 3:644–649.
(32). Valko M.., Jomova K.., Rhodes C. J.., Kuèa K.., Musílek K.Arch. Toxicol. 2016. 90:1–37.
(33). Przyklenk K.., Kloner R. A.Circ. Res. 1989. 64:86–96.
(34). Prasad K.., Kalra J.Am. Heart J. 1993. 125:958–973.
(35). Puthur J. T.South Indian J. Biol. Sci. 2016. 2:14–17.
(36). Galano A.., Mazzone G.., Alvarez-Diduk R.., Marino T.., Alvarez-Idaboy J. R.., Russo N.Annu. Rev. Food Sci. Technol. 2016. 7:335–352.
(37). Fang Y.., Luo Y.., Yu P. J.Renew. Sust. Energ. 2016. 8:033103.
(38). Choi S.., Kim J. M.., Shin G. H.., Jung T. D.., Oh J. W.., Choi S. H.., Cho B. Y.., Lee J. H.., Lee O. H.FASEB J. 2016. 30:1174–1175.
(39). Martinez-Valverde I.., Perago M. J.., Provan G.., Chesson A. J.Sci. Food Agr. 2002. 82:323–330.
(40). Duthie G. G.., Duthie S. J.., Kyle J. A.Nut. Res. Rev. 2000. 13:79–106.
(41). Halder S.., Bharal N.., Mediratta P. K.., Kaur I.., Sharma K. K.Indian. J. Exp. Biol. 2009. 47:577–583.
(43). Chatha S. A. S.., Hussain A. I.., Asad R.., Majeed M.., Aslam N. J.Food Process Technol. 2014. 5:298.
(44). Bachaya H. A.., Iqbal Z.., Khan M. N.., Jabbar A.., Gilani A. H.., Din I. U.Int. J. Agric. Biol. 2009. 11:273–278.
(45). Sultana B.., Anwar F.., Przybylski R.Food Chem. 2007. 104:1106–1114.
(46). Manna P.., Sinha M.., Sil P. C.Arch. Toxicol. 2008. 82:137–149.
(47). Elsherbiny N. M.., Eladl M. A.., Al-Gayyar M. M. H.Cytokine. 2016. 77:26–34.
(48). Sumitra M.., Manikandan P.., Kumar D. A.., Arutselvan N.., Balakrishna K.., Manohar B. M.., Puvanakrishnan R.Mol. Cell. Biochem. 2001. 224:135–142.

(49). Sun F. Y.., Chen X. P.., Wang J. H.., Qin H. L.., Yang S. R.., Du G. H.Am. J. Chin. Med. 2008. 36:197–207.
(50). Pharmacopoeia of India. Herbs and Herbal Monographs: Indian Pharmacopoeial Commission; Ministry of Health and Family Welfare: India,. 2010. 8–9.
(51). Bondet V.., Brand-Williams W.., Berset C.LWT-Food Sci. Tech. 1997. 30:609–615.
(52). Novilla A.., Nawawi A.., Sugihartina G.., Widowati W.Cukurova Med. J. 2014. 39:224–233.
Fig. 1.
Response Surface Plots and Contour plots for the effect of different parameters on percentage yield of arjunic acid in Terminalia arjuna stem bark extracts.
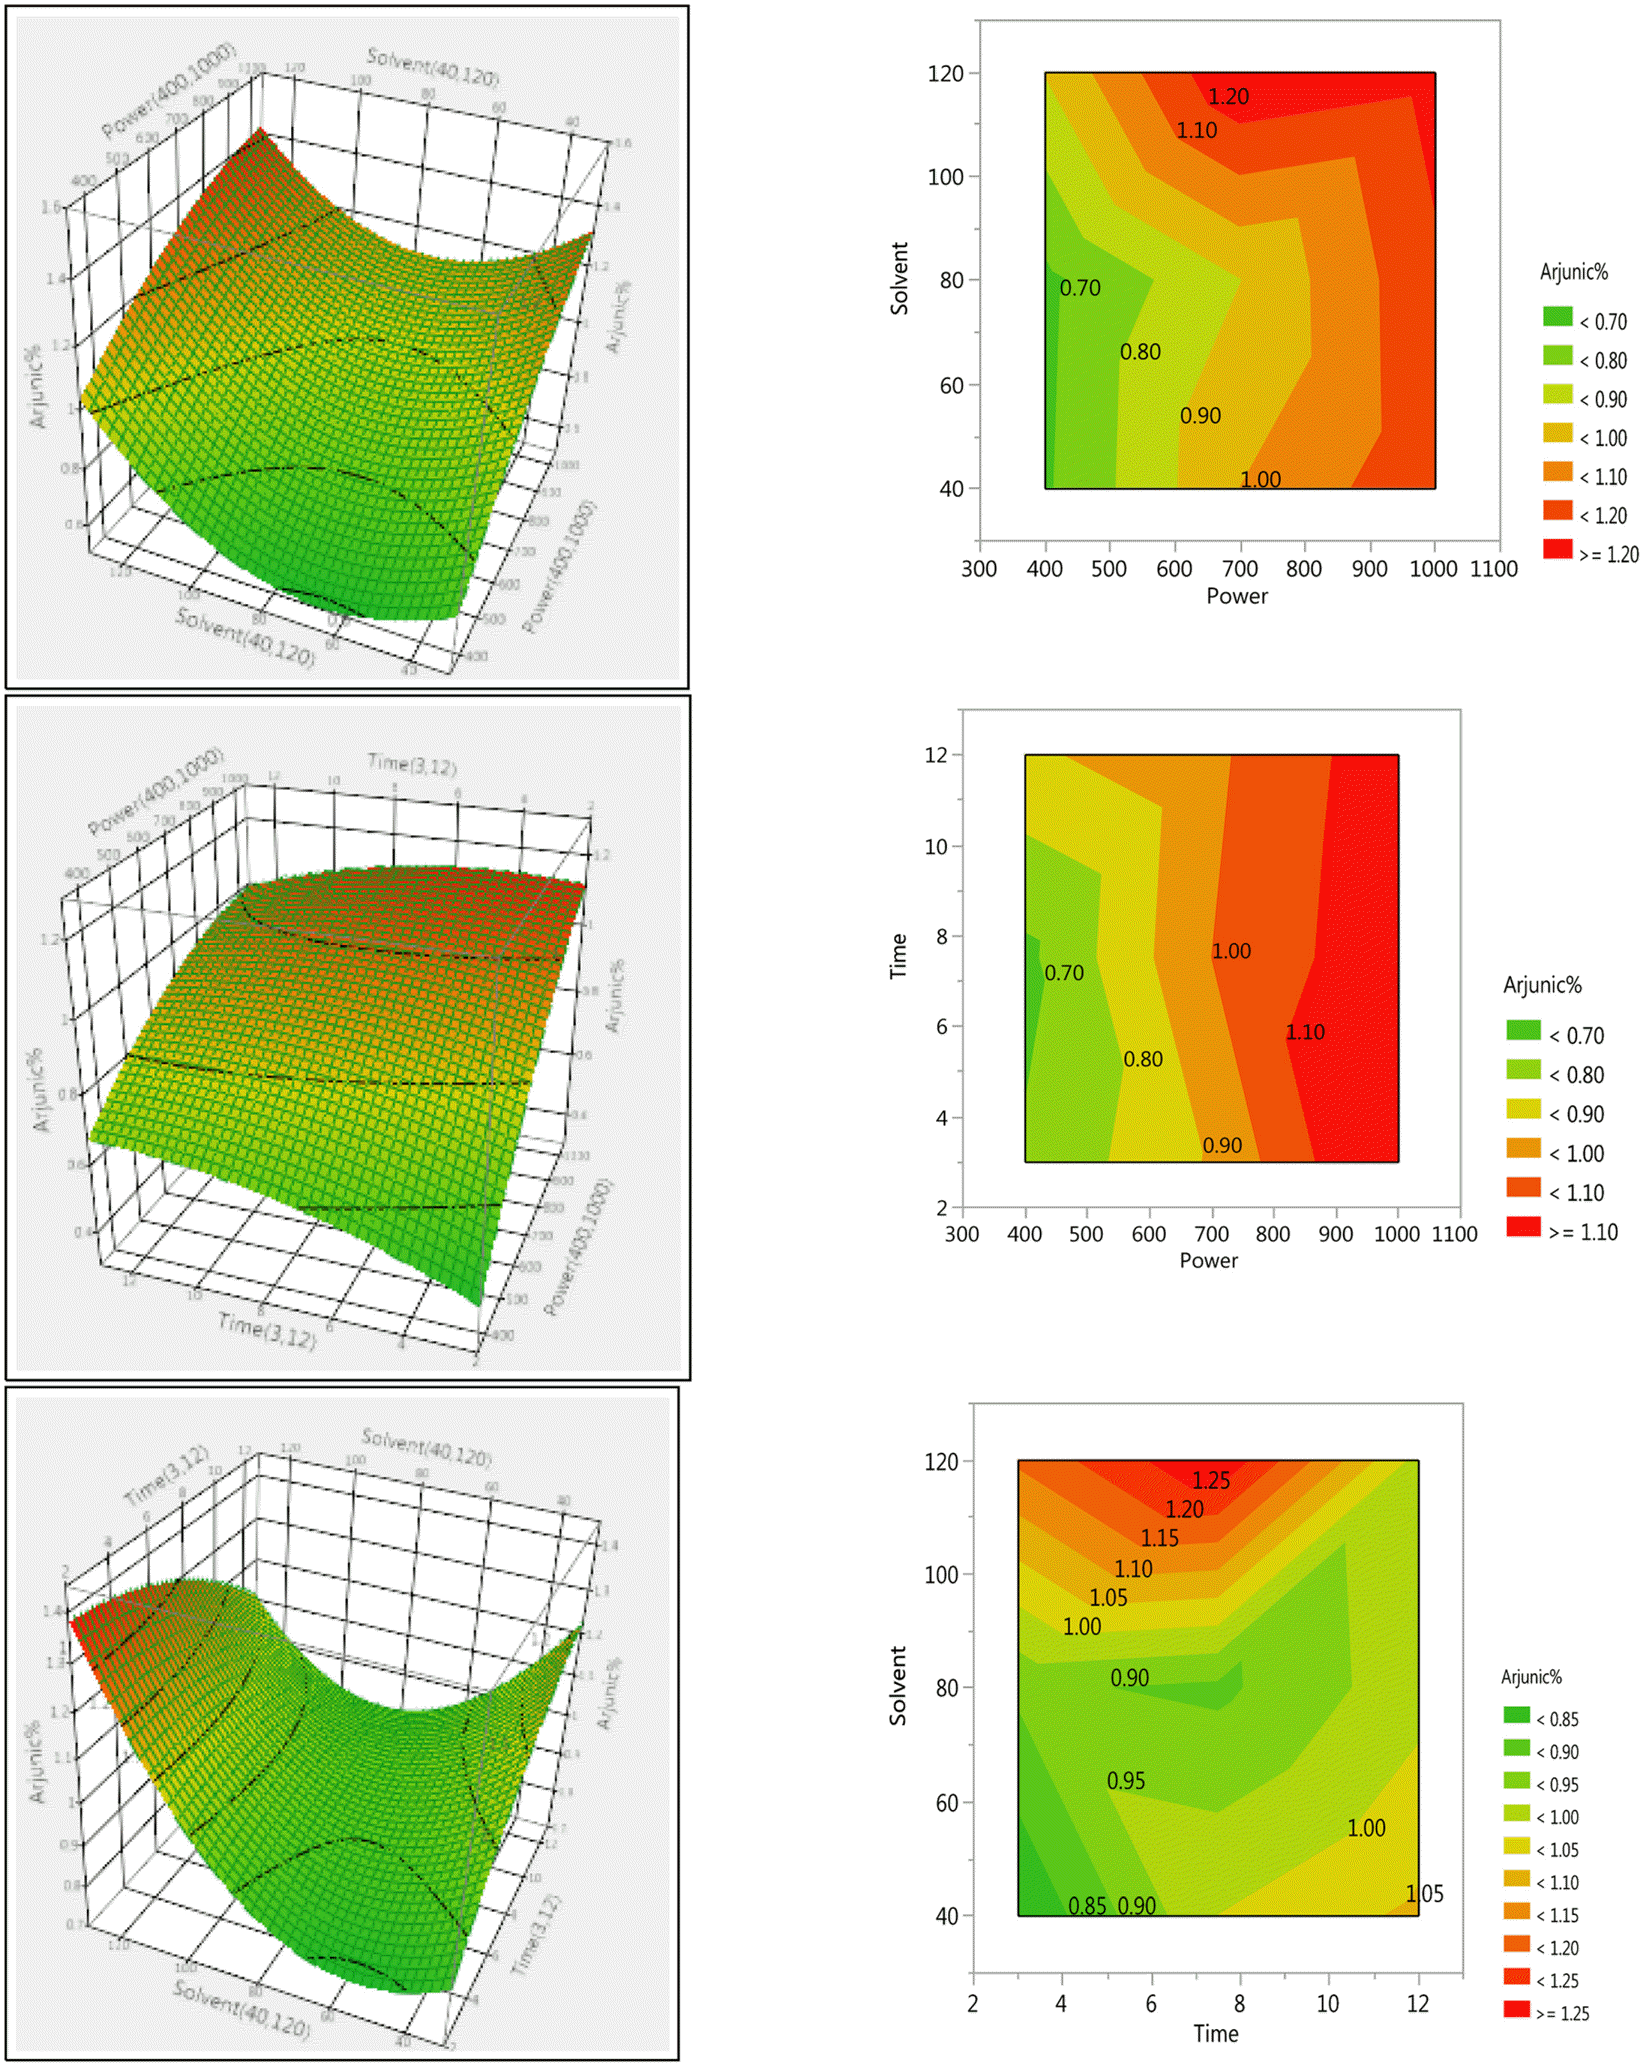
Fig. 2.
Response Surface Plots and Contour plots for the effect of selected parameters on percentage yield of arjunolic acid in Terminalia arjuna stem bark extracts.
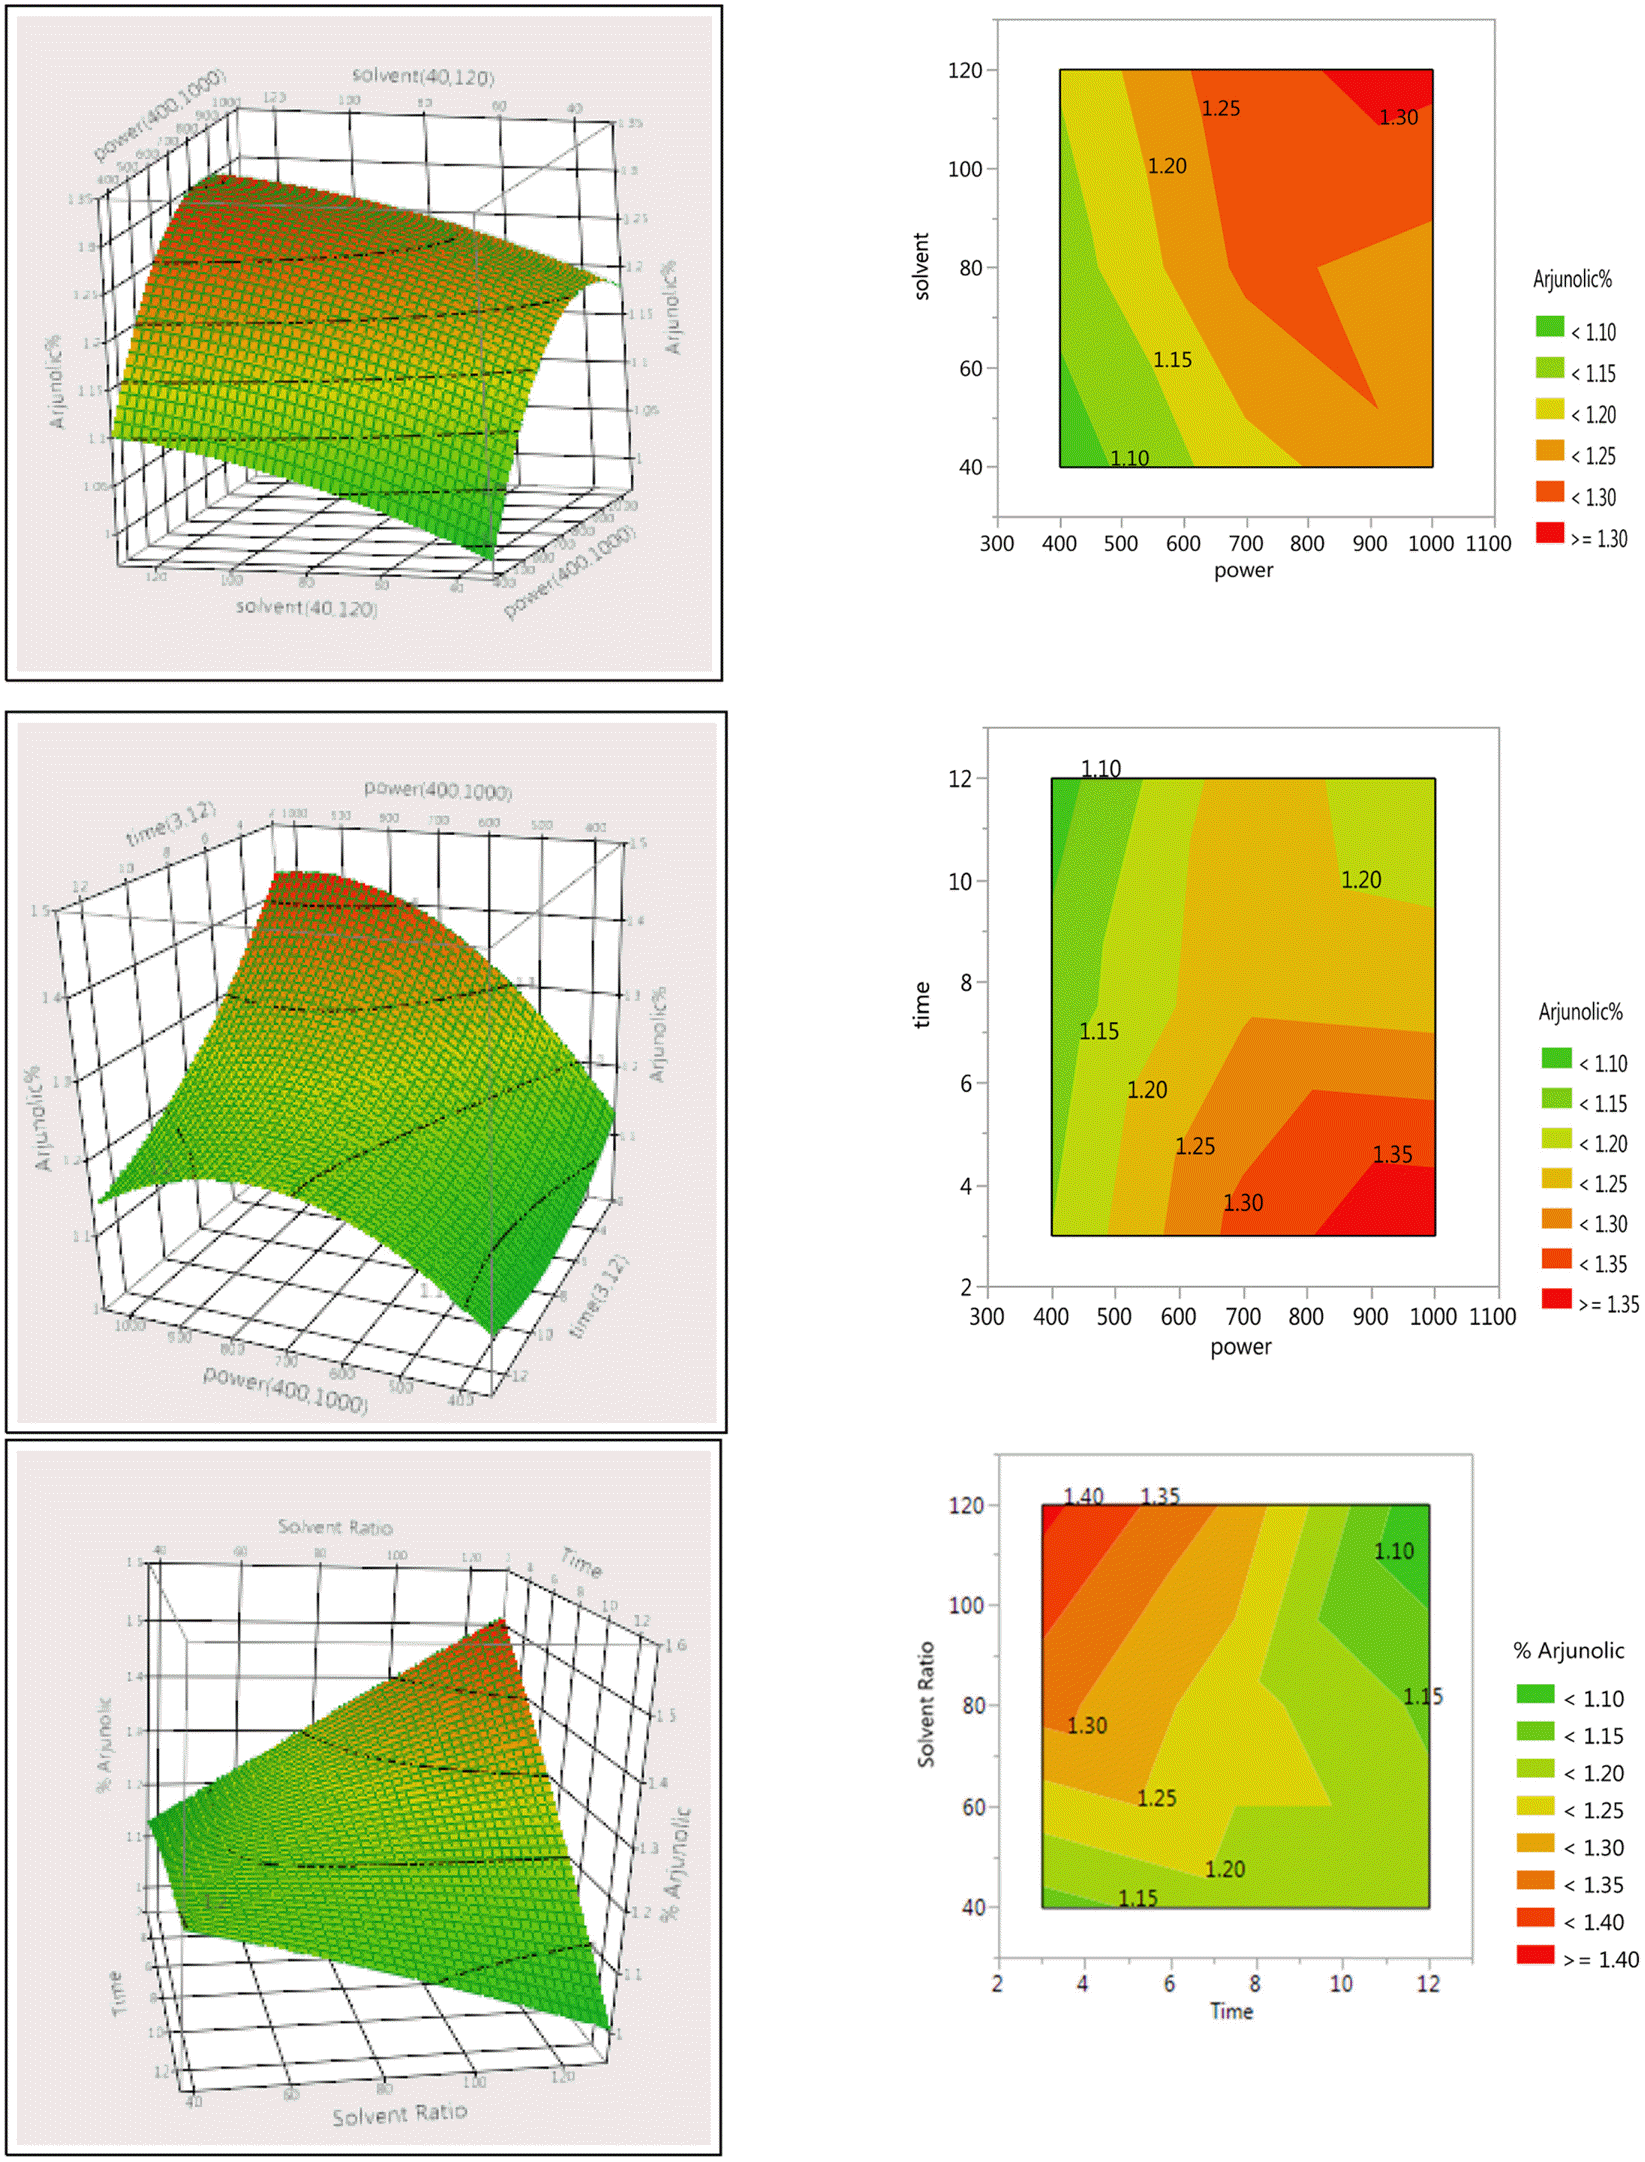
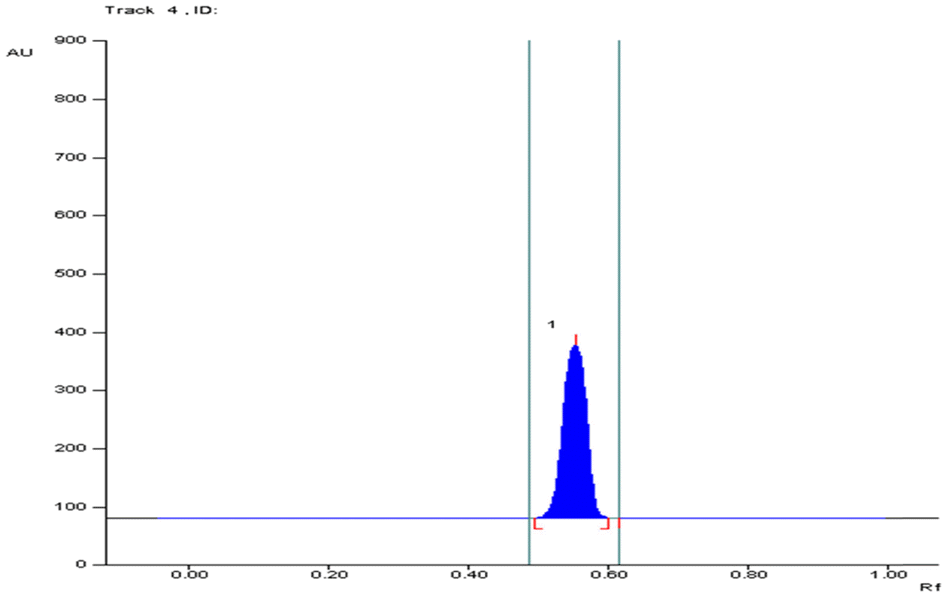
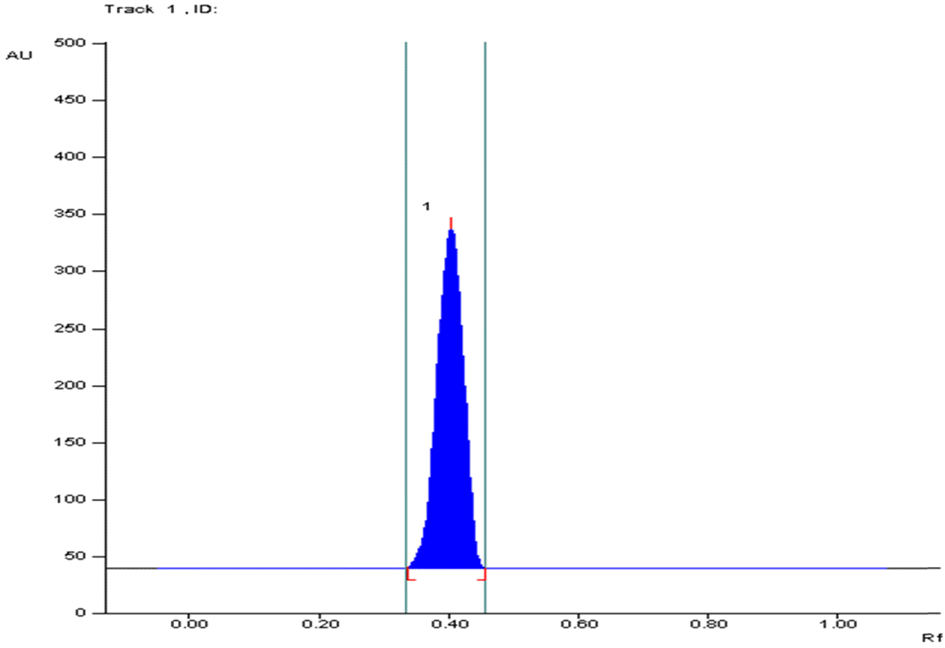
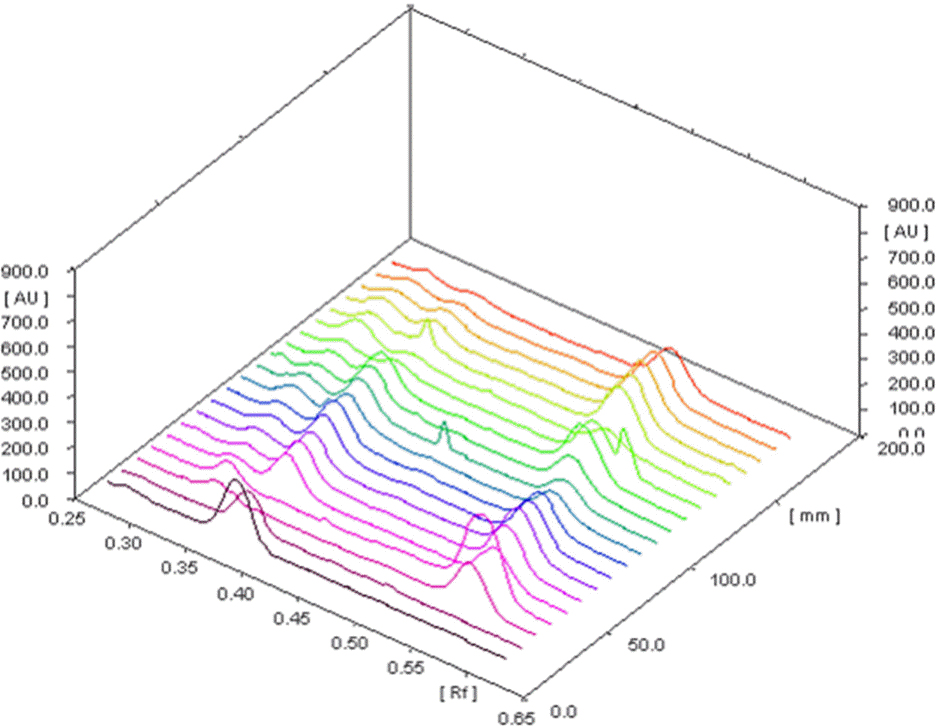
Fig. 5.
HPTLC chromatogram for different concentrations of standard arjunic acid and arjunolic acid at 366 nm.
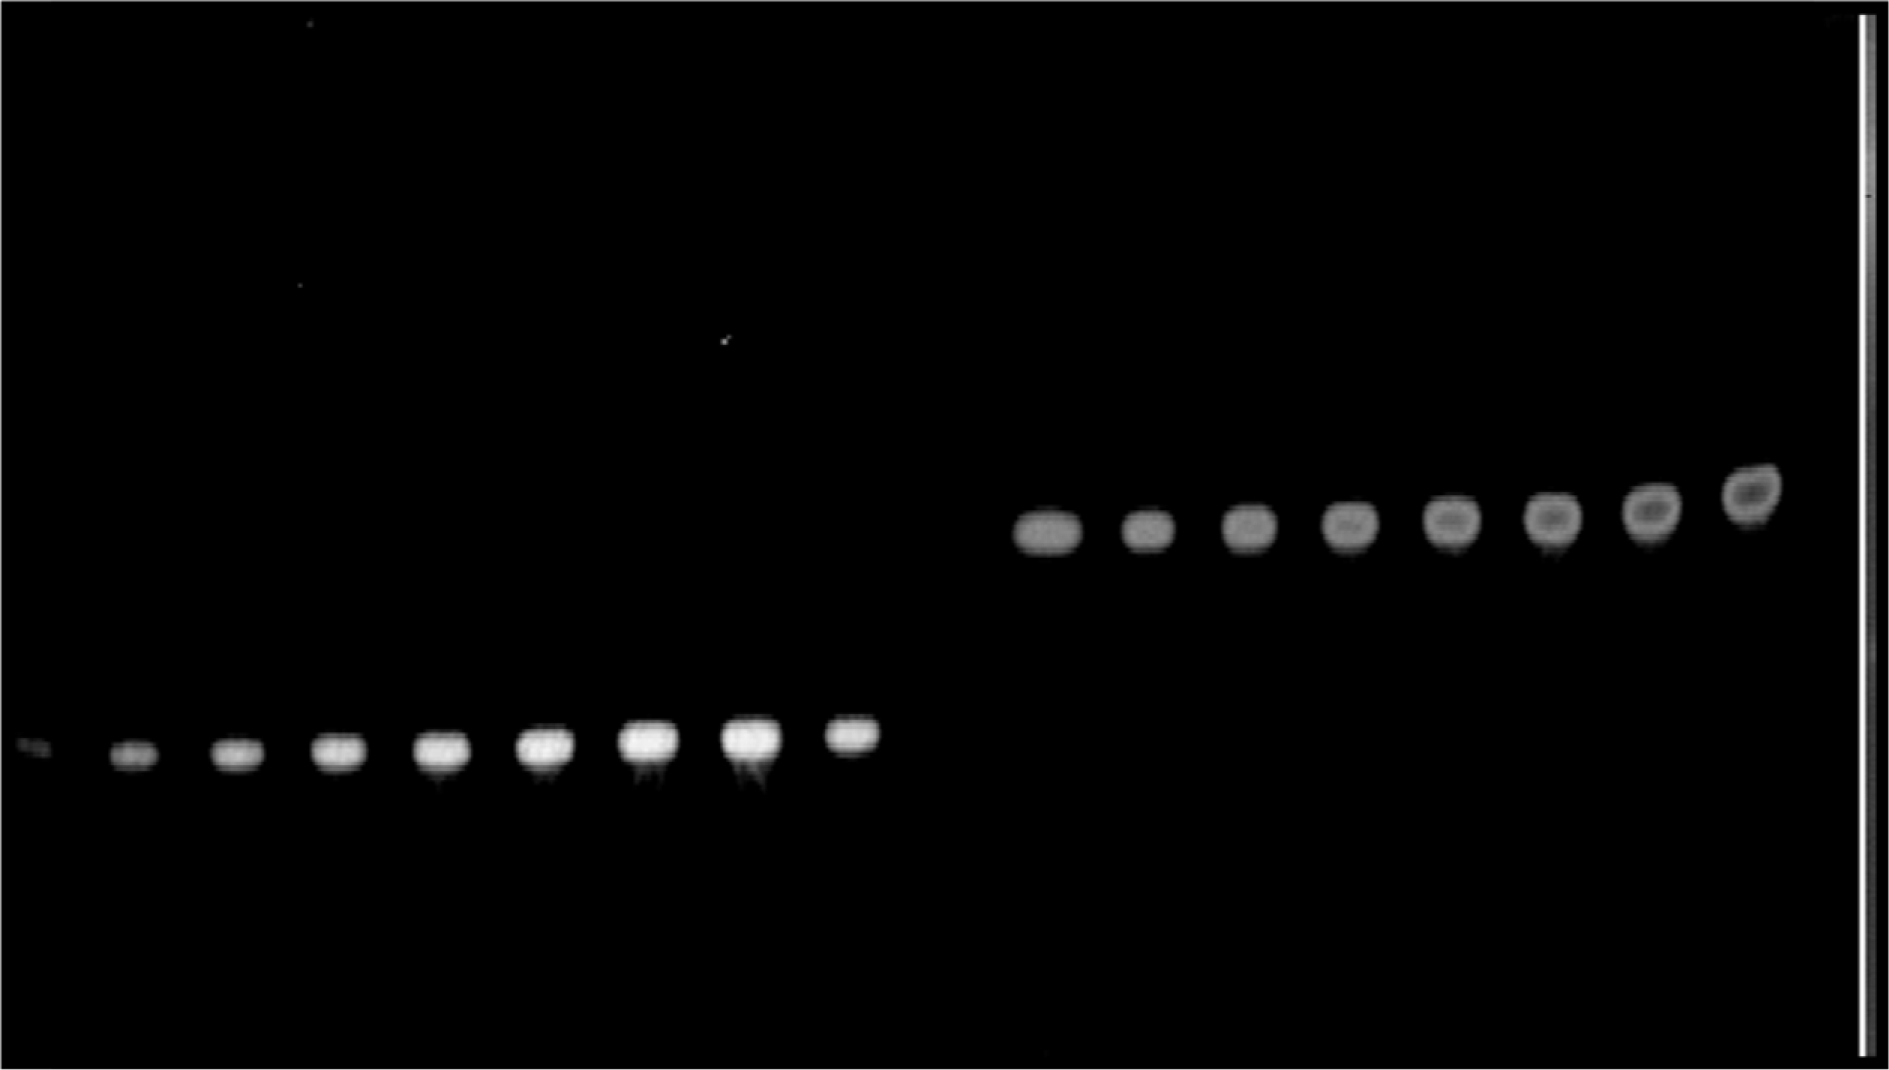
Fig. 6.
Area under the peak diagram of different concentrations of standard arjunolic acid and arjunic acid.
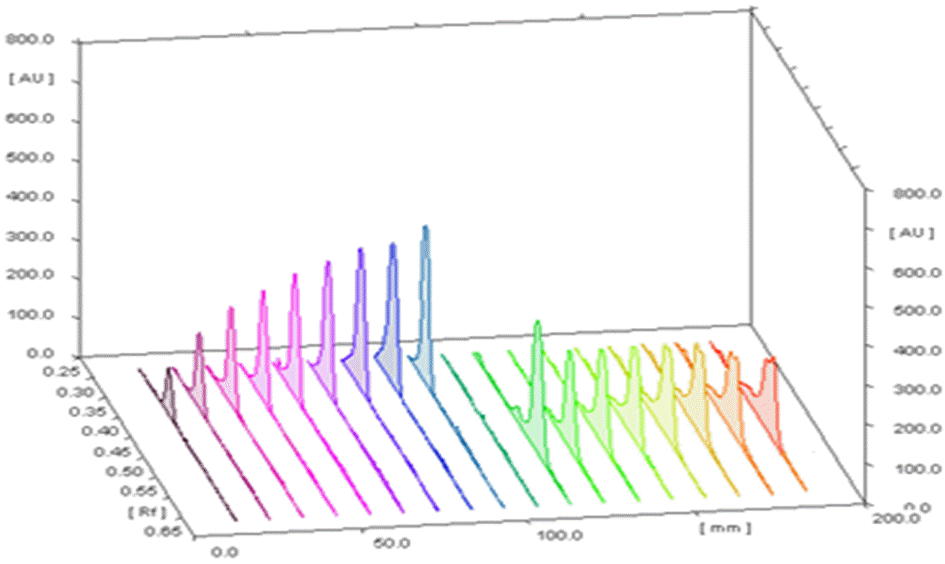
Table 1.
Factors and levels for central composite design
| Level | Power, W | Time, min | Solid/solvent ratio |
|---|---|---|---|
| –1 | 400 | 53 | 40 |
| 0 | 700 | 57.5 | 80 |
| 1 | 1000 | 12 | 120 |
Table 2.
Assigned parameters for microwave assisted extraction in central composite design
Table 3.
Percentage yield of marker compounds arjunic acid and arjunolic acid, the IC50 value of different batches using DPPH method


 PDF
PDF ePub
ePub Citation
 Print
Print


 XML Download