Abstract
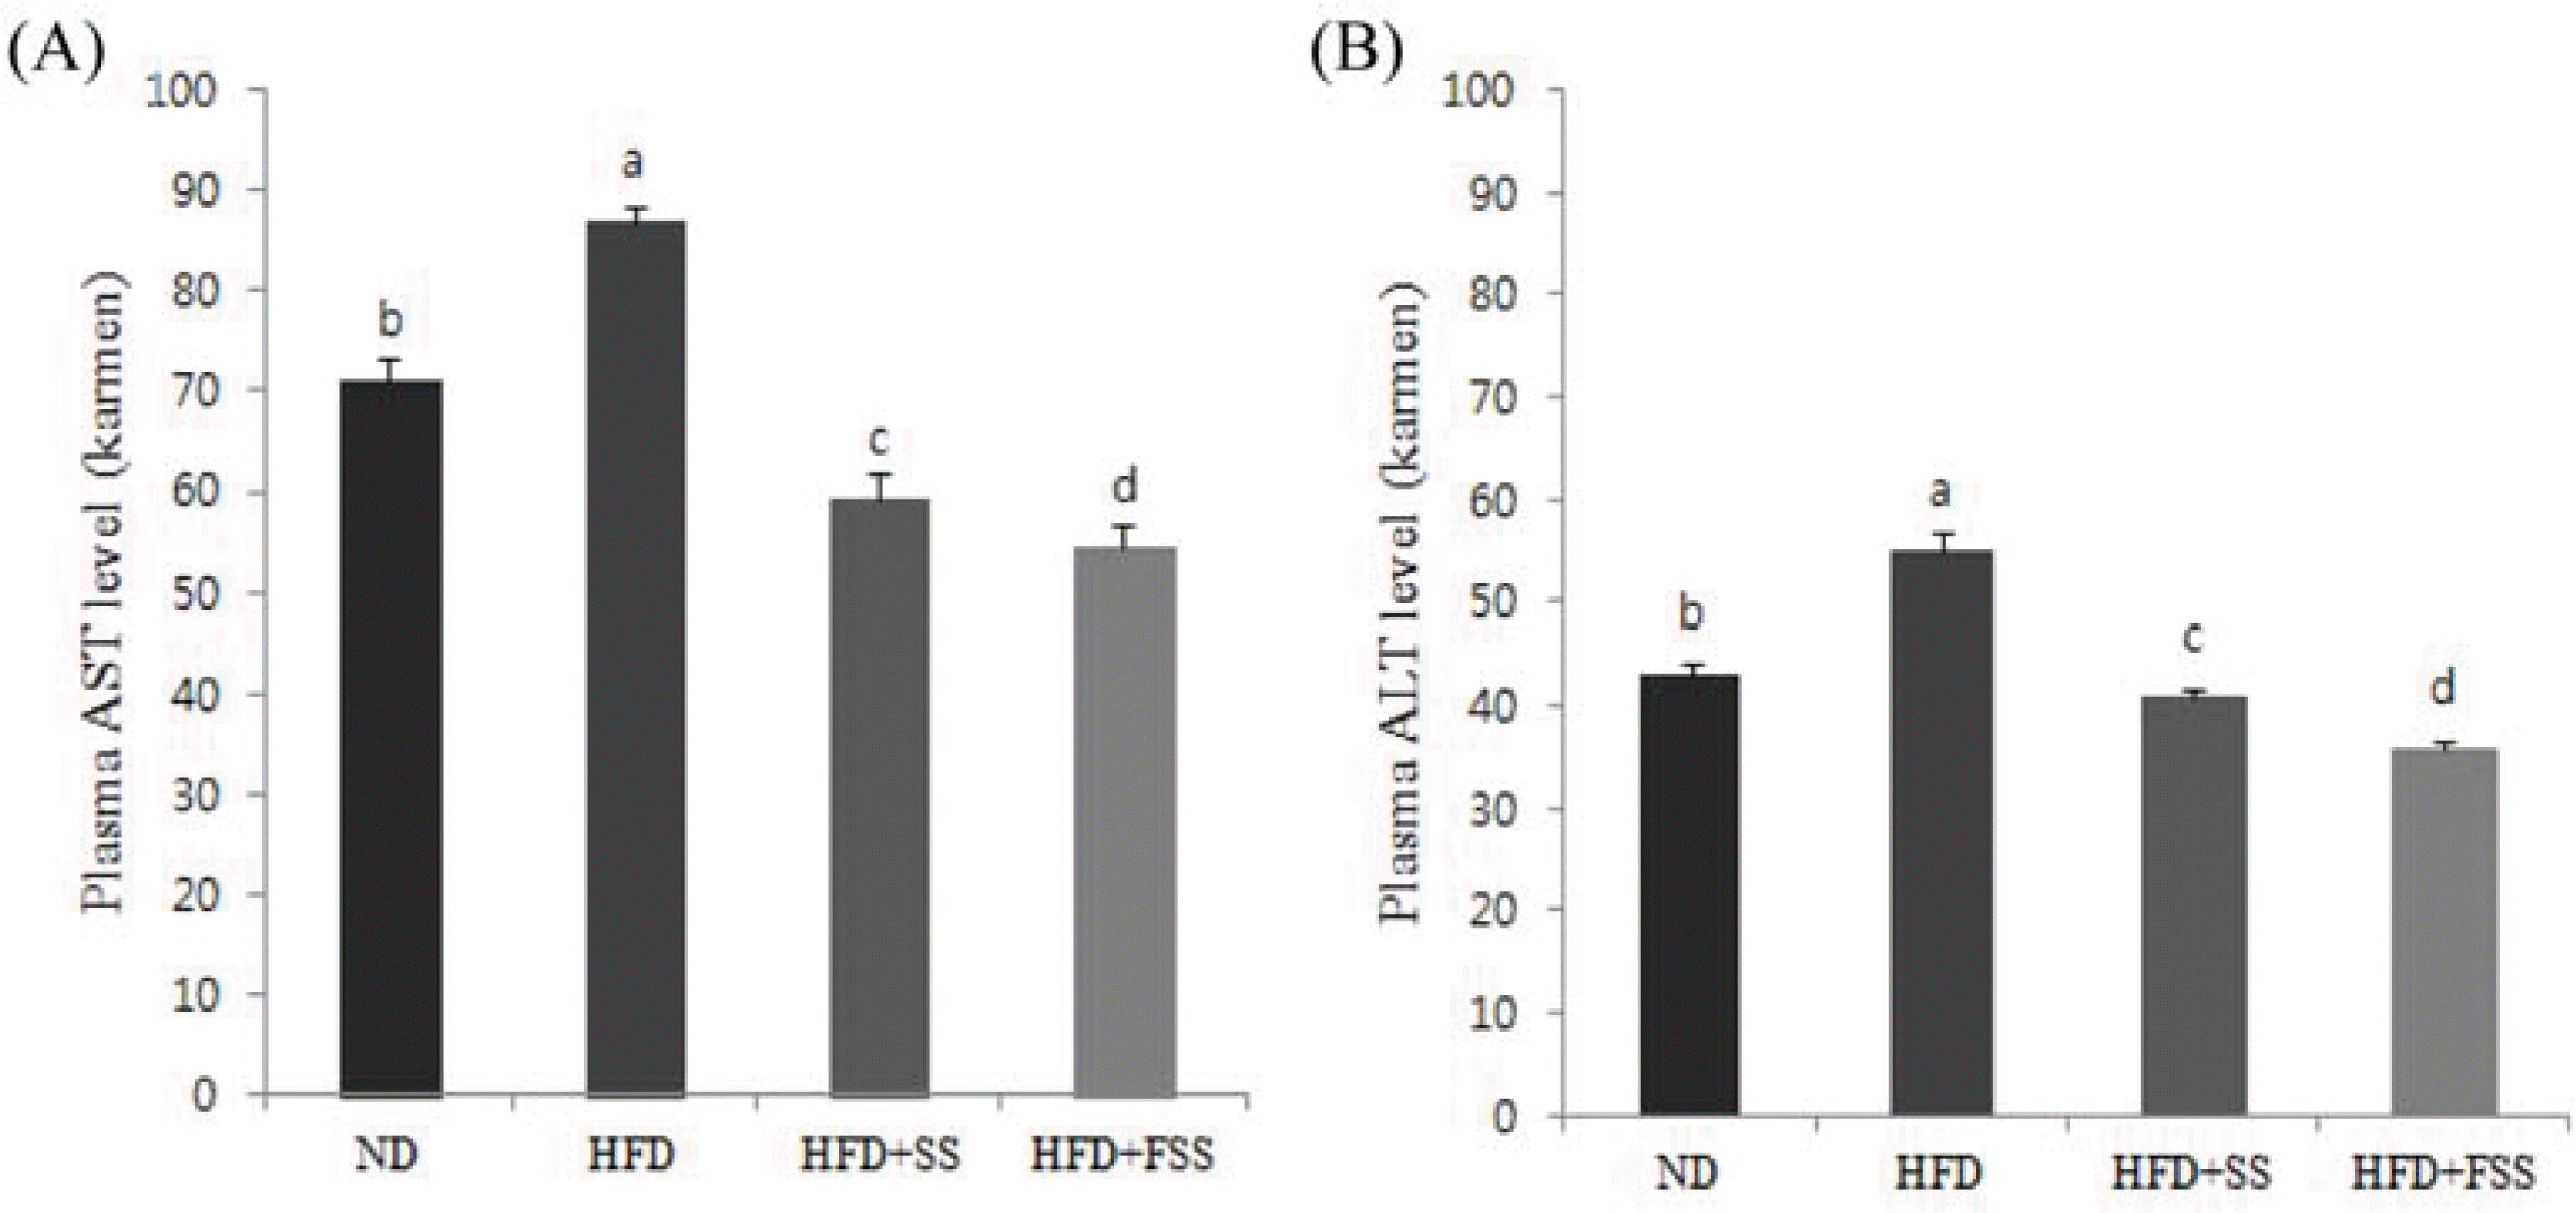
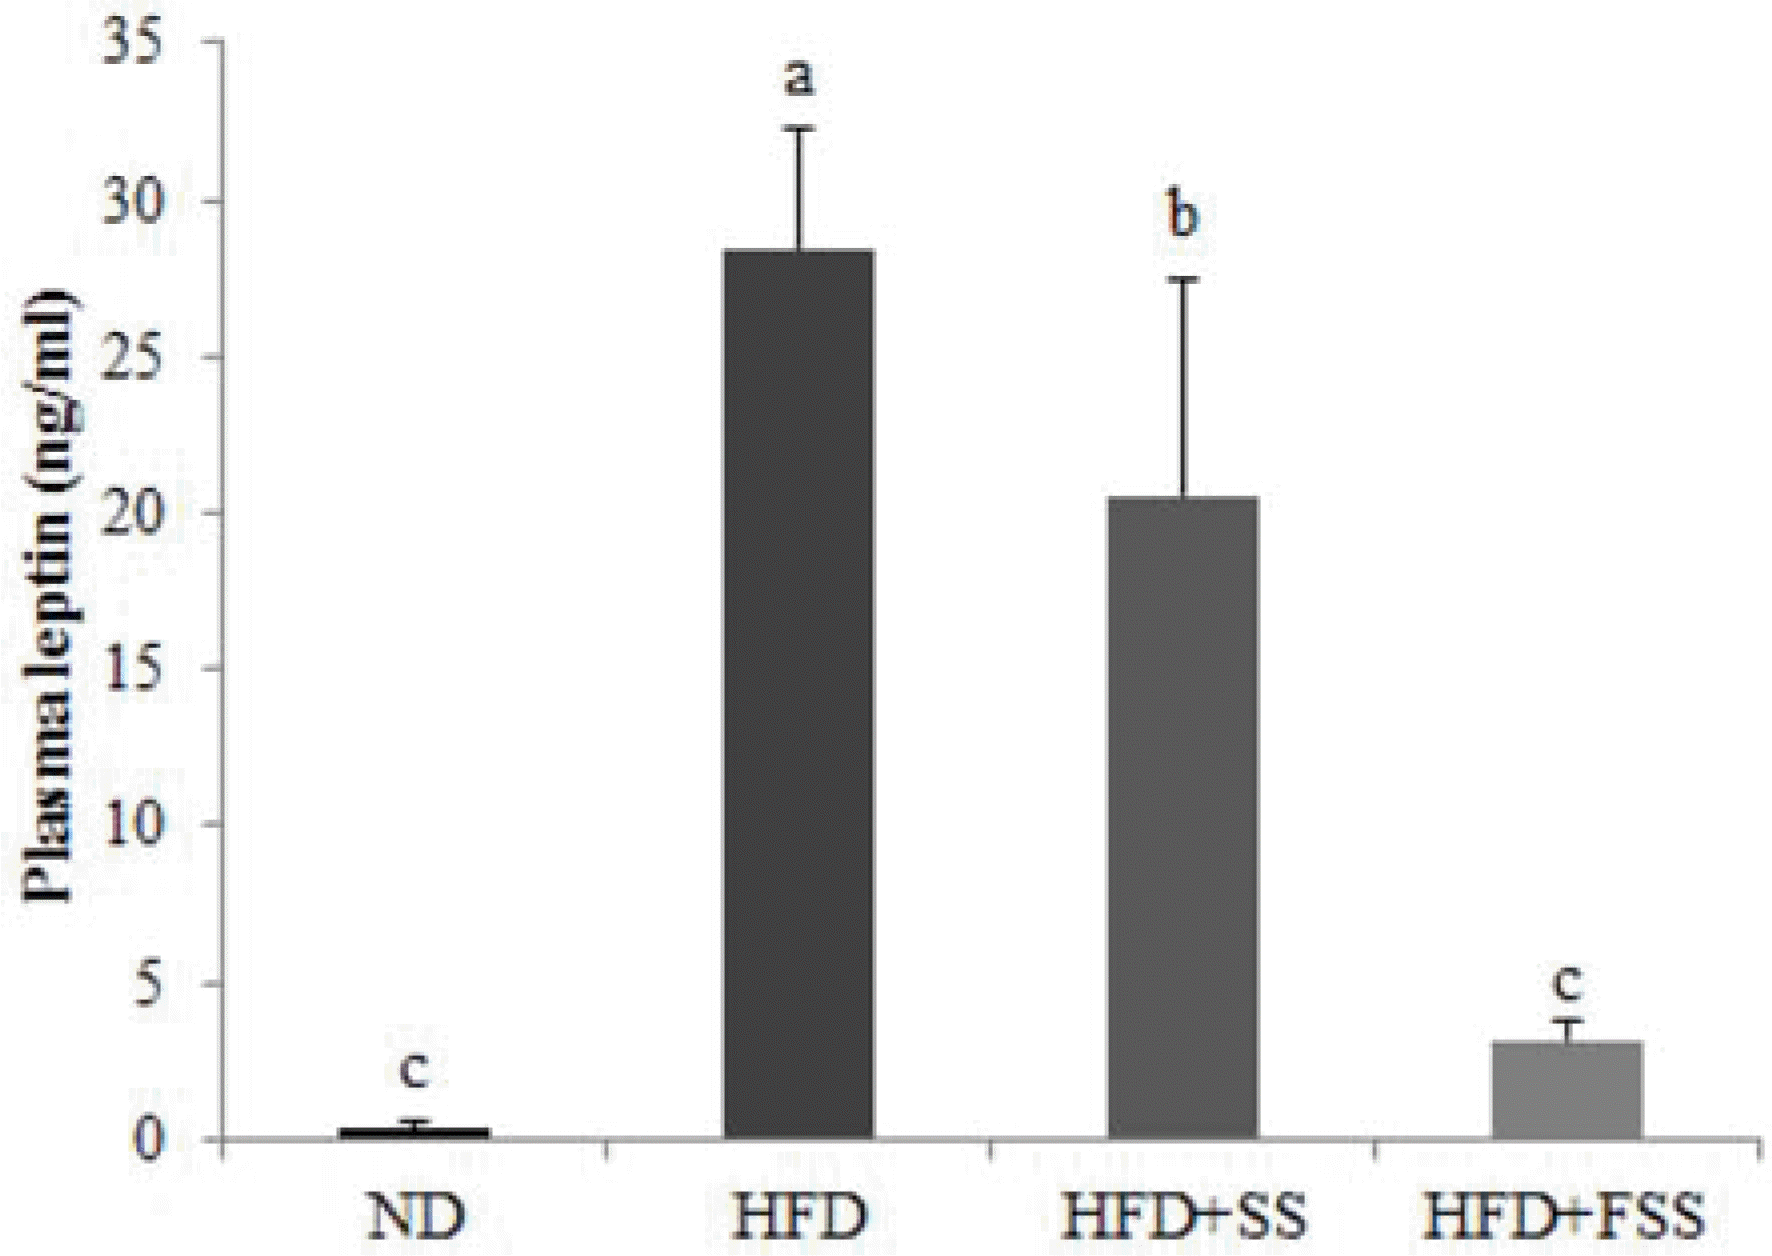
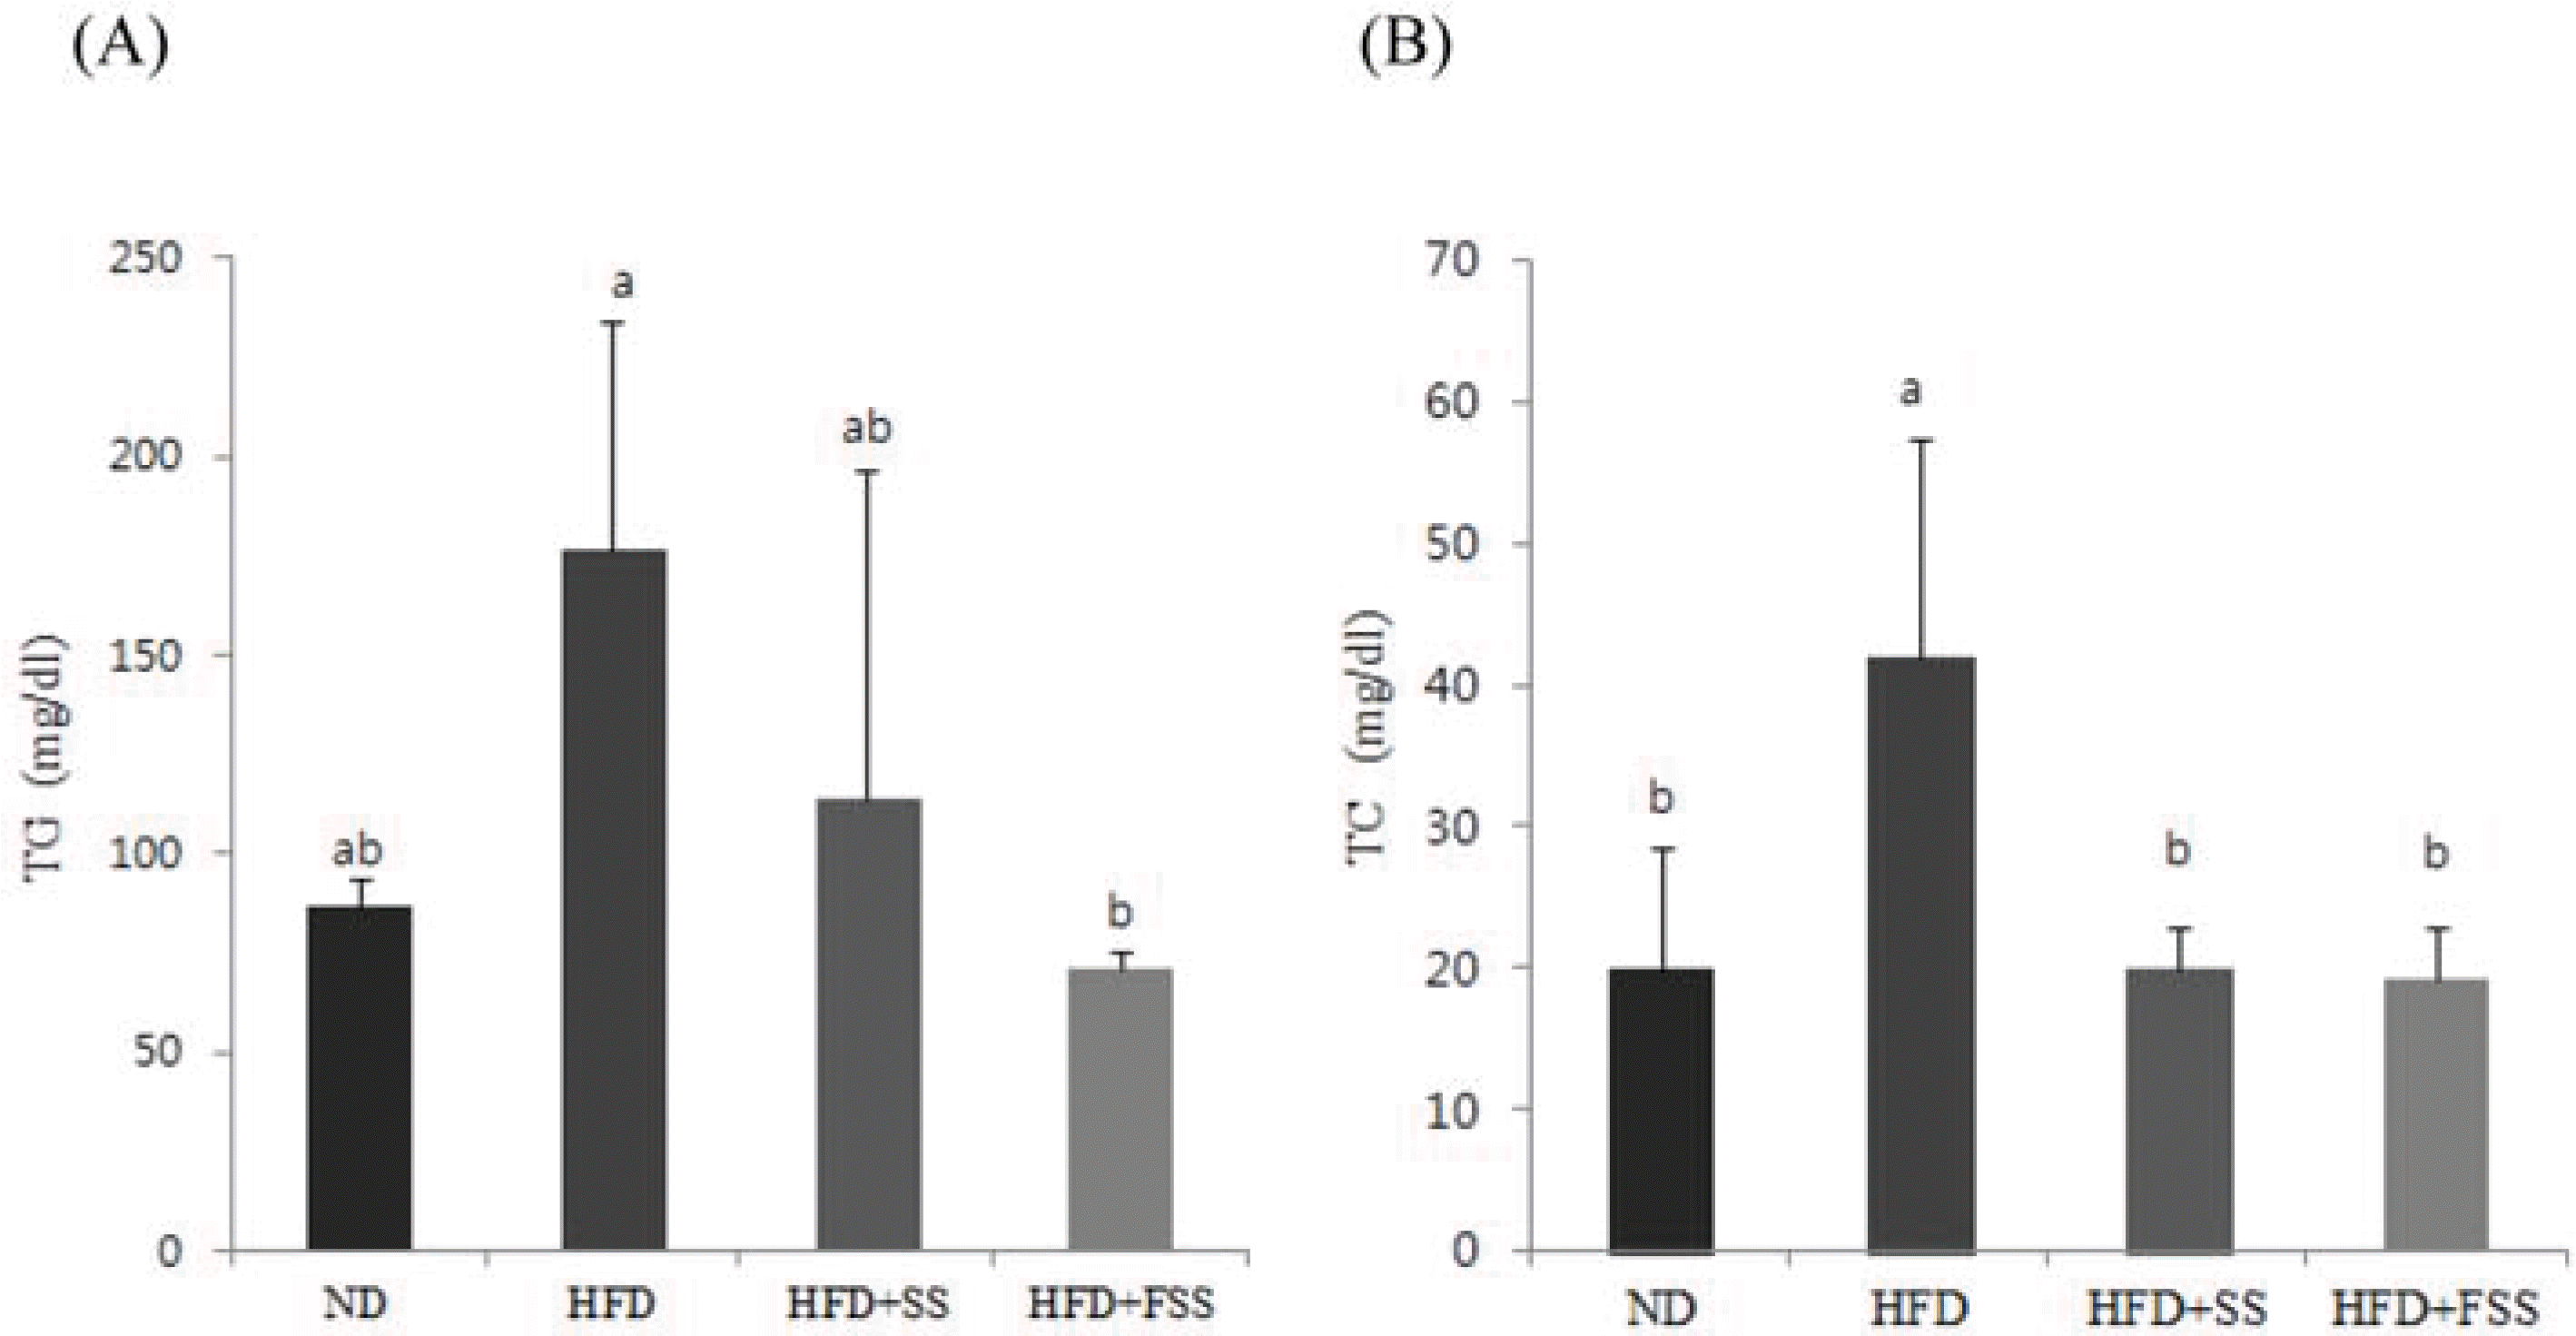
This study was performed to investigate the ameliorating effects of steamed soybeans (SS) and fermented SS (FSS) on lipid metabolism in high-fat diet-induced obese mice. ICR mice were divided into four groups and given the following different diets: normal diet (ND), high-fat diet (HFD), HFD with 1% SS (HFD + SS), and HFD with 1% FSS (HFD + FSS). After 14 weeks, the body weight gain was higher in the HFD group compared with the ND group but lower in the HFD + FSS group compared with the HFD group. Plasma levels of triglyceride (TG), total cholesterol (TC), low density lipoprotein-cholesterol, aspartate aminotransferase (AST), and alanine aminotransferase (ALT) were significantly higher in the HFD group compared to the ND group, but lower in the HFD + SS and HFD + FSS groups compared with the HFD group. In addition, leptin concentration in plasma was lower in the groups fed HFD + SS and HFD + FSS compared with the HFD group. The accumulation of hepatic TG and TC was significantly inhibited in the HFD + SS and HFD + FSS groups. Furthermore, SS and FSS attenuated lipid peroxidation and nitric oxide formation in the liver induced by the high-fat diet. These results suggest that soybeans, especially FSS, may be useful in preventing obesity-induced abnormalities in lipid metabolism.
Go to : 
References
(1). Bae C. R.., Kwon D. Y.., Cha Y. S. J.Clin. Biochem. Nutr. 2014. 54:45–50.
(2). de Almeida M. M.., de Souza Y. O.., Dutra Luquetti S. C.., Sabarense C. M.., do Amaral Corrêa J. O.., da Conceição E. P.., Lisboa P. C.., de Moura E. G.., Andrade Soares S. M.., Moura Gualberto A. C.., Gameiro J.., da Gama M. A.., Ferraz Lopes F. C.., González Garcia R. M. J.Oleo. Sci. 2015. 64:539–551.
(3). Larsson B.., Björntorp P.., Tibblin G.Int. J. Obes. 1981. 5:97–116.
(4). Amo K.., Arai H.., Uebanso T.., Fukaya M.., Koganei M.., Sasaki H.., Yamamoto H.., Taketani Y.., Takeda E. J.Clin. Biochem. Nutr. 2011. 49:1–7.
(5). Reaven G. M.Curr. Atheroscler. Rep. 2000. 2:503–507.
(6). Lei F.., Zhang X. N.., Wang W.., Xing D. M.., Xie W. D.., Su H.., Du L. J.Int. J. Obes. 2007. 31:1023–1029.
(7). Ikeuchi M.., Koyama T.., Takahashi J.., Yazawa K.Biosci. Biotechnol. Biochem. 2007. 71:893–899.
(8). Lee Y. S.., Choi B. K.., Lee H. J.., Lee D. R.., Cheng J.., Lee W. K.., Yang S. H.., Suh J. W.AsianPac. J. Trop. Med. 2015. 8:276–282.
(9). Mateos-Aparicio I.., Redondo-Cuenca A.., Villanueva-Suárez M. J.., Zapata-Revilla M. A.Nutr. Hosp. 2008. 23:305–312.
(10). Liu K. S.In Soybeans: Chemistry, Technology and Utilization; Chapman and Hall, New York,. 1997. 442–447.
(11). Craig W. J. J.Am. Diet. Assoc. 1997. 97:S199–S204.
(12). Kwon D. Y.., Daily J. W. 3rd.., Kim H. J.., Park S.Nutr. Res. 2010. 30:1–13.
(13). Cha Y. S.., Kim S. R.., Yang J. A.., Back H. I.., Kim M. G.., Jung S. J.., Song W. O.., Chae S. W.Nutr. Metab. 2013. 10:24.
(14). Yoo K. M.Korean J. Food Nutr. 2011. 24:451–457.
(15). Choi M.., Cho K.., Nam S. J.Korean Soc. Food Sci. Nutr. 2014. 43:243–249.
(16). Folch J.., Lees M.., Stanley Stanley G. H. J.Biol. Chem. 1957. 226:497–509.
(17). Uchiyama M.., Mihara M.Anal. Biochem. 1978. 86:271–278.
(18). Sun J.., Zhang X.., Broderick M.., Fein H.Sensors. 2003. 3:276–284.
(20). Bondia-Pons I.., Ryan L.., Martinez J. A. J.Physiol. Biochem. 2012. 4:701–711.
(21). Hill J. O.., Catenacci V.., Wyatt H. R.Psychiatr. Clin. North Am. 2005. 28:1–23.
(22). American Medical Association 2013. American Medical Association: AMA adopt new policies on second day of voting at Annual Meeting (obesity as a disease); Marketwired:. 2013.
(23). Kim B.., Lee B. W.., Hwang C. E.., Lee Y. Y.., Lee C.., Kim B. J.., Park J. Y.., Sim E. Y.., Haque M. A.., Lee D. H.., Lee J. H.., Ahn, M J.., Lee H. Y.., Ko J. M.., Kim H. T.., Cho K. M.Kor. J. Microbiol. 2015. 51:231–240.
(24). Abete N.American Journal of Medicine. 1999. 107:125–135.
(25). Rader D. J.., Hovingh G. K.Lancet. 2014. 384:618–625.
(26). Siebel A. L.., Heywood S. E.., Kingwell B. A.Front. Pharmacol. 2015. 6:258.
(27). Kahn B. B.., Flier J. S. J.Clin. Invest. 2000. 106:473–481.
(28). Lin S.., Thomas T. C.., Storlien L. H.., Huang X. F.Int. J. Obes. Relat. Metab. Disord. 2000. 24:639–646.
(29). Cano P. G.., Santacruz A.., Trejo F. M.., Sanz Y.Obesity. 2013. 21:2310–2321.
(30). Xu Y.., Zhang M.., Wu T.., Dai S.., Xu J.., Zhou Z.Food Funct. 2015. 6:297–304.
(31). Unger R. H.., Zhou Y. T.., Orci L. Proc. Natl. Acad. Sci. U. S.A. 1999. 96:2327–2332.
(33). Cohen B.., Novick D.., Rubinstein M.Science. 1996. 274:1185–1188.
(34). Chitturi S.., Farrell G.., Frost L.., Kriketos A.., Lin R.., Fung C.., Liddle C.., Samarasinghe D.., George J.Hepatology. 2002. 36:403–409.
(35). Sallie R.., Tredger J. M.., William R.Biopharm. Drug Dispos. 1991. 12:251–259.
(36). Yu X. X.., Murray S. F.., Pandey S. K.., Booten S. L.., Bao D.., Song X. Z.., Kelly S.., Chen S.., McKay R.., Monia B. P.., Bhanot S.Hepatology. 2005. 42:362–371.
(37). Fernández-Sánchez A.., Madrigal-Santillán E.., Bautista M.., Esquivel-Soto J.., Morales-González Á.., Esquivel-Chirino C.., Durante-Montiel I.., Sánchez-Rivera G.., Valadez-Vega C.., Morales-González J. A.Int. J. Mol. Sci. 2011. 12:3117–3132.
(38). Furukawa S.., Fujita T.., Shimabukuro M.., Iwaki M.., Yamada Y.., Nakajima Y.., Makishima M.., Matsuda M.., Shimomura I. J.Clin. Invest. 2004. 114:1752–1761.
(39). Milagro F. I.., Campión J.., Martínez J. A.Obesity. 2006. 14:1118–1123.
(40). Oliveira C. P.., Coelho A. M.., Barbeiro H. V.., Lima V. M.., Soriano F.., Ribeiro C.., Molan N. A.., Alves V. A.., Souza H. P.., Machado M. C.., Carrilho F. J.Braz. J. Med. Biol. Res. 2006. 39:189–194.
(41). Vincent H. K.., Taylor A. G.Int. J. Obes. 2006. 30:400–418.
(42). Katsube T.., Tamasaki M.., Shiwaku K.., Ishijima T.., Matsumoto I.., Abe K.., Yamasaki Y. J.Sci. Food Agric. 2010. 90:2386–2392.
(43). Jung C. H.., Cho I.., Ahn J.., Jeon T. I.., Ha T. Y.Phytother. Res. 2013. 27:139–143.
(44). Rege S. D.., Kumar S.., Wilson D. N.., Tamura L.., Geetha T.., Mathews S. T.., Huggins K. W.., Broderick T. L.., Babu J. R.Oxid. Med. Cell. Longev. 2013. 2013:1–7.
(45). Ha S. K.., Chae C.Exp. Anim. 2010. 59:595–604.
(46). Suzuki Y.., Kosaka M.., Shindo K.., Kawasumi T.., Kimoto-Nira H.., Suzuki C.Biosci. Biotechnol. Biochem. 2013. 77:1299–1302.
(47). Hwang C. E.., An M. J.., Lee H. Y.., Lee B. W.., Kim H. Y.., Ko J. M.., Baek I. Y.., Seo W. T.., Cho K. M.Korean J. Food Sci. Technol. 2014. 46:556–565.
(48). Izumi T.., Piskula M. K.., Osawa S.., Obata A.., Tobe K.., Saito M.., Kataoka S.., Kikuchi M. J.Nutr. 2000. 130:1695–1699.
(49). Choi I.., Kim Y.., Park Y.., Seog H.., Choi H.Bio Factors. 2007. 29:105–112.
(50). Terpstra A. H.., Javadi M.., Beynen A. C.., Kocsis S.., Lankhorst A. E.., Lemmens A. G.., Mohede I. C. J.Nutr. 2003. 133:3181–3186.
Go to : 
 | Fig. 1.Effects of SS and FSS on AST (A) and ALT (B) levels. Values are mean ± SD (n = 6). a∼dMeans indicated with different letters are significantly different (P < 0.05) by Duncan's multiple range test. ND: normal diet, HFD: high-fat diet, SS: 1% steamed soybean, FSS: 1% steamed soybean fermented for 60 h. |
 | Fig. 2.Effects of SS and FSS on plasma leptin. Values are mean ± SD (n = 6). a∼cMeans indicated with different letters are significantly different (P < 0.05) by Duncan's multiple range test. ND: normal diet, HFD: high-fat diet, SS: 1% steamed soybean, FSS: 1% steamed soybean fermented for 60 h. |
 | Fig. 3.Effects of SS and FSS on hepatic TG (A) and TC (B). Values are mean ± SD (n = 6). a∼bMeans indicated with different letters are significantly different (P < 0.05) by Duncan's multiple range test. ND: normal diet, HFD: high-fat diet, SS: 1% steamed soybean, FSS: 1% steamed soybean fermented for 60 h. |
Table 1.
Diet composition (g/100 g)
| Group | ND | HFD | HFD + SS | HFD + FSS |
|---|---|---|---|---|
| NIH#31M rodent diet1) | 85 | 68 | 68 | 68 |
| Lard | 0 | 20 | 20 | 20 |
| Corn starch | 15 | 12 | 11 | 11 |
| SS powder | 0 | 0 | 1 | 0 |
| FSS powder | 0 | 0 | 0 | 1 |
| Total | 100 | 100 | 100 | 100 |
Table 2.
Changes in body weight gain and food intake for 14 weeks
| Group | ND | HFD | HFD + SS | HFD + FSS |
|---|---|---|---|---|
| Initial body weight (g) | 33.19 ± 1.71a | 34.40 ± 1.55a | 33.70 ± 1.54a | 33.50 ± 2.25a |
| Final body weight (g) | 41.20 ± 2.22b | 54.12 ± 8.09a | 44.27 ± 5.86a | 43.48 ± 2.80b |
| Gained body weight (g) | 556.6 ± 1.3b | 518.8 ± 8.2a | 518.6 ± 6.2a | 510.2 ± 3.2b |
| Food intake (g/day) | 55.05 ± 1.51a | 54.76 ± 1.20a | 54.64 ± 1.65a | 55.08 ± 1.21a |
| FER1) | 51.57 ± 0.30b | 54.76 ± 2.07a | 54.83 ± 1.61a | 52.42 ± 0.76b |
Table 3.
Changes in organ weight of mice fed a high-fat diet for 14 weeks
| Group | ND | HFD | HFD + SS | HFD + FSS |
|---|---|---|---|---|
| Liver weight (g) | 2.82 ± 0.24b | 3.55 ± 1.23a | 2.69 ± 0.58b | 2.40 ± 0.48c |
| Kidney weight (g) | 0.74 ± 0.05a | 0.69 ± 0.08a | 0.67 ± 0.10a | 0.73 ± 0.11a |
| Left brain (g) | 0.26 ± 0.01a | 0.24 ± 0.01a | 0.23 ± 0.02a | 0.24 ± 0.03a |
| Right brain (g) | 0.26 ± 0.02a | 0.25 ± 0.02a | 0.27 ± 0.02a | 0.24 ± 0.02a |
| Small intestine weight (g) | 2.08 ± 0.32a | 1.73 ± 0.52a | 1.64 ± 0.40a | 1.67 ± 0.43a |
| Large intestine weight (g) | 1.12 ± 0.21a | 0.99 ± 0.25a | 0.90 ± 0.09a | 0.86 ± 0.29a |
Table 4.
Effect of SS and FSS on the plasma lipid profiles and plasma glucose levels
| Group | ND | HFD | HFD + SS | HFD + FSS |
|---|---|---|---|---|
| Plasma TG (mg/dl) | 128.43 ± 1.77c | 169.79 ± 0.79a | 138.50 ± 1.32b | 128.21 ± 1.74c |
| Plasma TC (mg/dl) | 117.08 ± 1.73c | 156.10 ± 1.33a | 155.11 ± 1.71a | 138.05 ± 2.41b |
| HDL-C (mg/dl) | 574.65 ± 1.59a | 551.26 ± 0.81d | 554.72 ± 0.48c | 557.34 ± 0.35b |
| LDL-C (mg/dl) | 516.74 ± 0.87d | 570.89 ± 1.03b | 572.68 ± 1.32a | 555.06 ± 2.29c |
| HTR1) | 550.64 ± 0.01a | 550.33 ± 0.00d | 550.35 ± 0.00c | 550.42 ± 0.01b |
| AI2) | 550.57 ± 0.02d | 552.05 ± 0.04a | 551.83 ± 0.02b | 551.41 ± 0.04c |
| CRF3) | 551.57 ± 0.02d | 553.05 ± 0.04a | 552.83 ± 0.0.2b | 552.41 ± 0.04c |
| Plasma glucose (mg/dl) | 233.00 ± 18.75a | 285.00 ± 45.41a | 252.75 ± 47.97a | 172.00 ± 27.82b |
Table 5.
Effect of SS and FSS on lipid peroxidation in the liver, brain, and kidney
| Group | MDA (nmole/mg protein) | ||
|---|---|---|---|
| Liver | Brain | Kidney | |
| ND | 537.68 ± 22.97b | 21.71 ± 3.83b | 47.06 ± 16.93a |
| HFD | 163.71 ± 35.28a | 28.75 ± 5.87a | 50.84 ± 9.47a |
| HFD + SS | 142.34 ± 73.05a | 26.80 ± 2.77ab | 53.75 ± 24.96a |
| HFD + FSS | 549.07 ± 16.17b | 28.13 ± 3.05ab | 45.97 ± 9.47a |
Table 6.
Effects of SS and FSS on NO formation in the liver, brain, and kidney
| Group | NaNO2 (µmole/mg protein) | ||
|---|---|---|---|
| Liver | Brain | Kidney | |
| ND | 16.90 ± 9.44b | 50.59 ± 21.68a | 52.24 ± 19.34a |
| HFD | 34.00 ± 19.66a | 62.53 ± 6.80a | 69.94 ± 9.10a |
| HFD + SS | 21.46 ± 9.14ab | 67.07 ± 8.13a | 72.22 ± 9.07a |
| HFD + FSS | 17.80 ± 8.15b | 61.37 ± 9.92a | 72.58 ± 6.77a |


 PDF
PDF ePub
ePub Citation
 Print
Print


 XML Download