

 PDF
PDF ePub
ePub Citation
 Print
Print


Introduction
The stressed life in modern society causes peoples sleep disorder more seriously. The sleep helpsphysical and mental states to be healthy because it occupies more than a third of life. So, fatigue, tiredness, drowsiness, decline of immunization, deterioration of interpersonal relations and depression are closely relatedwhen not taken enough sleep.1234 The sleep is achieved through the γ-aminobutyric acid (GABA)-ergic systems in the central nervous system (CNS). In CNS, glutamic acid decarboxylase (GAD) converts glutamate (the excitatory neurotransmitter) into GABA (the inhibitory neurotransmitter). GABA neurons, glutamate neurons and astrocytes are adjacent.5 If the GABA-ergic systems are activated by binding GABA to GABAA receptors, the extracellular Cl− will move into the cells to create a hyperpolarized state.5 As a result, it induces sleep state. Subunits of GABAA receptors are differently acted in accordance with the substance because GABAA receptors is composed of α, β, γ, δ, ε, θ and π subunits.67
Generally, various medicines such as benzodiazepins and barbiturates have been used to treat the sleep disorder or insomnia. However, these medicines have many the side-effects. To avoid the side-effects, the studies using natural plants are ongoing. Of these plants, Perillae Herba is the leaf of Perilla frutescens, a yearly plant, belonged to Dicotyledonlamiaceae. It has purple color and strong fragrance in general. Perillae Herba has been well cultivated in East Asia including China and Korea. It has been used as medicines such as a folk remedy for sedation.8 According to a recent study, Honda (1986) simply reported that Perillae Herba has the effect on sedation, and extends the sleep induced by hexobarbital9. Essential oils of PerillaeHerba are also able to change the hippocampal expression of brain-derived neurotrophic factor.10 Rosmarinic acid, a constituent of Perillae Herba, showed the antidepressant effect and sedative effect on some levels when carrying out the swimming test after injecting it to depressed mice11 and, made the rigid behaviorsbecome sedative when administered to mice exposed to stress.12 Therefore, this study was performed to know whether Perillae Herba ethanol extract (PHEE) improve pentobarbital-induced sleep in changingelectroencephalogram (EEG) through GABAA-ergic systems.
Experimental
Plants and extracts preparation
Perillae Herba was purchased from Lim-Argricultural Products Market (Yeong-cheon, Korea). This plant was confirmed by professor Mi-kyung Lee who works at the laboratory of pharmacognosy department in Chungbuk National University. Dried PerillaeHerba 1.0 kg was extracted with 50% ethanol at room temperature. It was concentrated under a constant pressure to obtain crude extract. Extract was concentrated under pressure to yield crude extract which was centrifuged and filtered, the filtrate was concentrated under a vacuum using a rotary evaporator to yield (10%) dried powder (100 g).
Reagents and chemicals
Sodium pentobarbital (100 mg/2 ml) were purchased through Hanlim Pharm. Co., Ltd. (Seoul, Korea), and Diazepam (10 mg/2 ml) were purchased through and Samjin Pharm. (Seoul, Korea). Muscimol (Tocris Bioscience, Bristol, UK) was purchased and Dimethyl sulfoxide (Amresco Solon, Ohio, USA) was purchased. Fetal bovine serum (FBS), Dulbecco's Modified Eagle Medium (DMEM), Trypsin-EDTA and Penicilline-Streptomycin was purchased from GIBCO (Grand island, NY, USA). N-(ethoxycarbonyl methyl)-6-methyl quinolinium bromide (MQAE) and Cytosine beta-d-arabinofuranoside was purchased from Sigma-Aldrich Co. (St. Louis, MO, USA). Specific polyclonal antibodies on the GABAA receptors subunits of the GAD65/67 extracted from rabbits and anti-rabbit immunoglobulin G-horseradish peroxidase was purchased from Abcam Inc. (Cambridge, UK). Chemiluminescent HRP substrate was purchased from Millipore Corporation (Billerica, MA, USA).
Animals
ICR mice and Sprague Dawley (SD) rats was purchased from Samtako (Osan, Korea). Rodents were kept in acrylic cages of 45 × 60 × 23 cm. The water and feed were given to rodents sufficiently. Temperature and humidity has been maintained 22 ± 2℃ and 50 - 52%, respectively, and the animal-room to change light and darkness automatically was used. Rodents went adapted during one week prior to the experiment. The experiment was performed between 10:00 a.m. and 5:00 p.m. complying with National Institute of Health Guide for Care and Use of Laboratory Animals (NIH publication No. 85-23, revised 1985) and the Animal Care and Use Guidelines of Chungbuk National University.
Measurement of locomotor activity
Locomotor activity was measured using a tilting type ambulometer (O'Hara AMB-10 in Tokio in Japan). PHEE (12.5, 25 and 50 mg/kg) and diazepam (2.0 mg/kg) were administered orally to the mice, 1 h and 30 min prior to the experiment, respectively. Each mouse was adjusted 10 min prior to the experiment in the activity cage that is 20 cm of diameter, 18 cm of height (Park et al., 2005). After oral administration of PHEE and diazepam, locomotor activity was measured for 1 h13.
Pentobarbital-induced sleep
Mice (10 - 15) were used in a group. Fasting was conducted 24 hs before the test, and the experiment was carried out between 10:00a.m. and 5:00 p.m. Pentobarbital sodium and muscimol was dissolved in 0.9% saline. PHEE (12.5, 25, 50 mg/kg) was orally administrated 1 h before measurement, and muscimol (0.2 mg/kg) was orally administrated 30 min before measurement. Then, mice that do not appear stereotactic reflection were moved to another empty cage after pentobarbital sodium (42 mg/kg) was injected intraperitoneally (0.1 ml/10 g). The period from the administration of pentobarbital sodium to not showing stereotactic reflection was recordedas sleep latency, and the period from falling into the sleep to showing stereotactic reflection was recordedas total sleeping time. When mice treated with pentobarbital sodium did not sleep within 15 minutes, those animals were excluded from the experiment.14
Measurement of electroencephalogram
After i.p. injectionof pentobarbital (50 mg/kg) into the abdominal cavity of rats, they were anesthetized.The hair on rat's head was removed by hair trimmer. Rat placed on a pad that has a fixed stereotaxic apparatus. The scalp was made an incision with a scalpel and splayed the portion of incision under that scalp. Then, a transmitter (Data Sciences International TA11CTA-F40, MN, USA) was inserted, and the two lines of the seven lines which were connected to transmitter was fixed under the skin. The periosteum to see skull was removed, and the blood was wiped with a sterile cotton. The two holes were made in the skull with a drill (A: 2.0 [Bregma], L: 1.5; P: 7.0 [Bregma], L: 1.5 contra-lateral), and two lines except lines fixed under the skin was fixed to the skull using the dental cement. After incision regions were sutured with silk 4 - 0 suture, antibiotics (5 million unit potassium penicillin-G Injection, Kunwha, Korea) was injected into the abdominal cavity.
Following 7 days post-surgical recovery, PHEE (50 mg/kg) was administrated one hour before the experiment. EEG measurements were a little changed from the previous study.15 Cage where rat is was put on a measuring device. Set of EEG signals were amplified, and designated as 0.5 - 20.0 Hz range. −0.5 / +0.5 Volts per units x2 was set to add, and it was controlled by Data Sciences International analog converter. The measuring signal was changed into a sampling rate of 128 HZ through AD converter (Eagle PC30, USA), transferred to the computer, and saved. On-line fast fourier transformation (FFT) collected the EEG data every two seconds following processing the Hanning window. It was created a power density values from 0.0 to 20.0 by FFT analyzer. FFT data calculated the average in the range from 0 to 20 Hz per 10 seconds. The sleep data and FFT result are stored every 10 seconds for additional analysis. Movement of the rats was associated with the remote receiver formed transistor-transistor logic (TTL) pulses, which was considered as a measure of the movement. Data measurements were conducted between 11:00 a.m. and 5:00 p.m., and each rat was measured at the same time. Sleep data were stored through the Sleep-Sign 2.1 software (KISSEI Comtec Co. Ltd., Matsumoto, Japan). Data have been classified as wakefulness, non-rapid eye movement (NREM) and rapid eye movement (REM) every 10 seconds16. Software classified the EEG signal based on the next. Wakefulness and NREM were classified as a high frequency and slow wave respectively. During REM sleep, δ wave (0.75~4.0 Hz) of EEG was reduced, and the θ wave (5.0~9.0 Hz, 7.5 Hz at the peak) increased. Sleep/wake cycles and sleeping time of NREM, REM and total sleep time (NREM + REM) is measured for 6 hours. The absolute EEG power recorded wakefulness, NREM and REM in a box of 0.5 Hz in the range of from 0.5 to 20 Hz for 6 hours. NREM, REM and wakefulness were calculated in δ, θ, α (8.0~13.0 Hz). Values measured were calculated in Microsoft Excel.
Primary cell culture
The primary culture was conducted using hypothalamus of 8 days-old SD rats.17 The bottom of 96 well microplate wascoated with Poly-L-lysine (50 µg/ml). 1.0 × 10⁵ cells/ml cells were putinto each well of 96 well microplate. Cells were cultured using 10% heat-inactivated fetal bovine serum (FBS), 2.0 mM glutamine, 100 µg/ml gentamycin, 10 µg/ml antibiotic-antimycotic solution (Sigma), 25 mM potassium chloride and DMEM. Cells was cultured at the proper humidity, 5% CO2 and 37℃ incubator. 16 hours after the incubation, cytosine arabinofuranoside (final concentration: 10 µM; Sigma) was treated. Then, Neurobasal A medium was used instead of DMEM.
Measurement of intracellular Cl− influx
The intracellular Cl− influx was measured in hypothalamic cells by using MQAE that is the Cl− sensitive fluore-scence probe.18 After treated with 10 µM MQAE (final concentration) were incubated overnight, cells were washed using the pH 7.4 buffer including 10 mM HEPES, 2.4 mM HPO42−, 0.6 mM H2PO4−, 10 mM D-glucose and 1 mM MgSO4 three times. After PHEE (0.1, 1.0 and 10 µg/ml) was treated respectively in each well, fluorescence was measured in the excitation wavelength 320 nm and emission wavelength 460 nm using the microplate reader (SpectraMax M2e Multi-mode, PA, USA).19 F/F0 value was calculated using F value which ismeasured in sample-group and F0 value which is measured in control-group.
Western blot of GAD65/67 and GABAA receptors subunit
PHEE (12.5, 25 and 50 mg/kg)were orally administered 1 h before experiment and diazepam (2.0 mg/kg) were orally injected 30 min before experiment in the mice. After sample-processing, The hypothalamus of mice was homogenized with 4℃ lysis buffer (25 mM Tris-HCl/pH 7.4, 150 mM NaCl, 1 mM CaCl2, 1% Triton X-100, 1 mM PMSF, 10 µl/ml aprotinin, 1 mM NaF and 2 mM sodium ortho-vanadate). Then, it was centrifuged for 15 min at 4℃, 13,000 rpm, and the supernatant was collected. Bradford protein assay method was used to calculate protein concentration20. The calculated protein was put in 10% SDS-polyacrylamide gel. And, it was electrophoresed. Proteins in gel were transferred by using the PVDF membrane (Hybond-P GE Healthcare, Amersham, UK). The membrane transferred was blocked for one hour and at room temperature by using the 5% (w/v) BSA dissolved in the Tris buffered saline solution including 0.1% Tween-20. The membrane was washed with TBST solutionincluding 3% Tween-20 three times. The specific polyclonal antibody for the GABAA receptors and GAD65/67 was diluted in 1:2,500 and made with 5.0% BSA and TBST. After it was attached to the membrane, it was incubated overnight at 4℃. After washing membrane with PBS three times, the membrane adding horseradish peroxidase-conjugated secondary antibody (1:3000 for goat anti-rabbit IgG) made of TBST was incubated for 4 hours at room temperature. After washing with TBST three times, Proteins in membrane were taken using ECL solution (Roche Diagnostics, Mannheim, Germany).
Statistical analysis
All statistical analysis was conducted with SigmaStat software of SPSS Inc. (Chicago, USA). Results are shown as mean ± SEM. When compared to the control group and the sample group, Significance was evaluated by Analysis of Variance (ANOVA). If there is a significant difference, values were compared respectively with Dunnet-test. However, in subhypnotic pentobarbital-induced sleep, the number of sleeping mice was compared by using Chi-square test. It was considered that P value has considerable significance when less than 0.05.
Result and Discussion
Decreased locomotor activity by PHEE
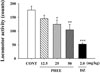
After PHEE (12.5, 25 and 50 mg/kg, p.o.) were administered, the locomotor activity was measured (Fig. 1). In comparison with control group, PHEE (25 mg/kg) reduced about 29.3% and PHEE (50 mg/kg) reduced about 40.8%. Particularly, the diazepam (2 mg/kg) group used as a positive control, reduced about 70.4%.
Enhanced pentobarbital-induced sleep by PHEE
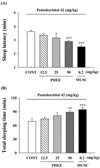
PHEE (12.5, 25 and 50 mg/kg, p.o.) and muscimol (0.2 mg/kg, p.o.) were administered prior to medicating pentobarbital (42 mg/kg, i.p.). As a result, sleep latency was decreased and total sleep time was increased. In sleep latency (Fig. 2.A), PHEE (25mg/kg) decreased approximately 12.8%, and PHEE (50 mg/kg) decreased approximately 19.9%. In total sleep time (Fig. 2.B), PHEE (50 mg/kg) increased approximately 29.3%. Muscimol (0.2 mg/kg, p.o.) as a positive control,decreased approximately 30.8% in sleep latency, and increased approximately 37.9% in total sleep time.
Improved sub-hypnotic pentobarbital-induced sleep by PHEE
Sub-hypnotic pentobarbital (28 mg/kg, i.p.) was injected following PHEE (12.5, 25 and 50 mg/kg, p.o.) and muscimol (0.2 mg/kg, p.o.). The more concentration of PHEE was thick,the more counts of mice falling the sleep were increased (Table 1). Mostly, significant increase was showed in PHEE (50 mg/kg) and muscimol (0.2 mg/kg). The sleep time of mice falling the sleep was increased. PHEE (25 mg/kg),PHEE (50 mg/kg) increased roughly 43.7%, 63%, respectively and muscimol (0.2 mg/kg) also increased roughly 66% compared with control.
Reduced sleep/wake cycles by PHEE
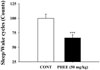
As a result measuring electroencephalogram after PHEE (50 mg/kg, p.o.) was administered in rats, the counts of sleep/wake cycles was reduced (Fig. 3). In comparison with control, PHEE (50 mg/kg) reduced about 33.6% and showed significant change.
Changed sleep architectures by PHEE
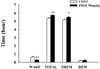
Sleep architectures of rats medicating PHEE (50 mg/kg, p.o.) were changed (Fig. 4). PHEE (50 mg/kg) decreased approximately 57.5% in wakefulness time but increased approximately 6.7% in total sleep time. That is, PHEE (50 mg/kg) group fell a longer sleep than sleeping time of control group. However, there are not significant alteration on NREM sleep and REM sleep.
Altered power density by PHEE
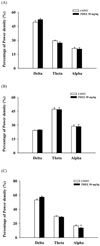
Power density of δ, θ, α-waves of wakefulness, REM sleep and NREM sleep was measured through EEG of rats. Wakefulness and REM sleep did not have significant changes (Fig. 5A, Fig. 5B). However, NREM sleep was changed (Fig. 5C). In waves of NREM sleep, α-wave was decreased roughly 18.1% although there were not changes in δ and θ-waves.
Increased intracellular Cl− influx in primary cultured hypothalamic cells by PHEE
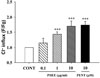
When PHEE (0.1, 1 and 10 µg/ml) were treated in primary cultured hypothalamic cells, influx of Cl− was measured. The more concentration rises, the more Cl− influx was increased (Fig. 6). PHEE (1 µM) increased about 43.4% and PHEE (10 µM) increased about 69.76%. Particularly, pentobarbital (10 µM) as a positive control increased about 74.18%. PHEE (1, 10 µM) and pentobarbital (10 µM) showed significant changes.
Over-expressed GAD65/67 by PHEE
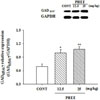
Expression of GAD65/67 was measured after PHEE (12.5 and 25 mg/kg) was injected in mice. Both PHEE (12.5mg/kg) and PHEE (25 mg/kg) changed the expression of GAD65/67, (Fig. 7). PHEE (12.5 mg/kg) enhanced approximately 43.5% and PHEE (25mg/kg) enhanced approximately 54.9% compared with control.
Over-expressed GABAA receptors subunits by PHEE
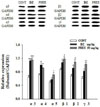
Of GABAA receptors subunits, expression of α3, α4, α5, β1, β2 and γ3 subunits was measured following PHEE (50 mg/kg) was administered in mice. Changes were in α3, α5, β1, β2 and γ3 subunits except α4 subunit (Fig. 8). In comparison with control, PHEE (50 mg/kg) improved 78.9%, 46.7%, 35.4%, 60% and 70.1% in α3, α5, β1, β2 and γ3 subunits respectively. Diazepam (2 mg/kg) which is a positive control improved 74.8%, 23.1% and 36.4% in α3, β1 and γ3 subunits respectively.
Perillaeherba has been used to relax from old times in the oriental countries. According to the recent study, Parillae Herba consists of various materials including perillaldehyde, limonene, cyanin, shisonin, rosmarinic acid, adenine and arginine.21 Perillaldehyde showed antidepressant-like effects, which related to GABA-ergic systems, on the olfactory nervous system in mice.22 Rosmarinic acid revealed sedative effects on some levels when carrying out the swimming test after injecting it to depressed mice11 and when administered to mice exposed to stress.12 Adenine, a type of bases, becomes adenosine after combining with deoxyribose. Adenosine receptors modulate GABAA receptor-mediated responses.23 Because the sleep disorders are associated with sedative action and GABAA-ergic systems, this study was performed to identify whether PerillaeHerba is useful on insomnia.
We first carried out the measurement of locomotor activity in mice administrating PerillaeHerba ethanol extract (PHEE). The result presented the locomotor activity was more reduced in the higher concentration. Through this, we knew PHEE has sedative effects. After injecting hypnotic pentobarbital (42 mg/kg, i.p.), PHEE increased the total sleep and decreased the sleep latency in mice. Also, after injecting sub-hypnotic pentobarbital (28 mg/kg, i.p.), PHEE increased the counts of mice falling the sleep as well as the total sleep. Because pentobarbital is one of the barbiturates, it combines with GABAA receptor which has the barbiturate binding site. GABAA receptor combining with pentobarbital is activated and finally causes results such as the inducing sleep in CNS.24 So, we found PHEE has ability improving the pentobarbital-induced sleep. In measurement of electroencephalogram (EEG) administrating PHEE (50 mg/kg, p.o.) in rats, PHEE decreased the sleep/wake cycles, which are regulated by hypothalamus.25 In addition, the sleep architectures were changed.Waking time decreased and total sleeping time increased.The α-wave of non-rapid eye movement (NREM) sleep was reduced in power density. Fallingasleep is to become states of rapid eye movement (REM) sleep and NREM sleep. Entering into NREM sleep is to fall the deep sleep. While sleeping, REM sleep and NREM sleep are repeated and, density of sleep-waves such as α, θ, δ-waves is changed.25 According to previous studies, not only the extension of NREM and REM sleep but also increase of slow waves in NREM sleep plays important roles in the sleep. GABAA receptor agonists decrease the wakefulness and increase REM and NREM sleep26. GABAA receptor agonists include materials such as benzodiazepines and barbiturates. That is, PHEE improved the sleep as GABAA receptor agonists.
To check whether PHEE influence GABAA-ergic systems, intracellular influx of Cl− as well as the protein expressions of GAD65/67 and GABAA receptors subunits was measured in hypothalamus. PHEE enhanced intracellular Cl− influx. When GABAA receptor agonists bind to the binding sites, Cl− channels of GABAA receptors open. The cellsare hyperpolarized when Cl− enters into these through opened Cl− channels. Hyperpolarized cells are able to induce sedation and sleep. The protein expressions of GAD65/67 and GABAA receptors subunits were changed. PHEE increased expressions of GAD65/67which changes glutamate into GABA as an enzyme. Also, α3, α5, β1, β2 and γ3 subunits were overexpressed except α4 subunit in GABAA receptors subunits. GABAA receptors have diverse subunits and these assemble another in various forms.2728 Most existing subunits-compound of GABAA receptors is closely connection with hypnotics and sedation29. So, it was recognized that PHEE related to GABAA-ergic mechanisms. To sum up, PHEE decreased the locomotor activity. PHEE improved hypnotic/sub-hypnoticpentobarbital-induced sleep and the sleep/wake cycles, sleep architectures (wakefulness and total sleep) and power density of NREM. In addition, PHEE increased intracellular Cl− influx as well as the protein expressions of GAD65/67 and GABAA receptors subunits. It suggests that somnogenic effects of PHEE may be mediated by GABAA-ergic systems and PHEE would be effective on the treatment of insomnia.

 XML Download