Abstract
The aim of this study was to evaluate the anti-Helicobacter pylori activity of fractions and major aglycon compounds (baicalein, chrysin, oroxylin A, wogonin) of Scutellariae Radix. Minimum inhibitory concentration (MIC) measurement, DPPH radical-scavenging assay, DNA protection assay, and urease inhibition analysis were performed. The ethyl acetate (EtOAc) fraction showed the potent anti-Helicobacter activity, and therefore, compounds in the EtOAc fraction were subjected to further assay. The MICs of chrysin, oroxylin A, and wogonin against Helicobacter pylori 26695 were 6.25, 12.5 and 25 µg/mL, respectively. Baicalein exhibited the most effective DPPH radical-scavenging activity. DNA protection using Fenton reaction, chrysin, oroxylin A, and wogonin showed effective DNA protective effect. This result was also confirmed by quantitative real-time polymerase chain reaction (qRT-PCR). Regarding Jack bean urease (0.5 mg/mL, 50 unit/mg) inhibition, 20 mM ofbaicalein and chrysin inhibited urease activity by 88.2% and 72.5%, respectively.
Go to : 
References
(1). Peek R. M.., Blaser M. J.Nat. Rev. Cancer. 2002. 2:28–37.
(2). Kim B. J.., Kim J. G.Kor. J. Med. 2015. 89:133–141.
(3). De Francesco V. D.., Giorgio F.., Hassan C.., Manes G.., Vannella L.., Panella C.., Ierardi E.., Zullo A. J.Gastrointestin. Liver Dis. 2010. 19:409–414.
(4). Jung K. W.., Won Y. J.., Kong H. J.., Oh C. M.., Cho H. S.., Lee D.H.., Lee K. H.Cancer Res. Treat. 2015. 47:127–141.
(5). Shin A.., Park S.., Shin H. R.., Park E. H.., Park S. K.., Oh J. K.., Lim M. K.., Choi B. Y.., Boniol M.., Boffetta P.Ann. Oncol. 2011. 22:1435–1442.
(6). Shin A. S.., Kim J. S.., Park S. H. J.Gastric Cancer. 2011. 11:135–140.
(7). Zhang Q. B.., Nakshabendi I. M.., Mokhashi M. S.., Dawodu J. B.., Gemmell C. G.., Russell R. I.Gut. 1996. 38:841–845.
(8). Shao Z. H.., Li C. Q.., Vanden Hoek T.L.., Becker L. B.., Schumacker P. T.., Wu J.A.., Attele A.S.., Yuan C. S. J.Mol. Cell. Cardiol. 1999. 31:1885–1895.
(9). Huang W. H.., Lee A. R.., Yang C. H.Biosci. Biotechnol. Biochem. 2006. 70:2371–2380.
(10). Wang Y. C.., Huang K. M.Food Chem. Toxicol. 2013. 53:376–383.
(11). Ustün O.., Ozcellik B.., Akyön Y.., Abbasoglu U.., Yesilada E. J.Ethnopharmacol. 2006. 108:457–461.
(12). Kang M. H.., Lee J. H.., Lee Y. S.., Son K. H.., Lee D. H.., Kim Y. S.., Kang S. S.., Bang H. C.., Jeong C. S.Yakhak Hoeji. 2007. 51:68–74.
(13). Clinical and Laboratory Standards Institute (CLSI). Performance standards for antimicrobial susceptibility testing, 19th Informational Supplement. 2009. . Document M100-S19, CLSI, Wayne, PA.
(14). Li H. B.., Chen F. J.Chromatogr. A. 2005. 1074:107–110.
(15). Choi J. S.., Oh J. I.., Hwang I. T.., Kim S. E.., Chun J. C.., Lee B. H.., Kim J. S.., Kim T. J.., Cho K. Y.Kor. J.Pestic. Sci. 2003. 7:92–99.
(16). Lee J. C.., Kim H. R.., Kim J.., Jang Y. S. J.Agric. Food Chem. 2002. 50:6490–6496.
(17). Weatherburn M. W.Anal. Chem. 1967. 39:971–974.
(18). Choi Y. S.., Cheon J. H.., Lee J. Y.., Kim S. G.., Kim J. S.., Kim N. Y.., Lee D. H.., Kim J. M.., Jung H. C.., Song I. S.Korean J. Gastroenterol. 2006. 48:156–161.
(19). Wu J.., Hu D.., Wang K. X.Zhong Yao Cai. 2008. 31:707–710.
(20). Shin S. J.., Park C. E.., Baek N. I.., Chung I. S.., Park C. H.Biotechnol. Bioprocess Eng. 2009. 14:140–145.
(21). Park C. E.., Park C. H.Korean Chem. Eng. Res. 2013. 51:591–596.
(22). Tan L.., Su J.., Wu D.., Yu X.., Su Z.., He J.., Wu X.., Kong S.., Lai X.., Lin J.., Su Z.Scientific World Journal. 2013. doi: 10.1155/2013/879501.
(23). Yu X. D.., Zheng R. B.., Xie J. H.., Su J. Y.., Huang X. Q.., Wang Y. H.., Zheng Y. F.., Mo Z. Z.., Wu X. L.., Wu D. W.., Liang Y. E.., Zeng H. F.., Su Z. R.., Huang P. J.Ethnopharmacol. 2015. 162:69–78.
(24). Wu D. W.., Yu X. D.., Xie J. H.., Su Z. Q.., Su J. Y.., Tan L. R.., Huang X. Q.., Chen J. N.., Su Z. R.Fitoterapia. 2013. 91:60–67.
Go to : 
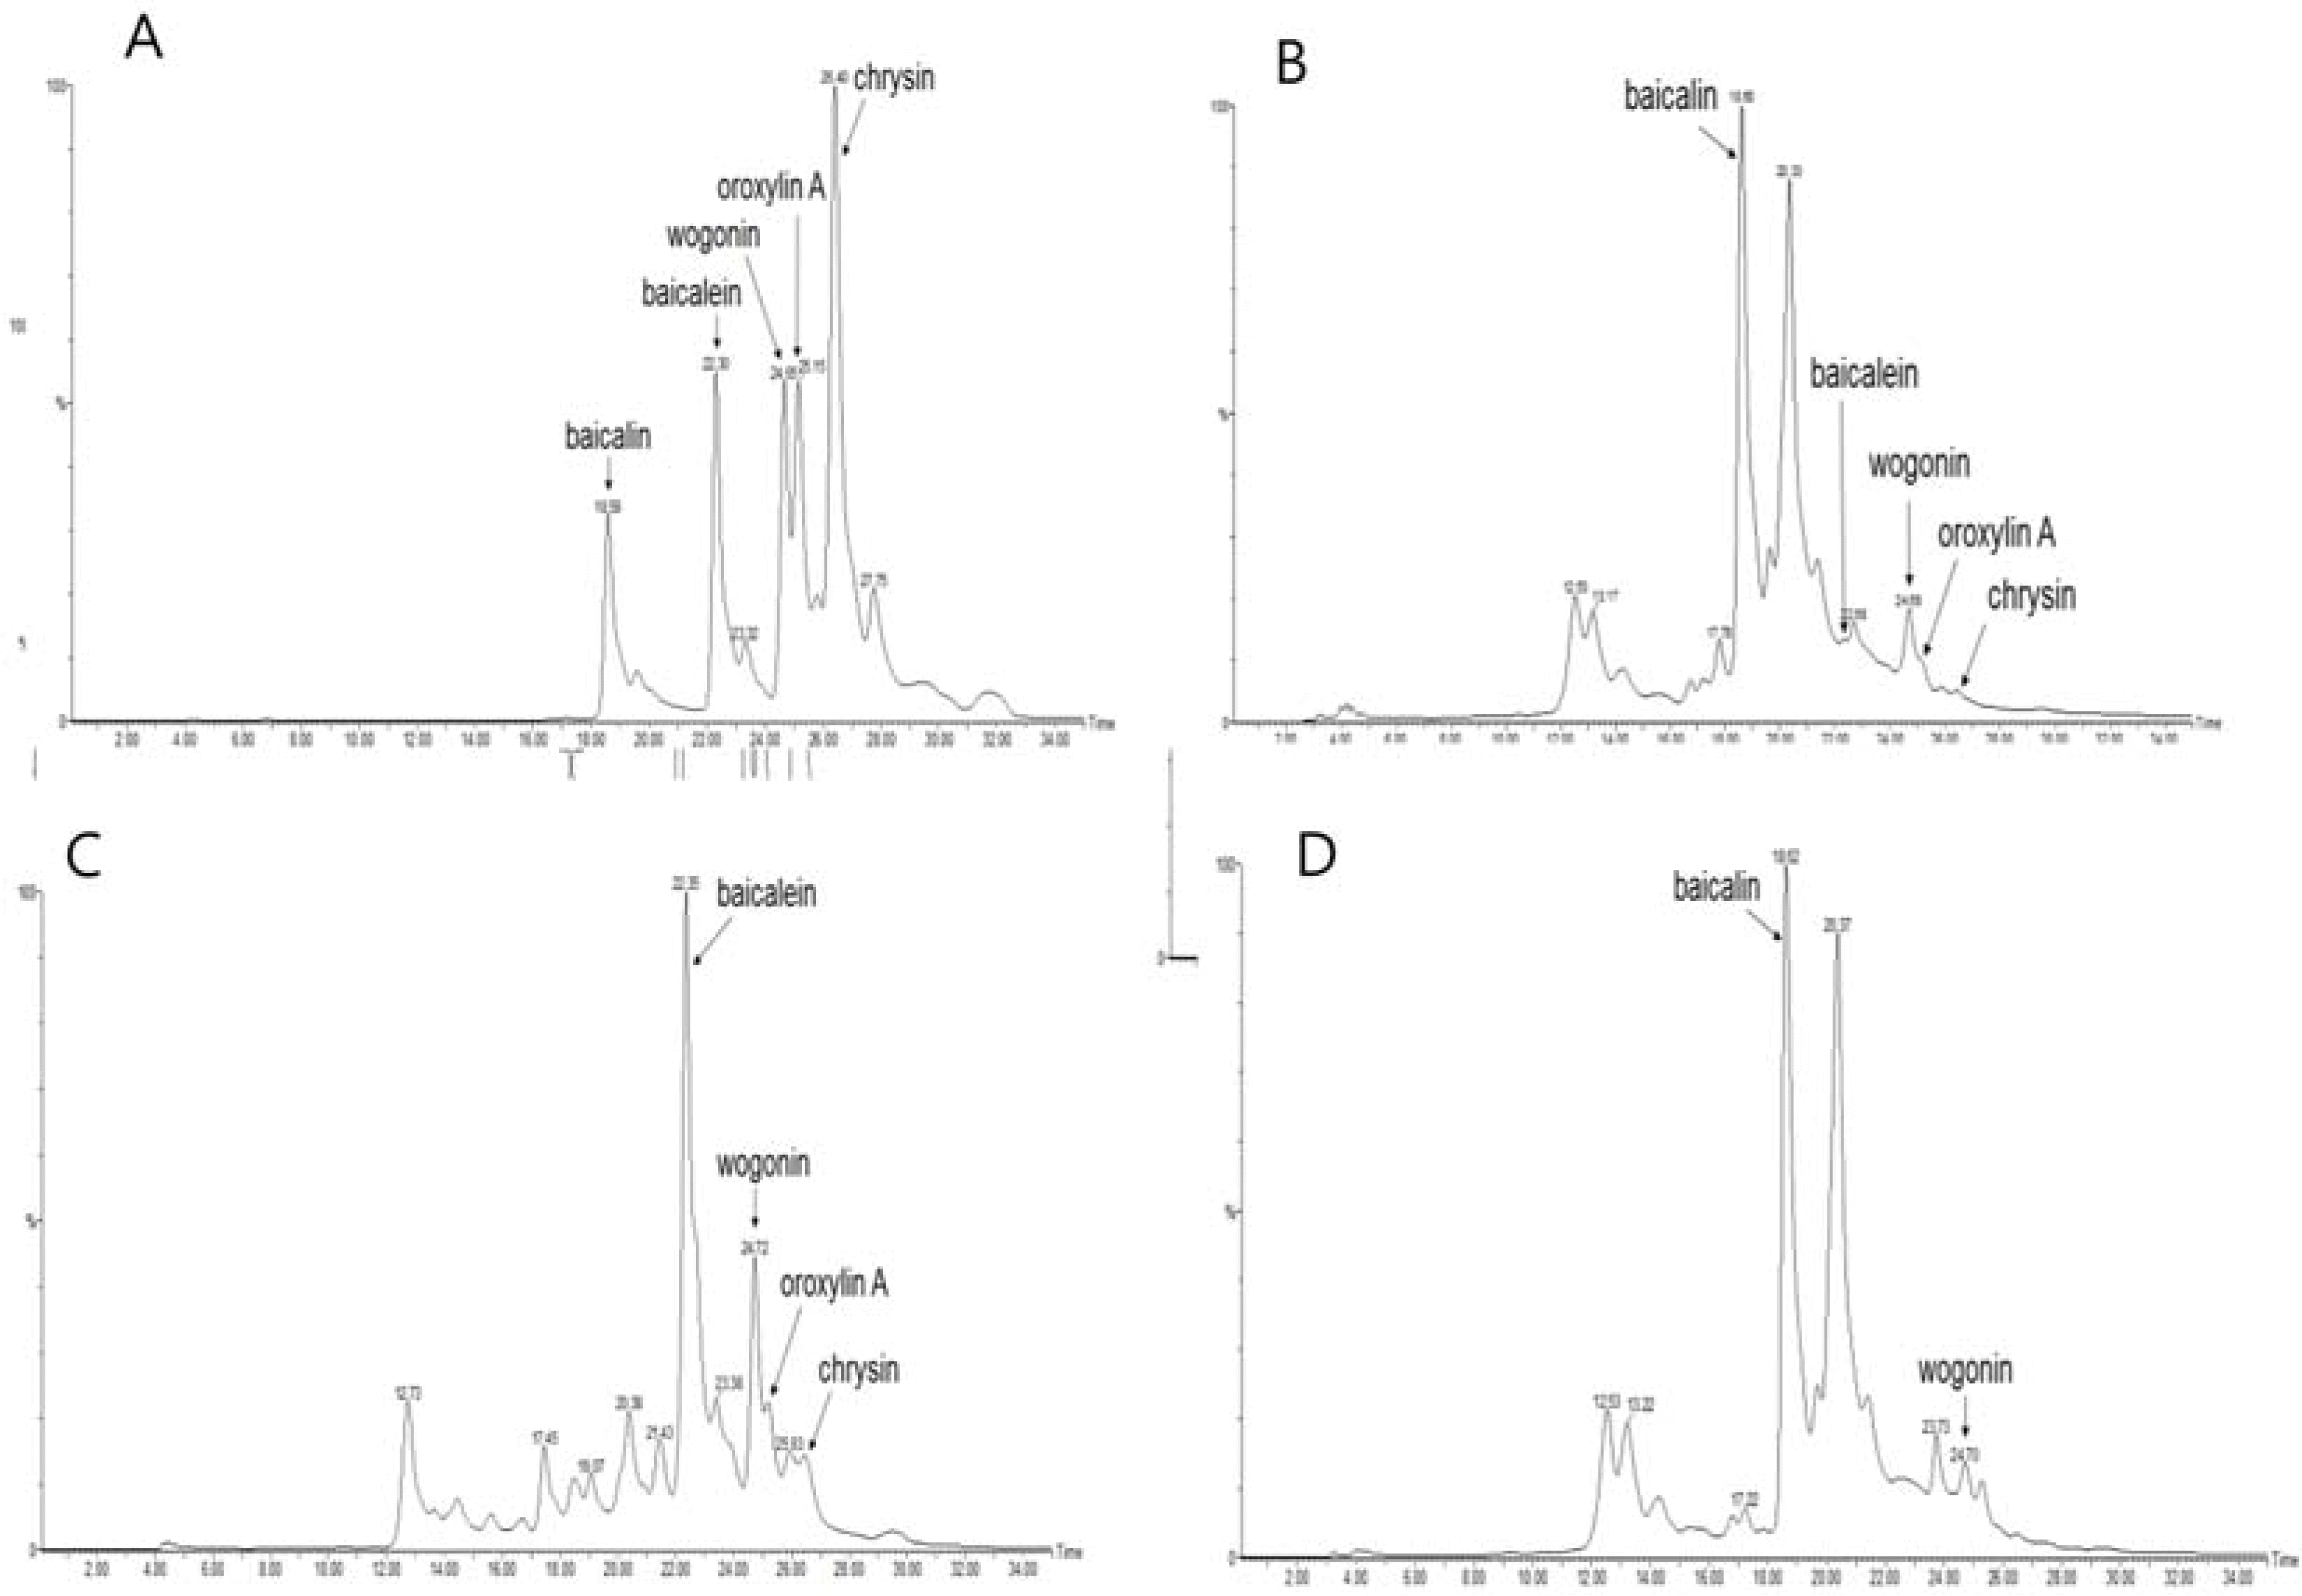 | Fig. 2.Chromatogram of five standards (baicalin, baicalein, wogonin, oroxylin A, chrysin) and each fraction of Scutellariae Radixby HPLC analysis. A: five standards; B: total extract; C: EtOAc fraction; D: n-butanol fraction. |
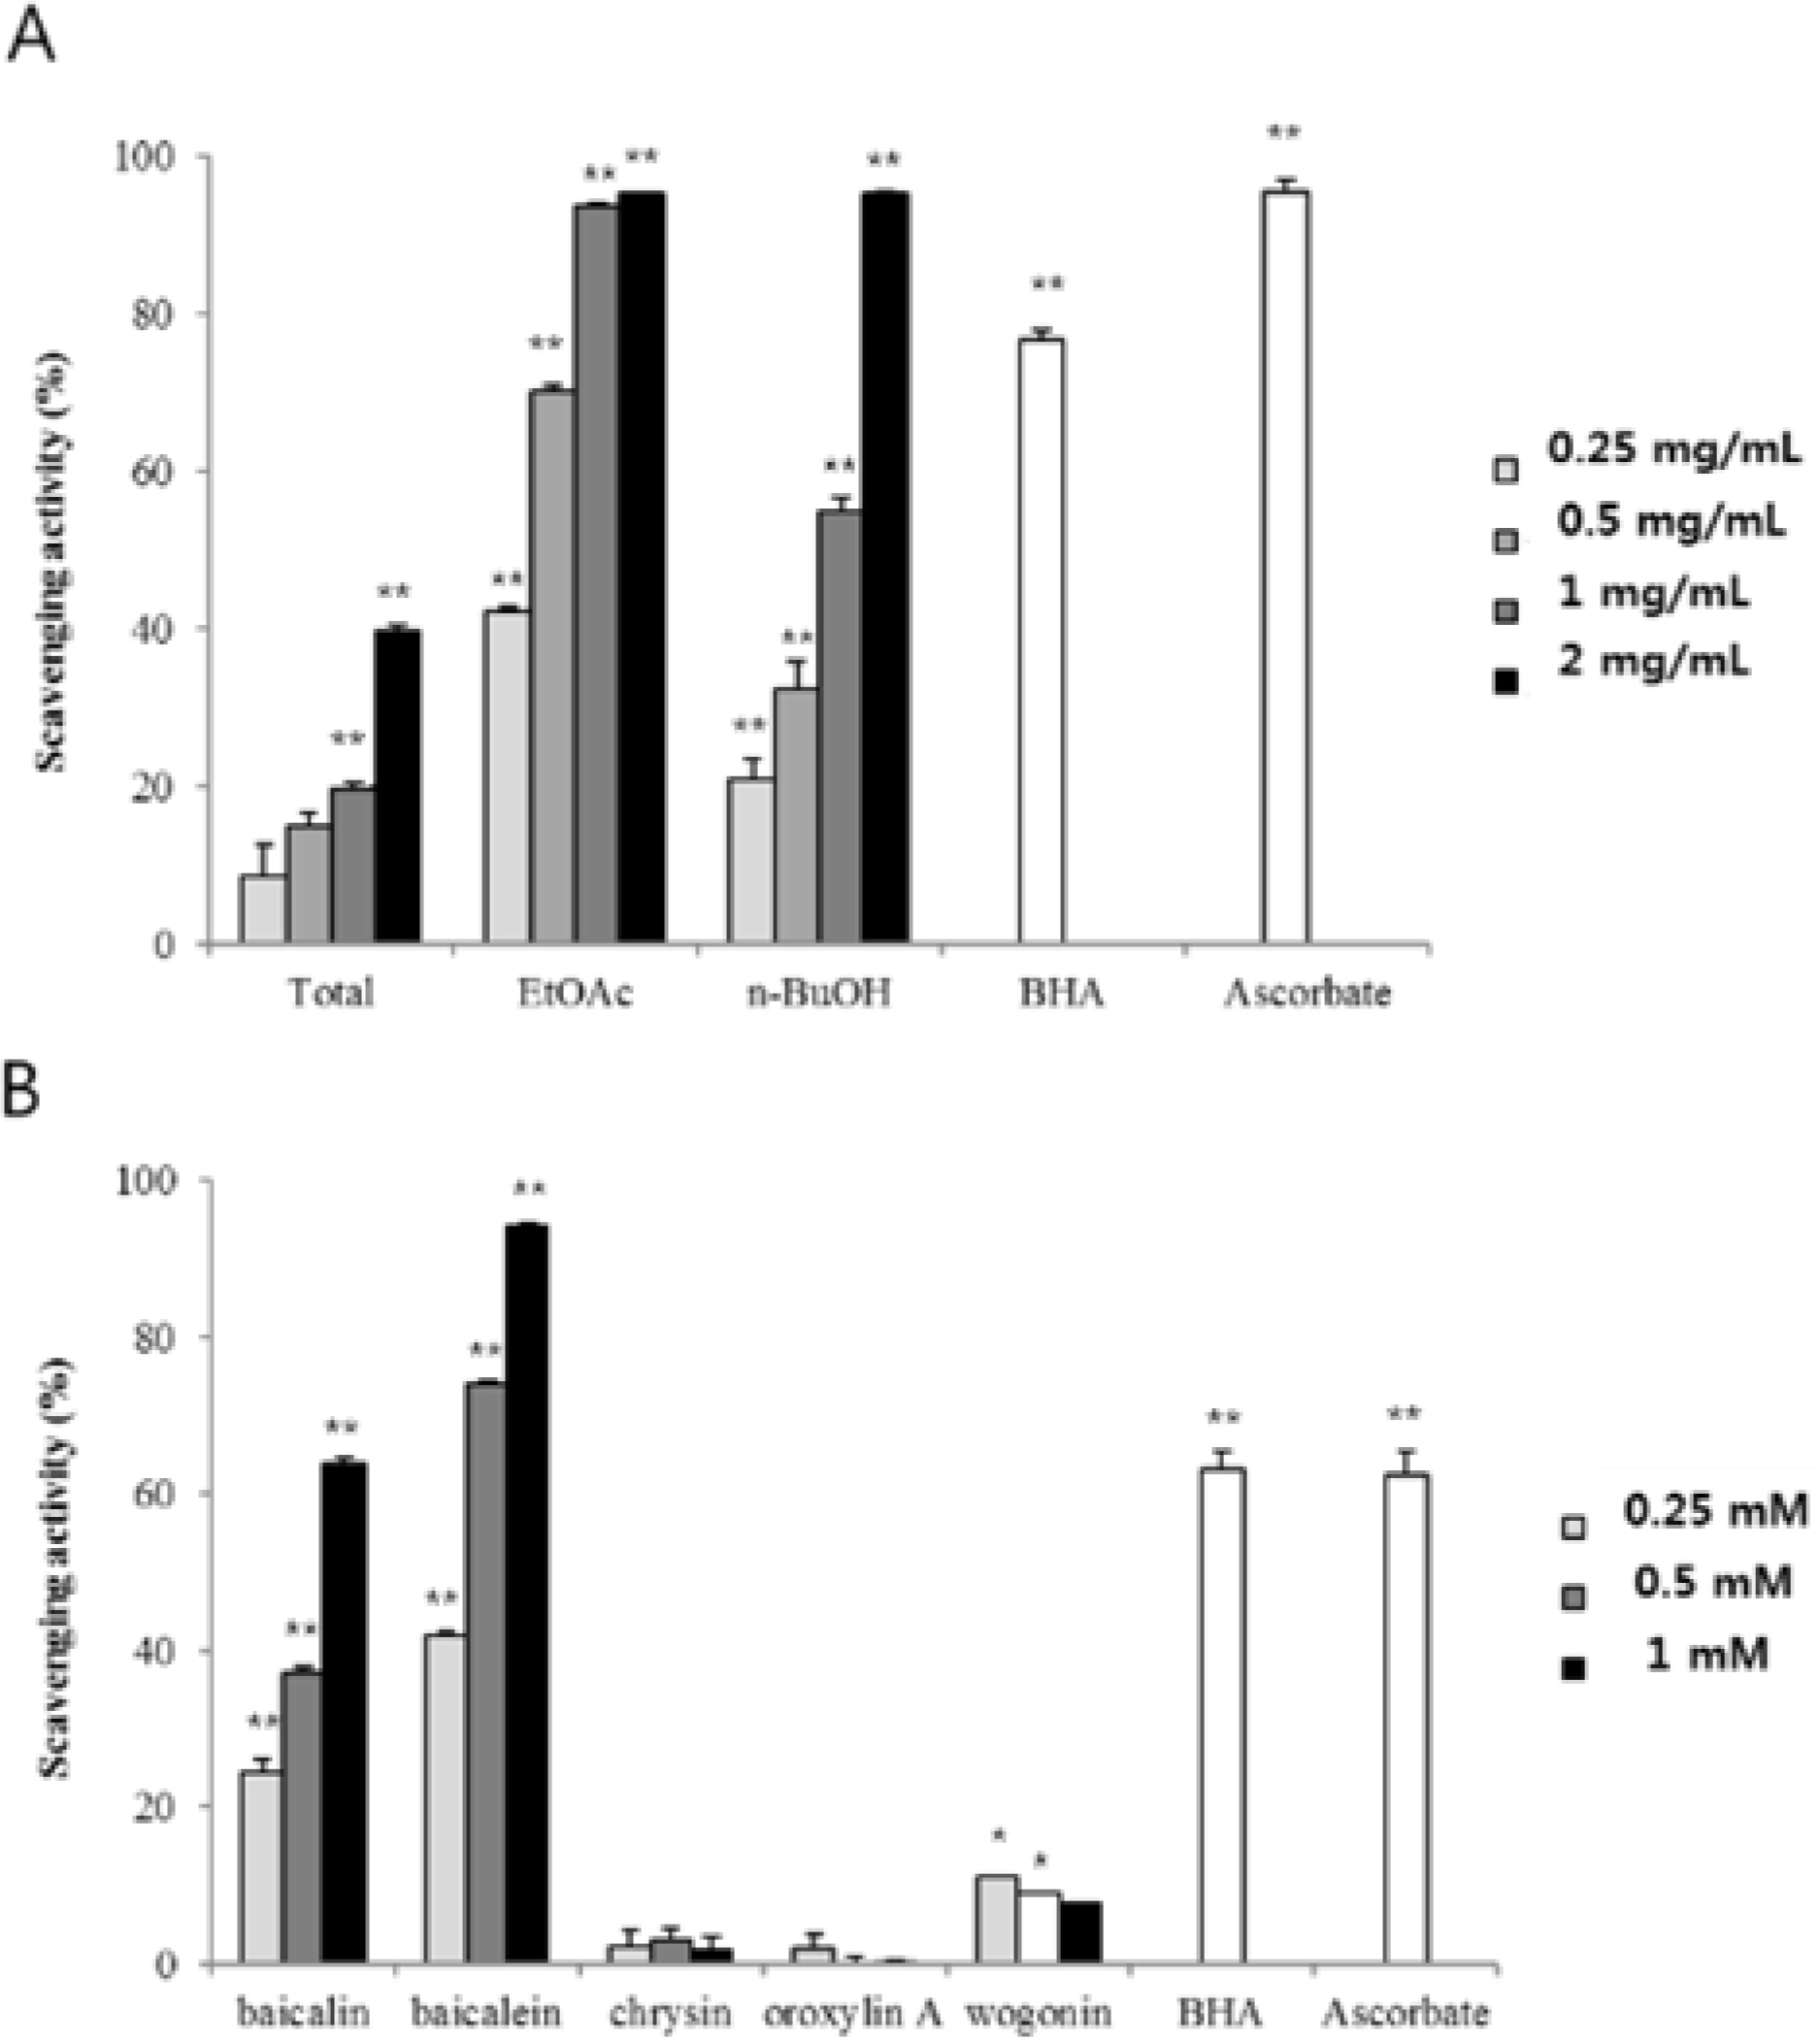 | Fig. 3.DPPH radicalscavenging activity of fractionsand compounds from ScutellariaeRadix. Each fraction (A) (0.25 – 2.0 mg/ mL) and compound (B) (0.25 – 1.0 mM) was tested and ascorbic acid and BHA (0.25 mg/mL for fractions, 1 mM for compounds) were used as positive controls. Data represent the mean ± SD of three replicates; ∗p < 0.05, ∗∗p < 0.01, significant difference compared to the negative control. |
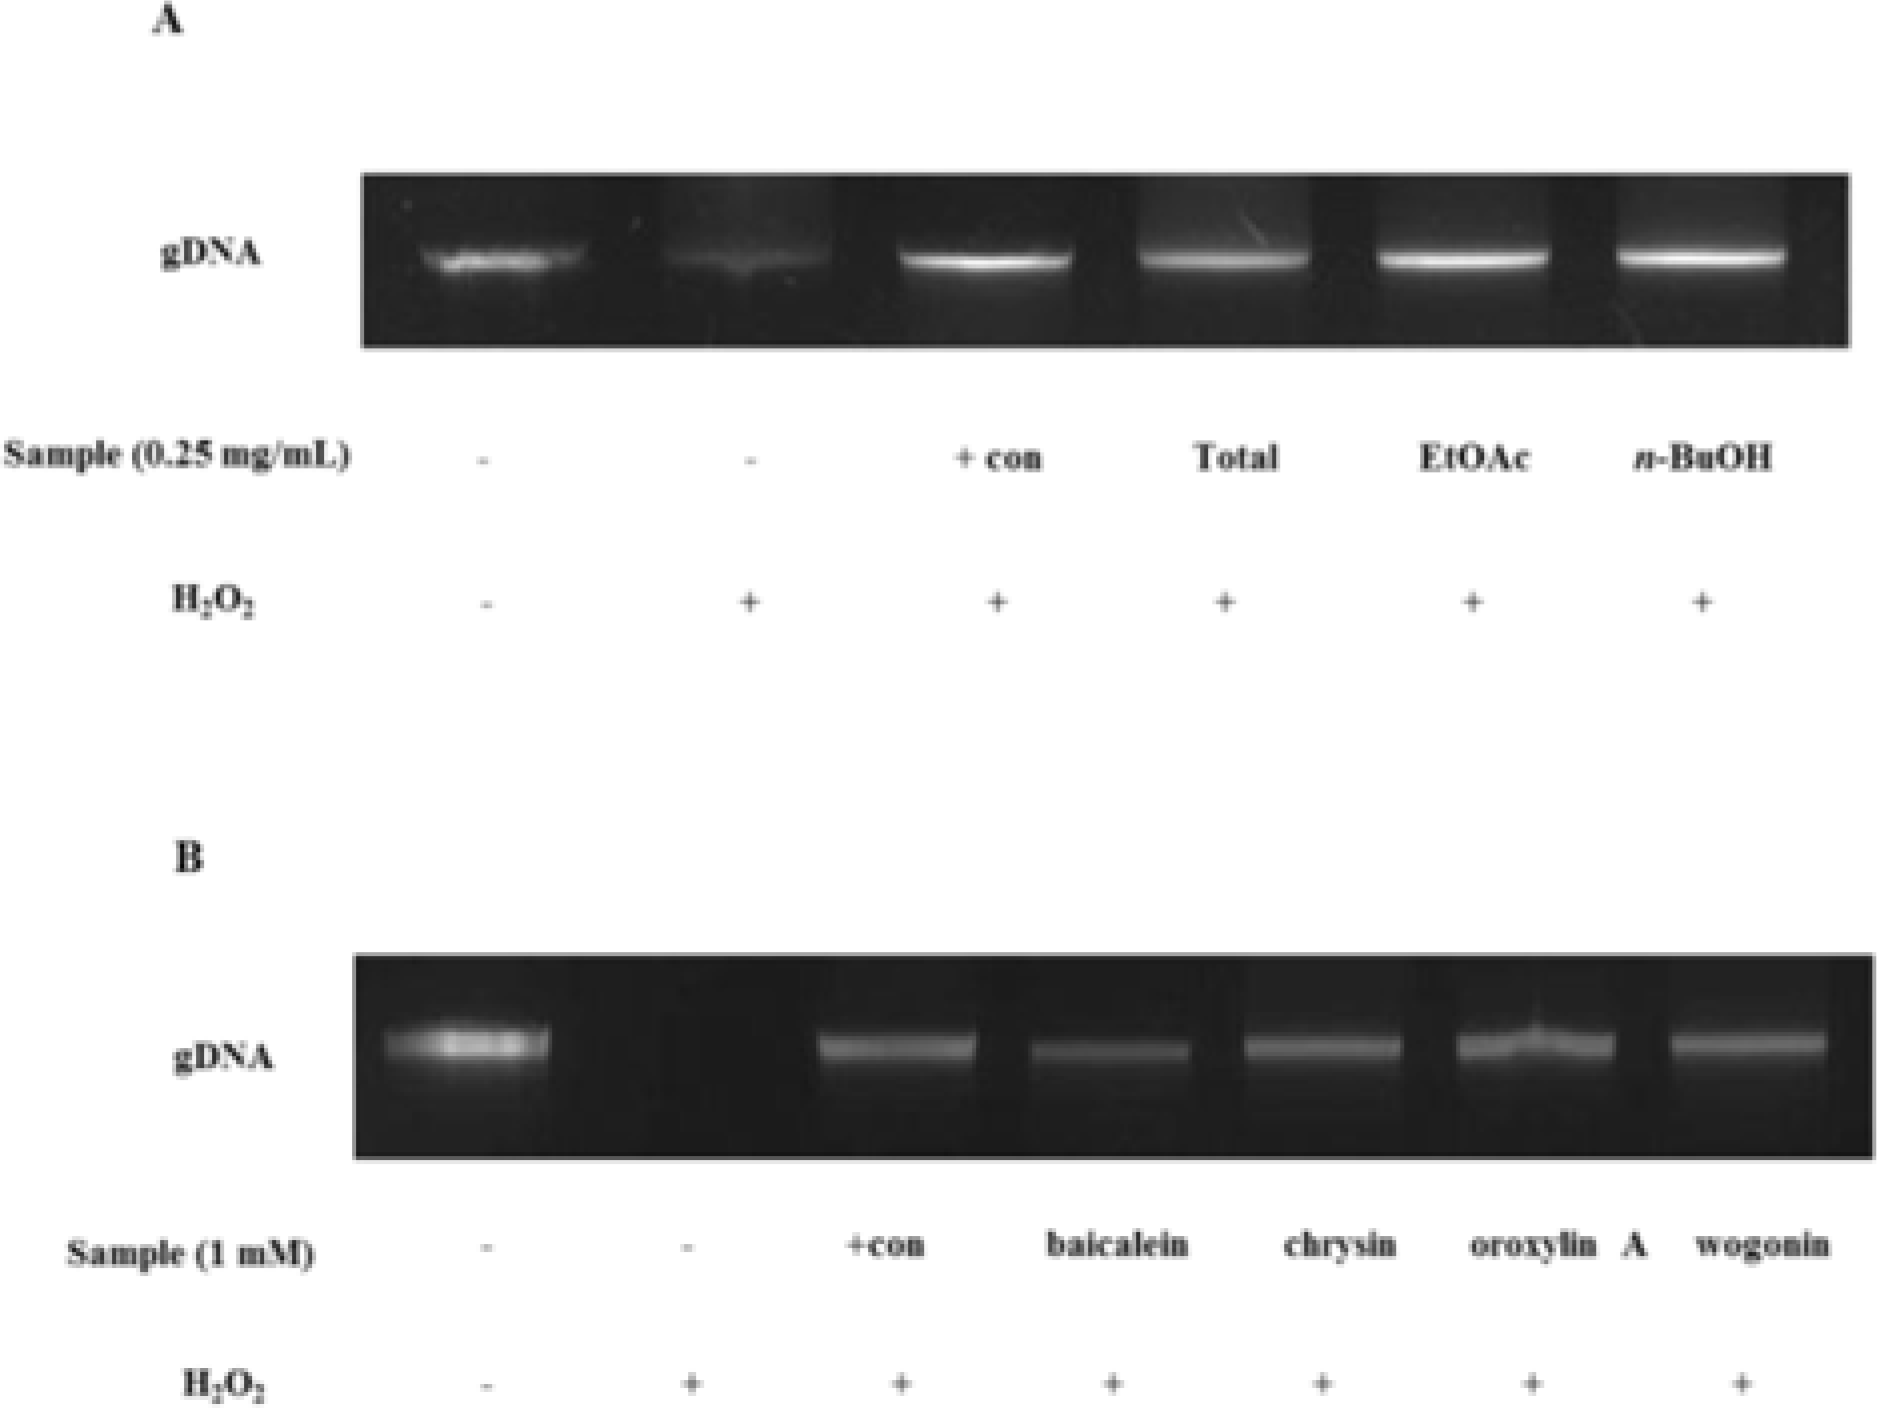 | Fig. 4.DNA protective effect against hydrogen peroxide of fractions (A) and compounds (B) from Scutellaria Radix. (A) 1: AGS cell; 2: AGS cell + Fenton reagent; 3: AGS cell + Fenton reagent + quercetin; 4: AGS cell + Fenton reagent + total Fr.; 5: AGS cell + Fenton reagent + EtOAc Fr.; 6: AGS cell + Fenton reagent + n-BuOH Fr. (B)1: AGS cell; 2: AGS cell + Fenton reagent; 3: AGS cell + Fenton reagent + quercetin; 4: AGS cell + Fenton reagent+bacialein; 5: AGS cell+Fenton reagent+chrysin; 6: AGS cell + Fenton reagent + oroxylin A; 6: AGS cell + Fenton reagent + wogonin. The concentrations of each fraction and each compound were 0.25 mg/mL and 1 mM respectively. |
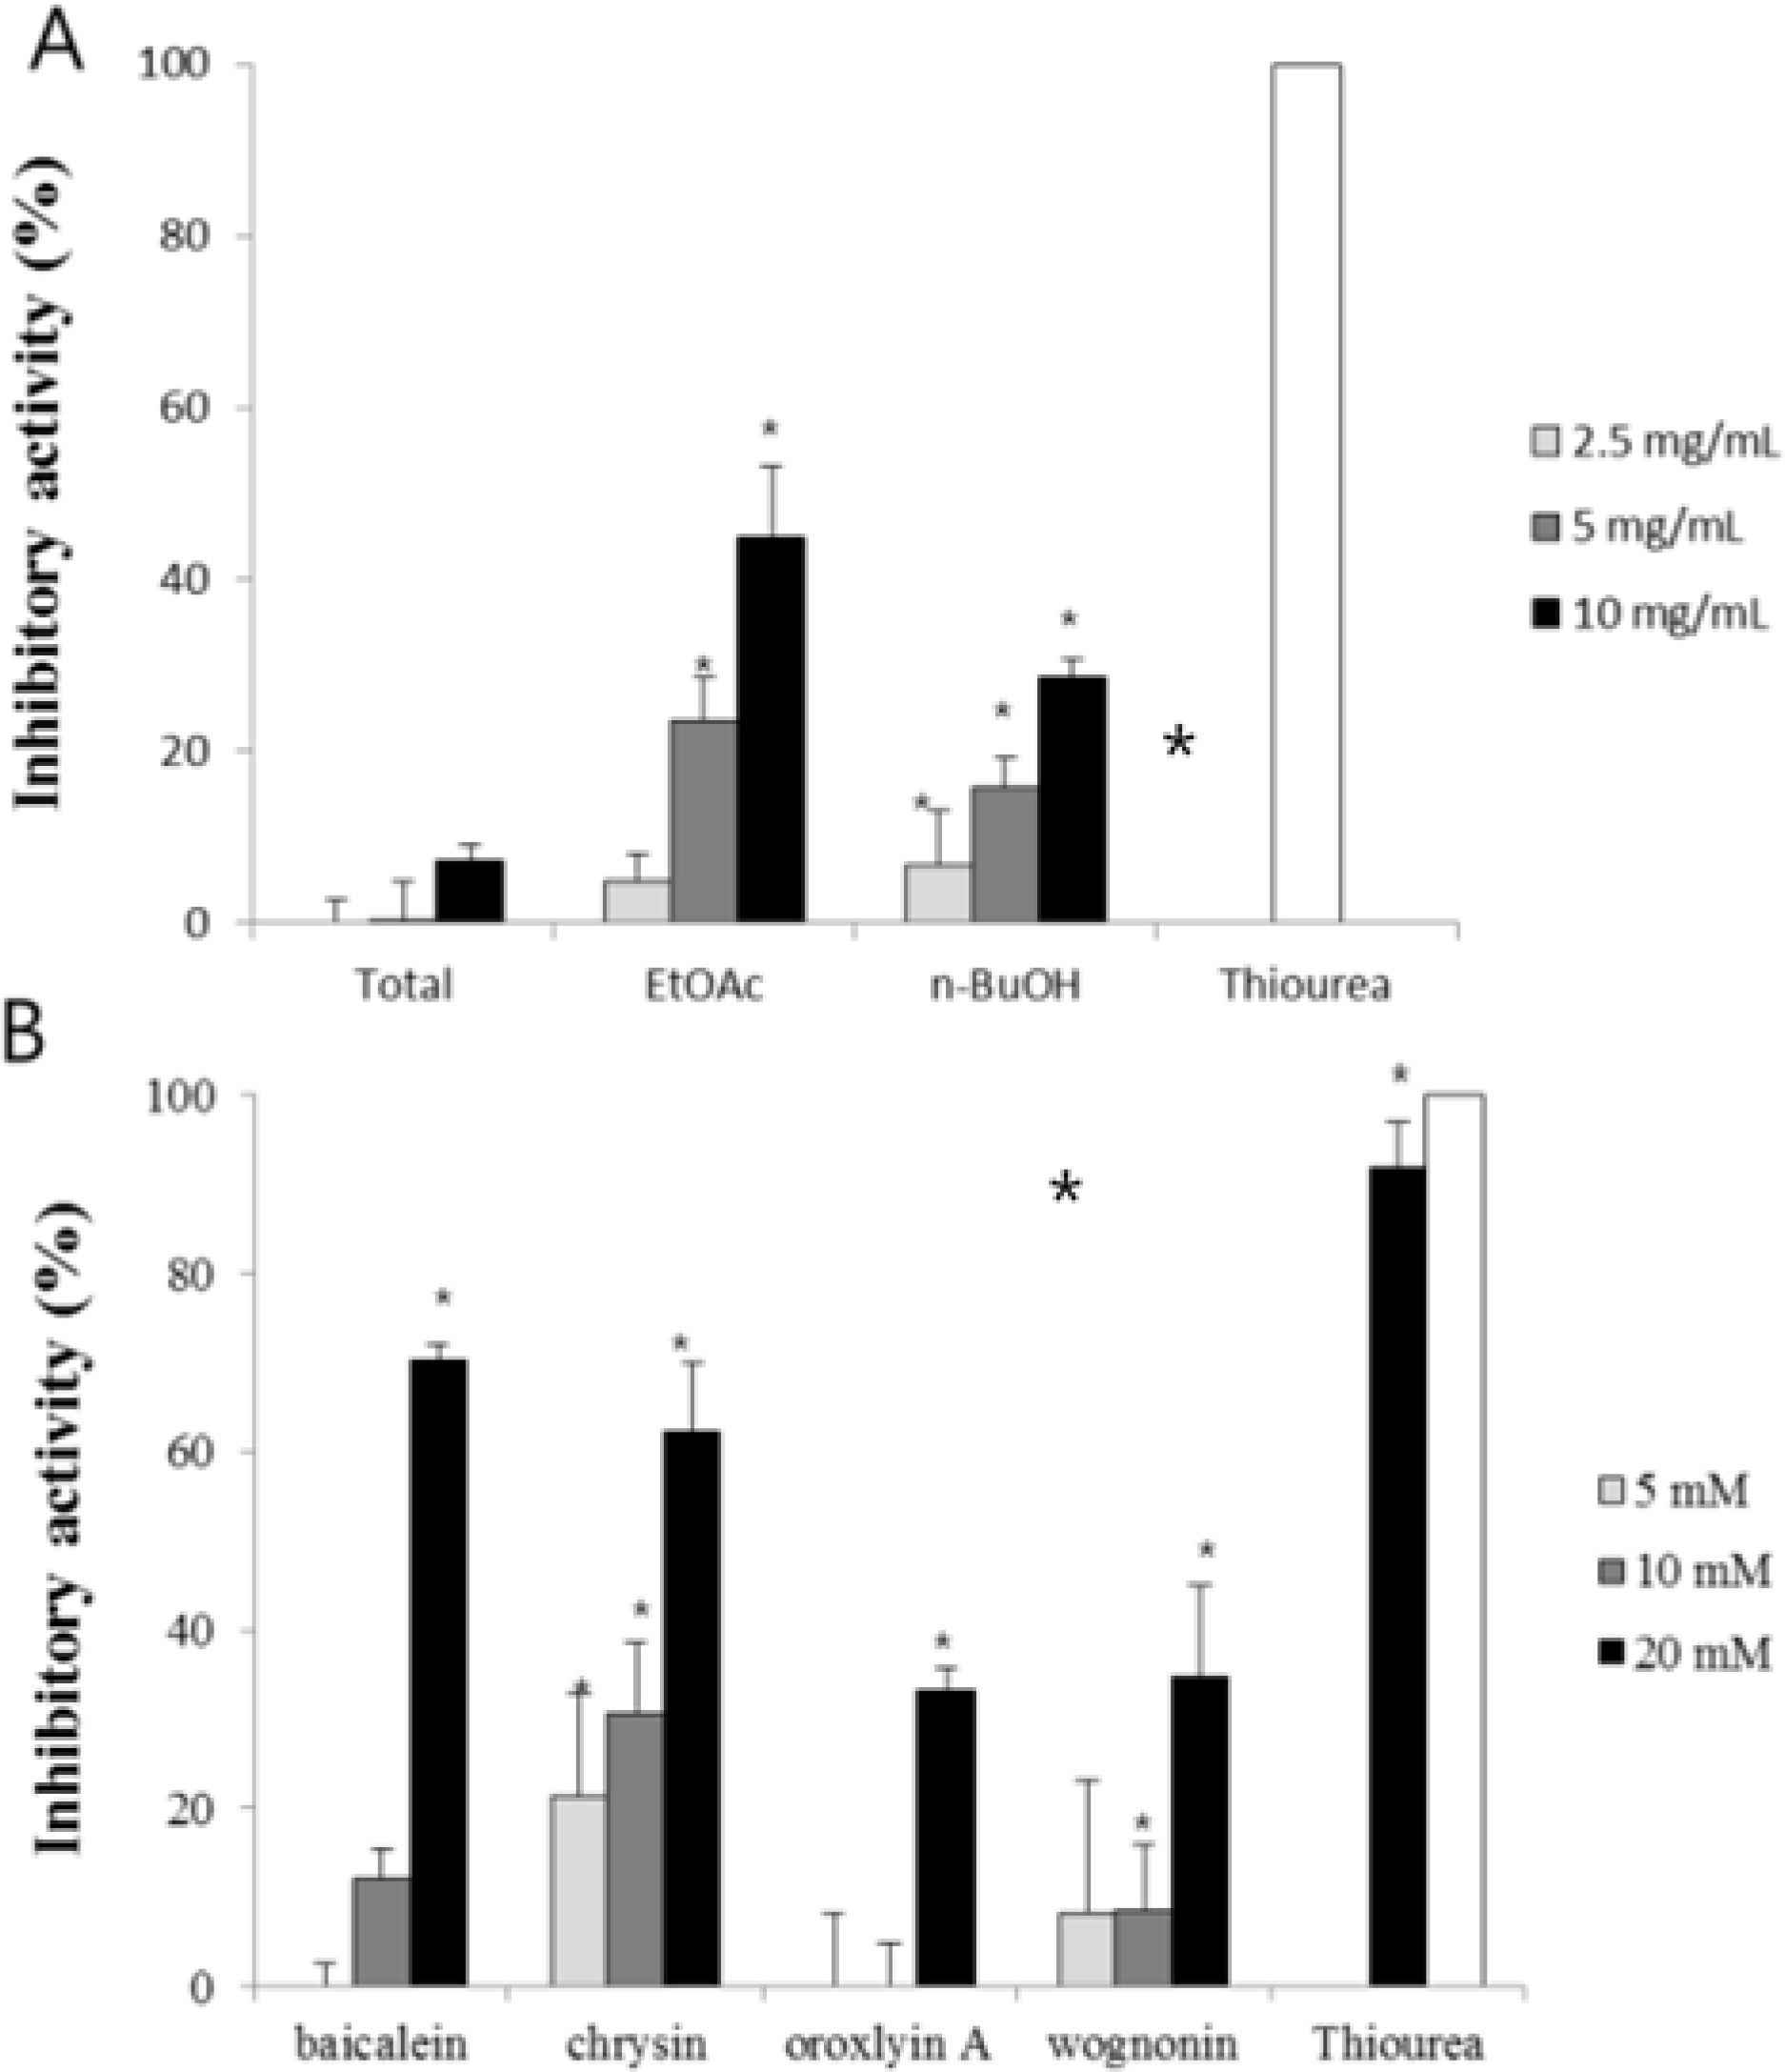 | Fig. 5.H. pylori urease inhibitory activity of fractions (A) and compounds (B) from Scutellariae Radix. Data represent the means ± SD of three replicates; ∗p < 0.05, ∗∗p < 0.01, significant difference compared to the negative control. |
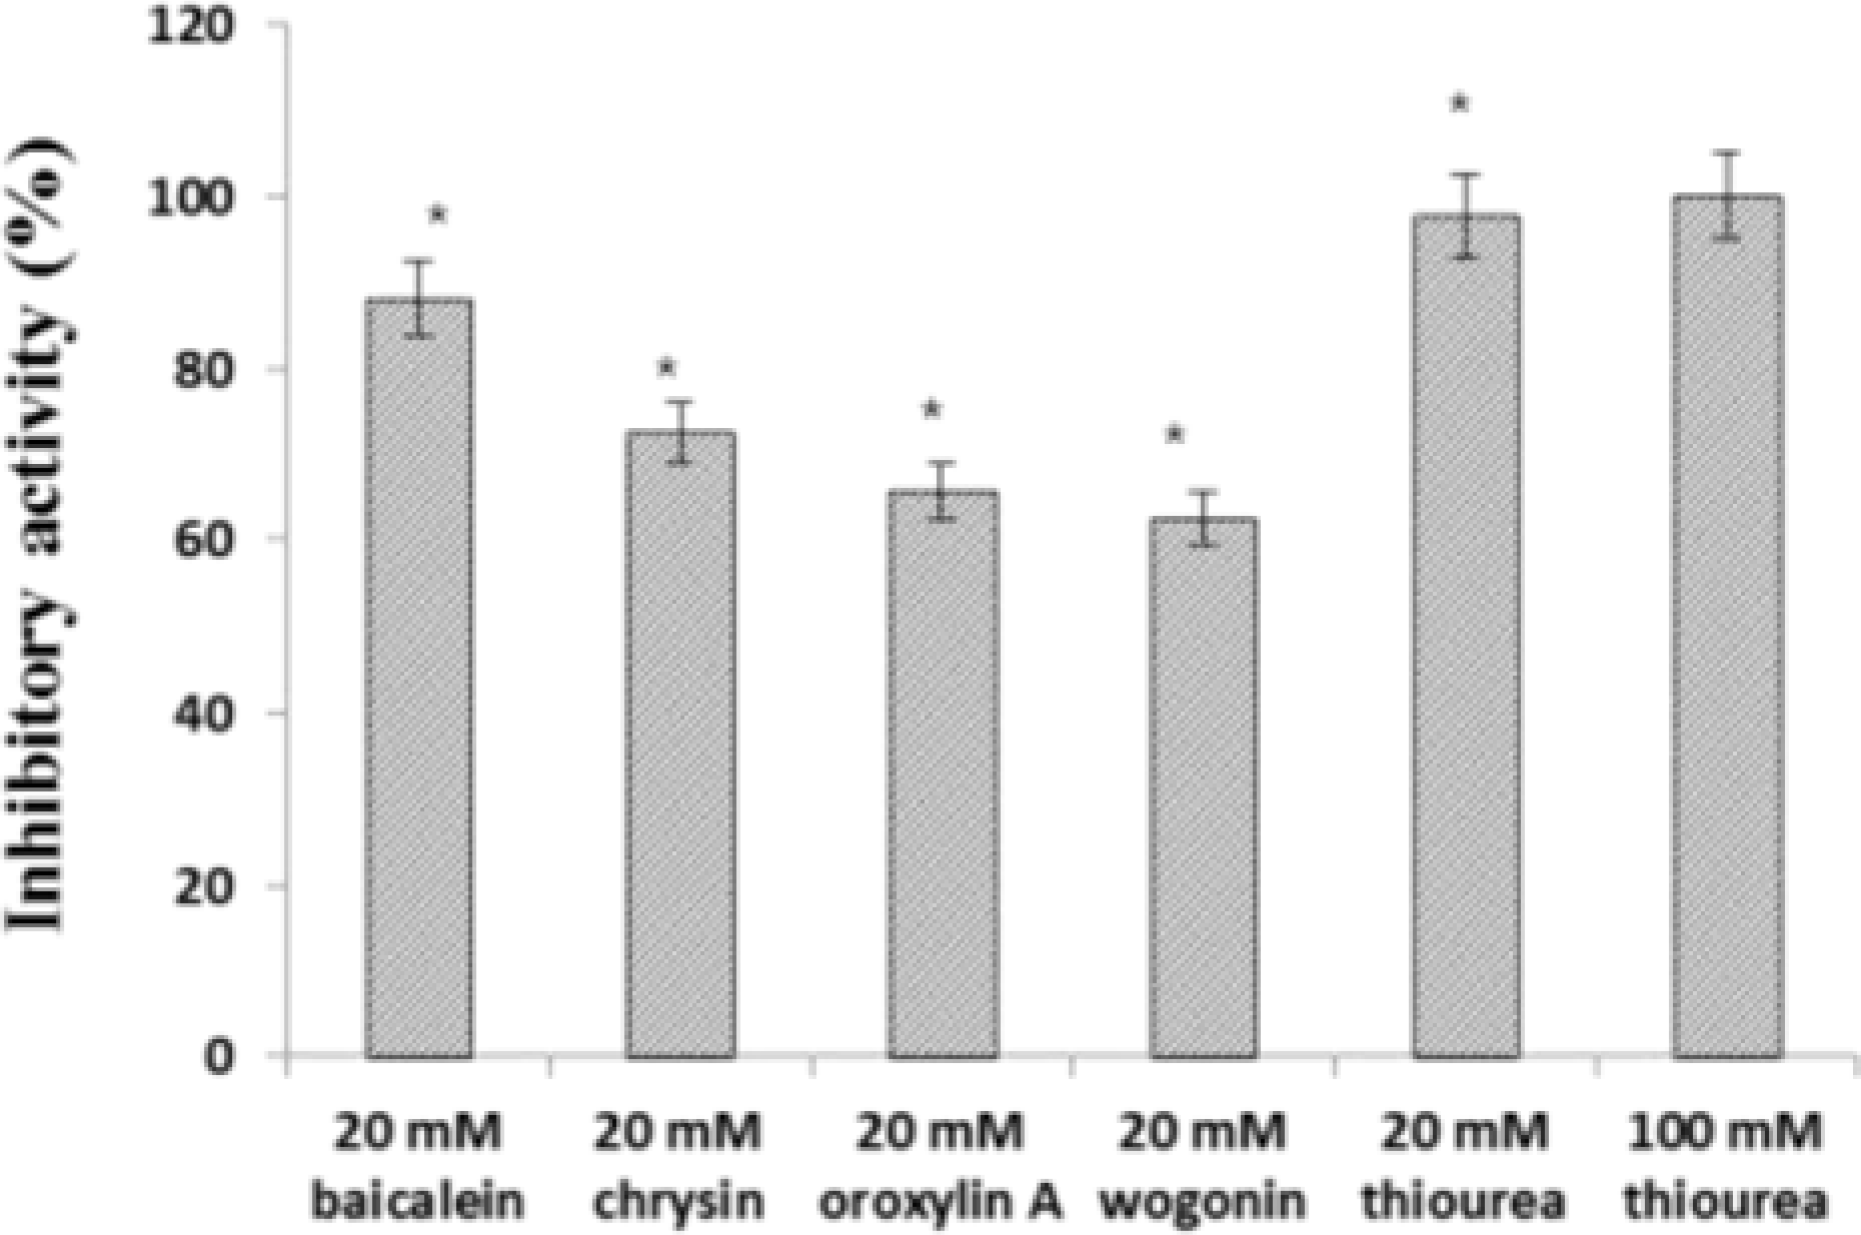 | Fig. 6.Jack bean urease inhibitory activity of four compounds from Scutellariae Radix. Data represent the means ± SD of three replicates; ∗p < 0.05, ∗∗p < 0.01, significant difference compared to the negative control. |
Table 1.
Anti-Helicobacter activity of fractions and compounds from Scutellria Radix
| Samples | H. pylori 26695 | ||
|---|---|---|---|
| MICa (µg/mL) | MBCb (µg/mL) | ||
| Total | 125 | 250 | |
| Fractions | EtOAc | 31.25 | 31.25 |
| BuOH | 125 | 125 | |
| Baicalin | >250 | >250 | |
| Baicalein | 50 | 50 | |
| Compounds | Chrysin | 6.25 | 12.5 |
| Oroxylin A | 12.5 | 25 | |
| Wogonin | 25 | 25 | |
Table 2.
Quantitative analysis of DNA protective effect of fractions and compounds from Scutellria Radix
| Groups | 1 | 2 | 3 | 4 | 5 | 6 | 7 |
|---|---|---|---|---|---|---|---|
| Fractions | 1a | 0.523 ± 0.026 | 0.841 ± 0.047 | 0.751 ± 0.036 | 0.834 ± 0.067 | 0.864 ± 0.038 | − |
| Compounds | 1 | 0.490 ± 0.025 | 0.736 ± 0.036 | 0.637 ± 0.019 | 0.746 ± 0.046 | 0.777 ± 0.054 | 0.775 ± 0.038 |
a relative band intensity of each sample compared with control (AGS cell). 1: Control (AGS cell); 2: AGS cell + Fenton reagent; 3: AGS cell + Fenton reagent + quercetin; 4: AGS cell + Fenton reagent + total Fr./ bacalein; 5: AGS cell + Fenton reagent + EtOAc Fr./ chrysin; 6: AGS cell + Fenton reagent + n-BuOH Fr./ oroxylin A; 7: AGS cell + Fenton reagent + wogonin.
Table 3.
qRT-PCR analysis of AGS cell DNA damaged by Fenton reaction.
| DNA Samples | Compounds | Ct valuea |
|---|---|---|
| AGS cell | none | 11.437 ± 0.234 |
| AGS cell + Fenton reagents | none | 29.799 ± 0.215 |
| AGS cell + Fenton reagents | Quercetin | 12. 352 ± 0.324 |
| AGS cell + Fenton reagents | Baicalein | 20.799 ± 0.215 |
| AGS cell + Fenton reagents | Chrysin | 16. 877 ± 0.674 |
| AGS cell + Fenton reagents | Oroxylin A | 17.719 ± 0.189 |
| AGS cell + Fenton reagents | Wogonin | 14.417 ± 0.089 |


 PDF
PDF ePub
ePub Citation
 Print
Print


 XML Download