Abstract
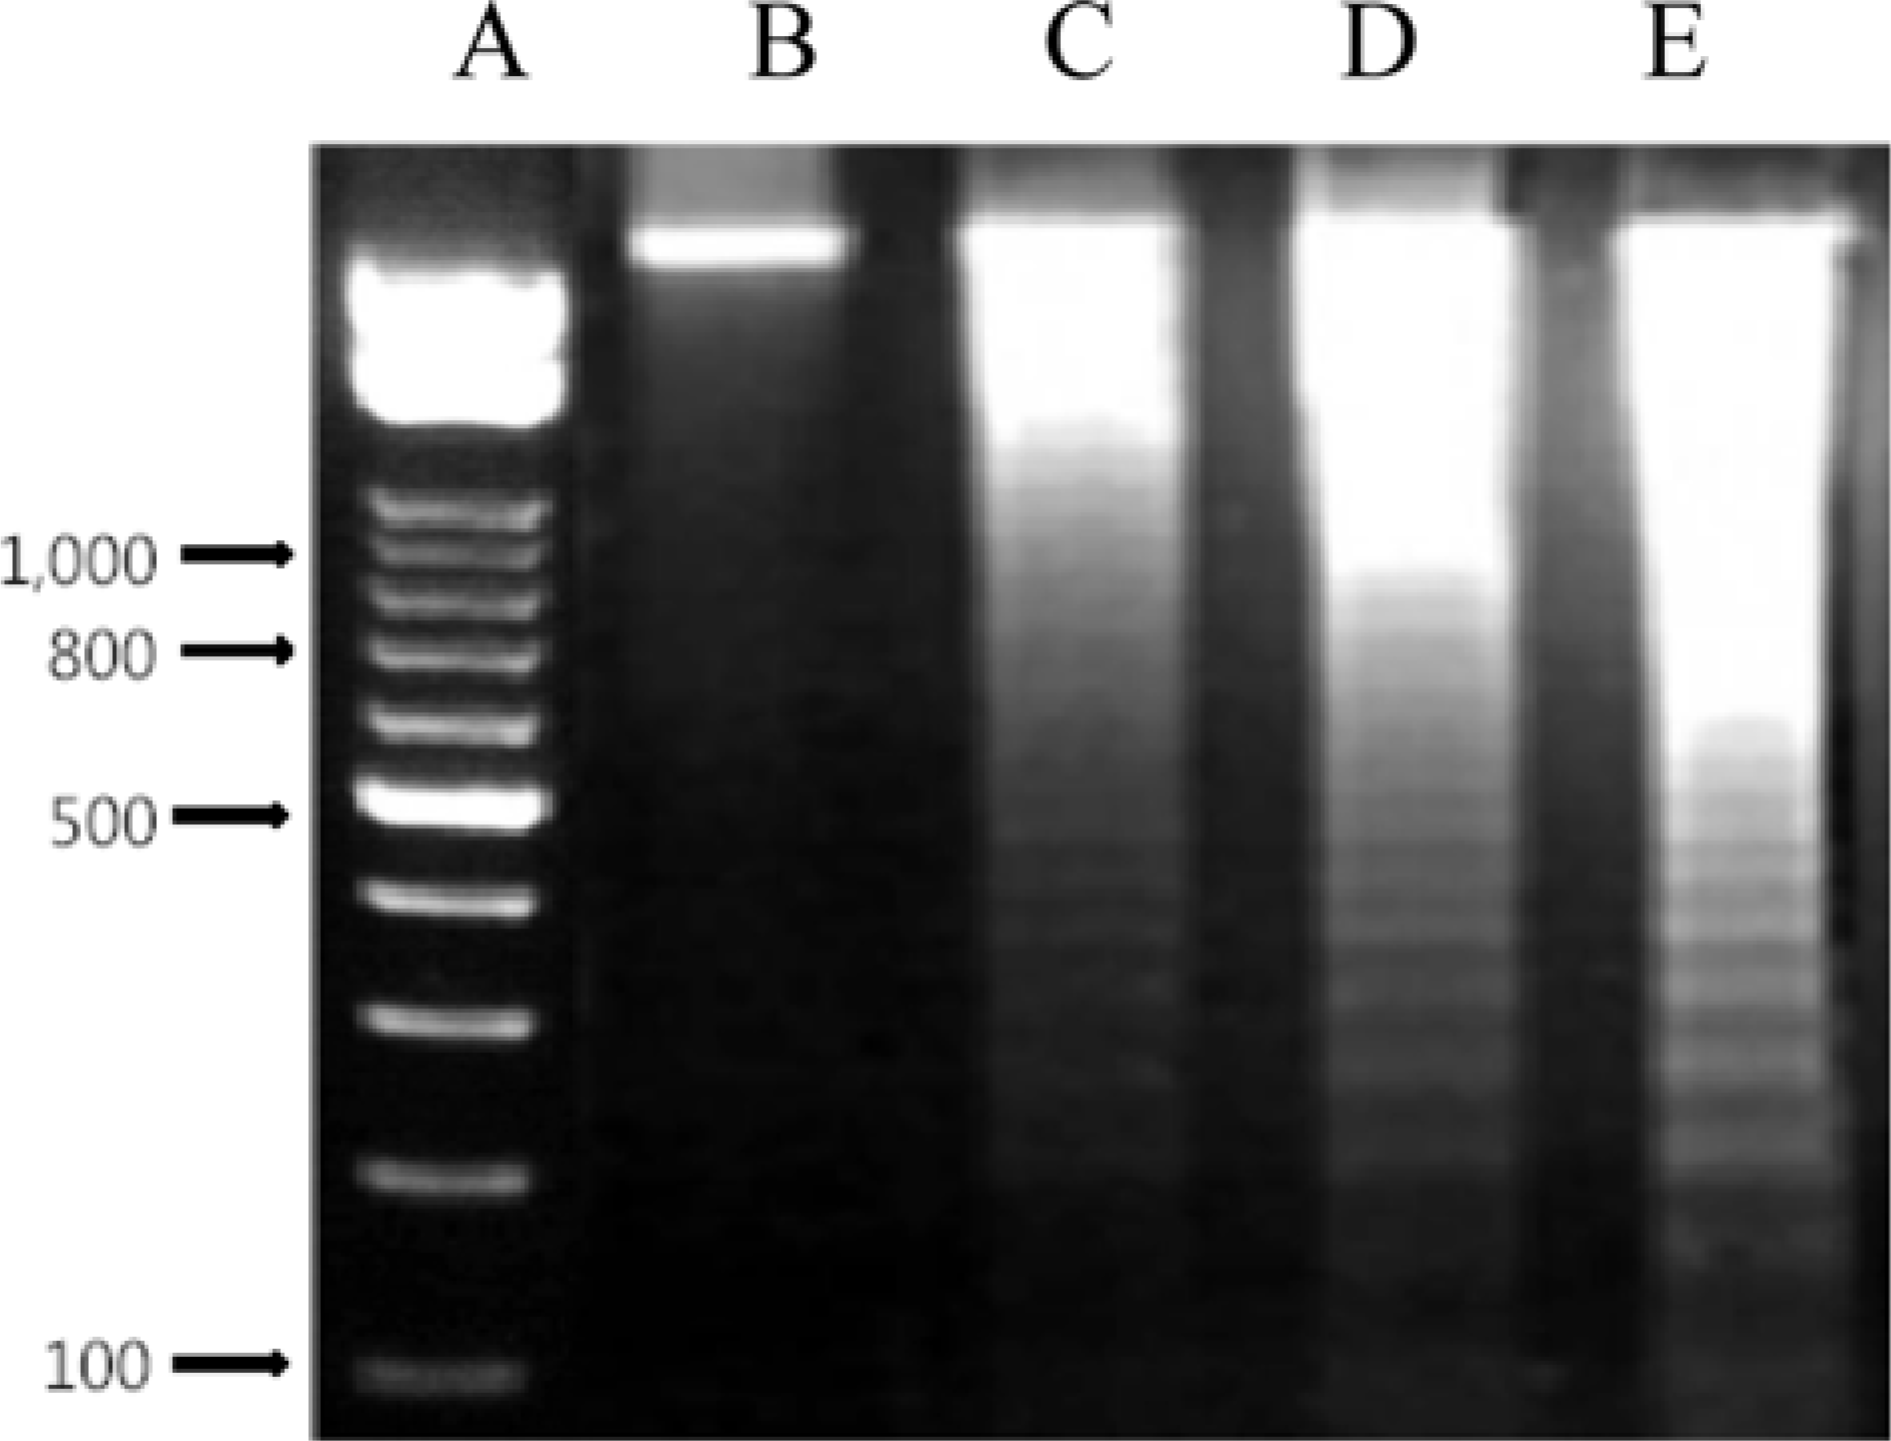
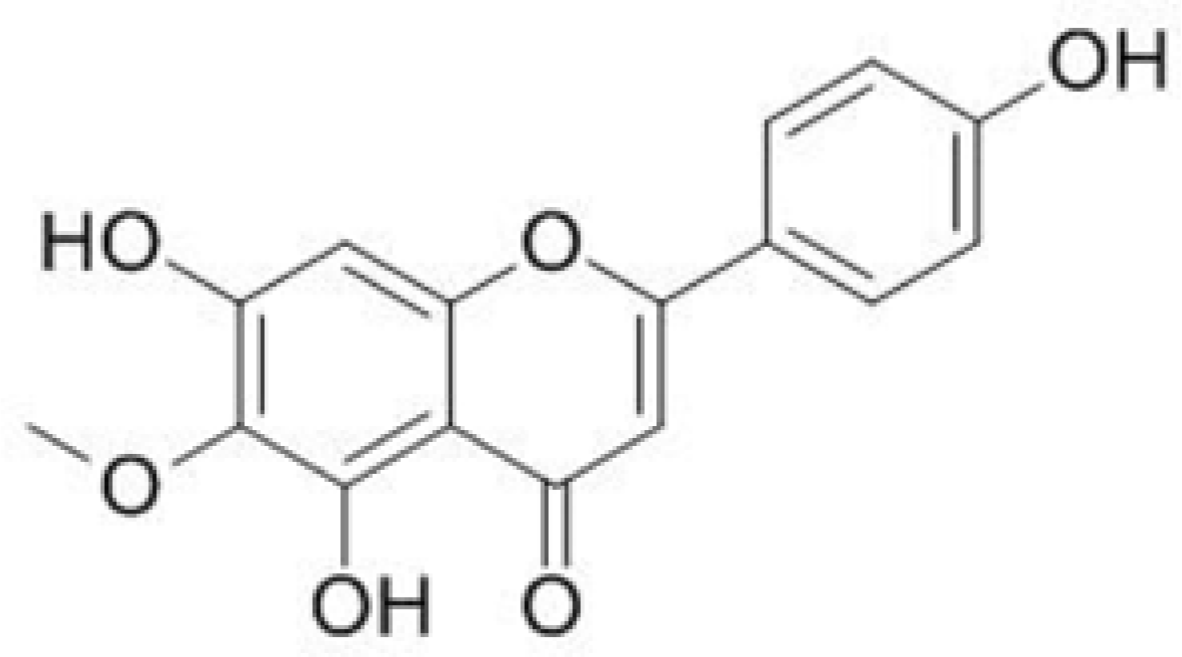
The purpose of this study was to confirm the anti-tumor activity of an ethanol extract of Saussurea laniceps against pancreatic tumor and to isolate the active compound from S. laniceps extract. Treatment with S. laniceps extract and hispidulin inhibited proliferation of pancreatic cell lines, such as Capan-1, Capan-2, Panc-1 and S2–013 in a dose-dependent manner using the hollow fiber assay. Hispidulin showed typical hallmarks of apoptotic cell death a significant anti-tumor activity on Capan-2 cells at a dose of 100 mg/kg and 200 mg/kg. S. laniceps has potential cytotoxic and apoptotic effects on human pancreatic carcinoma cells. Its mechanism of action might be associated with the apoptotic cell death through DNA fragmentation.
References
(1). Chen Q.L.., Chen X.Y.., Zhu L.., Chen H.B.., Ho H.M.., Yeung W.P.., Zhao Z.Z.., Yi T.Phytochem. Rev. 2016. 15:537–565.
(2). Li J. S.., Cai S. Q.Chin. Pharm. J. 1998. 33:449–451.
(3). Zou X. W.., Liu D.., Liu Y. P.., Xiu Z. L.., Xiao H. B.Chin. J. Nat. Med. 2015. 13:295–298.
(4). Jia J. M.., Wu C. F.., Liu W.., Yu H.., Hao Y.., Zheng J. H.., Ji Y. R.Biol. Pharm. Bull. 2005. 28:1612–1614.
(5). Min B. S.., Kim Y. H.., Lee S. M.., Jung H. J.., Lee J. S.., Na M. K.., Lee C. O.., Lee J. P.., Bae K.Arch. Pharm. Res. 2000. 23:155–158.
(6). Byambaragchaa M.., de la Cruz J.., Yang S. H.., Hwang S. G.AsianPac. J. Cancer Prev. 2013. 14:5397–5402.
(7). Byambaragchaa M.., Dela Cruz J.., Kh A.., Hwang S. G.AsianPac. J. Cancer Prev. 2014. 15:7527–7532.
(8). Casciari J. J.., Hollingshead M. G.., Alley M.C.., Mayo J. G.., Malspeis L.., Miyauchi S.., Grever M. R.., Weinstein J. N. J.Natl. Cancer Inst. 1994. 86:1846–1852.
(9). Ishiyama M.., Miyazono, Y,; Sasamoto K.., Ohkura Y.., Ueno K.Talanta. 1997. 44:1299–1305.
(10). Lee K. H.., Rhee K. H.Cancer Res. Treat. 2005. 37:196–200.
(11). Stewart B. W.., Wild C. P.World Cancer Report 2014; World Health Organization:. 2014. , Chapter 5, 7.
(12). Taraphdar A. K.., Roy M.., Bhattacharya R. K.Curr. Sci. 2001. 80:1387–1396.
(13). Yi T.., Lo H.., Zhao Z.., Yu Z.., Yang Z.., Chen H.Molecules. 2012. 17:7183–7194.
(14). Yu C. Y.., Su K. Y.., Lee P. L.., Jhan J. Y.., Tsao P. H.., Chan D. C.., Chen Y. L.Evid. Based Complement. Alternat. Med. 2013. 2013:1–13.
Fig. 3.
Effect of Hispidulin on DNA fragmentation of Capan-2 cells. (A) Ladder marker; (B) Control; (C) 2 µg/mL of Hispidulin; (D) 10 µg/mL of Hispidulin; (E) 2 µg/mL of Gemicitabine.

Table 1.
Anti-tumor activity of the extract and chromatographic fractions isolated from S. laniceps using CCK-8 assay
| Sample | Dose (µg/mL) | Capan-1 | Capan-2 | Panc-1 | S2–013 |
|---|---|---|---|---|---|
| 10 | 50 ± 0 | 50 ± 0 | 50 ± 0 | 50 ± 0 | |
| SLE | 100 | 27 ± 3∗ | 31 ± 4∗b | 21 ± 5 | 14 ± 5 |
| 500 | 42 ± 4∗ | 43 ± 5∗ | 39 ± 5∗ | 28 ± 4∗ | |
| Fraction A | 10 | 55 ± 1 | 56 ± 2 | 10 ± 3 | 54 ± 1 |
| Fraction B | 10 | 12 ± 5 | 55 ± 3 | 10 ± 3 | 19 ± 6 |
| Fraction C | 10 | 54 ± 1 | 53 ± 1 | 53 ± 1 | 55 ± 1 |
| Fraction D | 10 | 50 ± 0 | 50 ± 0 | 50 ± 0 | 50 ± 0 |
| Fraction E | 10 | 50 ± 0 | 50 ± 0 | 50 ± 0 | 50 ± 0 |
| Fraction F | 10 | 21 ± 7 | 50 ± 0 | 50 ± 0 | 50 ± 0 |
| Fraction G | 10 | 18 ± 5 | 20 ± 8 | 30 ± 8 | 20 ± 7 |
| Fraction H | 10 | 47 ± 3∗ | 59 ± 5∗ | 40 ± 4∗ | 32 ± 3∗ |
| Fraction I | 10 | 50 ± 0 | 50 ± 0 | 50 ± 0 | 50 ± 0 |
| Fraction J | 10 | 50 ± 0 | 50 ± 0 | 50 ± 0 | 50 ± 0 |
| Hispidulin | 10 | 24 ± 3∗ | 52 ± 7∗ | 24 ± 8 | 39 ± 7∗ |
Table 2.
Anti-pancreatic effect of Hispidulin and Fraction H isolated from S. laniceps against pancreatic tumor cell lines
| Sample | Dose (µg/kg) | Capan-1 | Capan-2 | Panc-1 | S2–013 |
|---|---|---|---|---|---|
| 20 | 50 ± 0 | 54 ± 1 | 54 ± 2 | 55 ± 2 | |
| Fraction H | 200 | 14 ± 6 | 22 ± 5∗a | 19 ± 6 | 20 ± 5 |
| 500 | 35 ± 4∗ | 55 ± 5∗ | 30 ± 4a | 20 ± 7 | |
| 50 | 55 ± 2 | 17 ± 6 | 14 ± 5 | 20 ± 8 | |
| Hispidulin | 100 | 17 ± 6 | 44 ± 3∗ | 31 ± 3∗ | 29 ± 3∗a |
| 200 | 52 ± 5∗ | 73 ± 4∗ | 40 ± 5∗ | 45 ± 7∗ |


 PDF
PDF ePub
ePub Citation
 Print
Print


 XML Download