Abstract
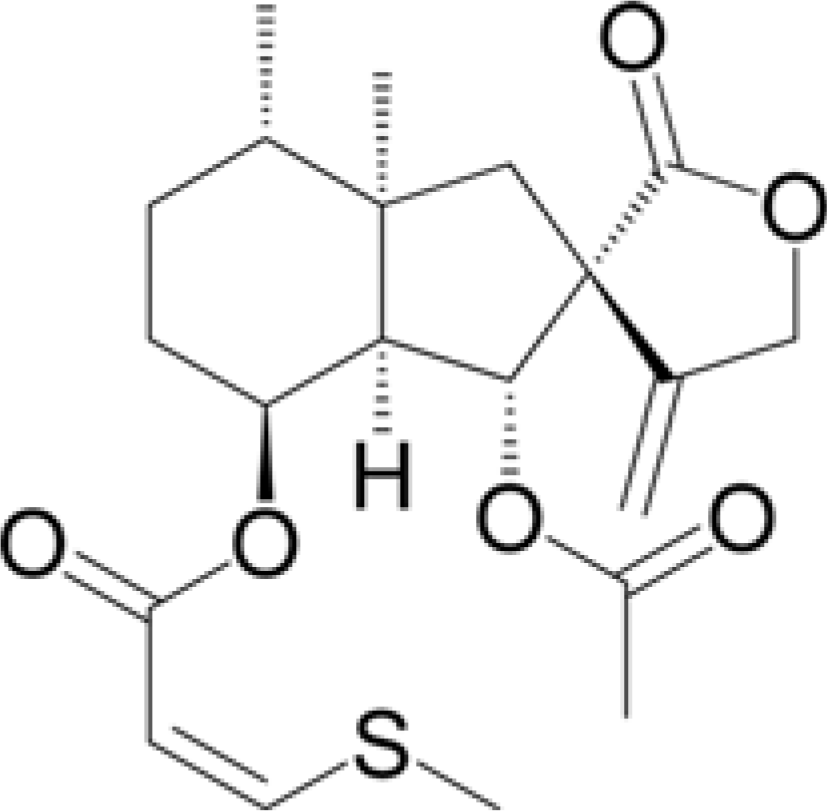
A quantitative analysis of bakkenolide D in the different parts of Petasites japonicus and Farfugium japonicum was performed by HPLC. A gradient HPLC elution system with a mobile phase consisting of water: acetonitrile solution (20:80 to 0:100 for 45 min) was followed and an INNO C18 column was used for the chromatographic separation. The injection volume, flow rate, and UV detection were 10 µL, 1 mL/min, and 290 nm, respectively. Results show that both species showed the highest amount of bakkenolide D in the roots being 107.203 and 166.103 mg/g for P. japonicas and F. japonicum, respectively. Content analysis on the different parts of both plants displayed remarkably lower values which ranged from 0.403 – 4.419 and 7.252 – 32.614 mg/g for P. japonicas and F. japonicum, respectively. The results show that the roots of both plants are rich in bakkenolide D showing a promising use in the development of nutraceuticals and industrial application of the compound.
References
(1). Sok D. E.., Oh S. H.., Kim Y. B.., Kang H. G.., Kim M. R.Eur. J. Nutr. 2006. 45:61–69.
(2). Sugama K.., Hayashi K.., Mitsuhashi H.Phytochemistry. 1985. 24:1531–1535.
(3). Okuno H.., Nakata M.., Mii M.Chromosome Sci. 2009. 12:27–33.
(4). Zhao J. H.., Shen T.., Yang X.., Zhao H.., Li X.., Xie W. D.Arch. Pharm. Res. 2012. 35:1153–1158.
(5). Aydin A. A.., Zerbes V.., Parlar H.., Letzel T. J.Pharm. Biomed. Anal. 2013. 75:220–229.
(7). Kim, J. Y; Oh T. H.., Kim B. J.., Kim S. S.., Lee N. H.., Hyun C. G. J.Oleo Sci. 2008. 57:623–628.
(8). Lee K. P.., Kang S.., Park S. J.., Choi Y. W.., Lee Y. G.., Im D. S. J.Ethnopharmacol. 2013. 148:890–894.
(9). Wang S.., Jin D. Q.., Xie C.., Wang H.., Wang M.., Xu J.., Guo Y.Food Chem. 2013. 141:2075–2082.
(10). Nagano H.., Moriyama Y.., Tanahashi Y.., Takahashi T.Chem. Lett. 1972. 1:13–16.
(11). Hatanaka A.., Kajiwara T.., Sekiya J.., Hirata H.Agr. Biol. Chem. 1976. 40:2177–2180.
(12). Niwa H.., Ishiwata H.., Yamada K. J.Nat. Prod. 1985. 48:1003–1004.
(13). Tori M.., Otose K.., Fukuyama H.., Murata J.., Shiotani Y.., Takaoka S.., Nakashima K.., Sono M.., Tanaka M.Tetrahedron. 2010. 66:5235–5243.
(14). Evans D. A.., Sims C. L.Tetrahedron Lett. 1973. 47:4691–4694.
(15). Kim T. H.., Kim D. Y.., Jung W. J.., Nagairya R.., Son B. G.., Park Y. H.., Kang J. S.., Lee Y. J.., Im D. S.., Lee Y. G.., Choi Y. H.., Choi Y. I. J.Life Sci. 2014. 24:252–259.
(16). Wang Y.., Guo M.., Zhang G.., Xue Q.Acad.J. Sec. Mil. Med. Univ. 2006. 27:1210–1213.
(17). Wu T. S.., Kao M. S.., Wu P. L.., Lin F. W.., Shi L. S.., Liou M. J.., Li C. Y.Chem. Pharm. Bull. 1999. 47:375–382.
(18). Wang Y. L.., Guo M.., Wang Y.Chromatographia. 2009. 70:1367–1371.
(19). He J.., Wang Q.., Wang Y.., Chen R.., Zhang Y.., Guo M.Acta Pharm. Sin. B. 2013. 3:354–360.
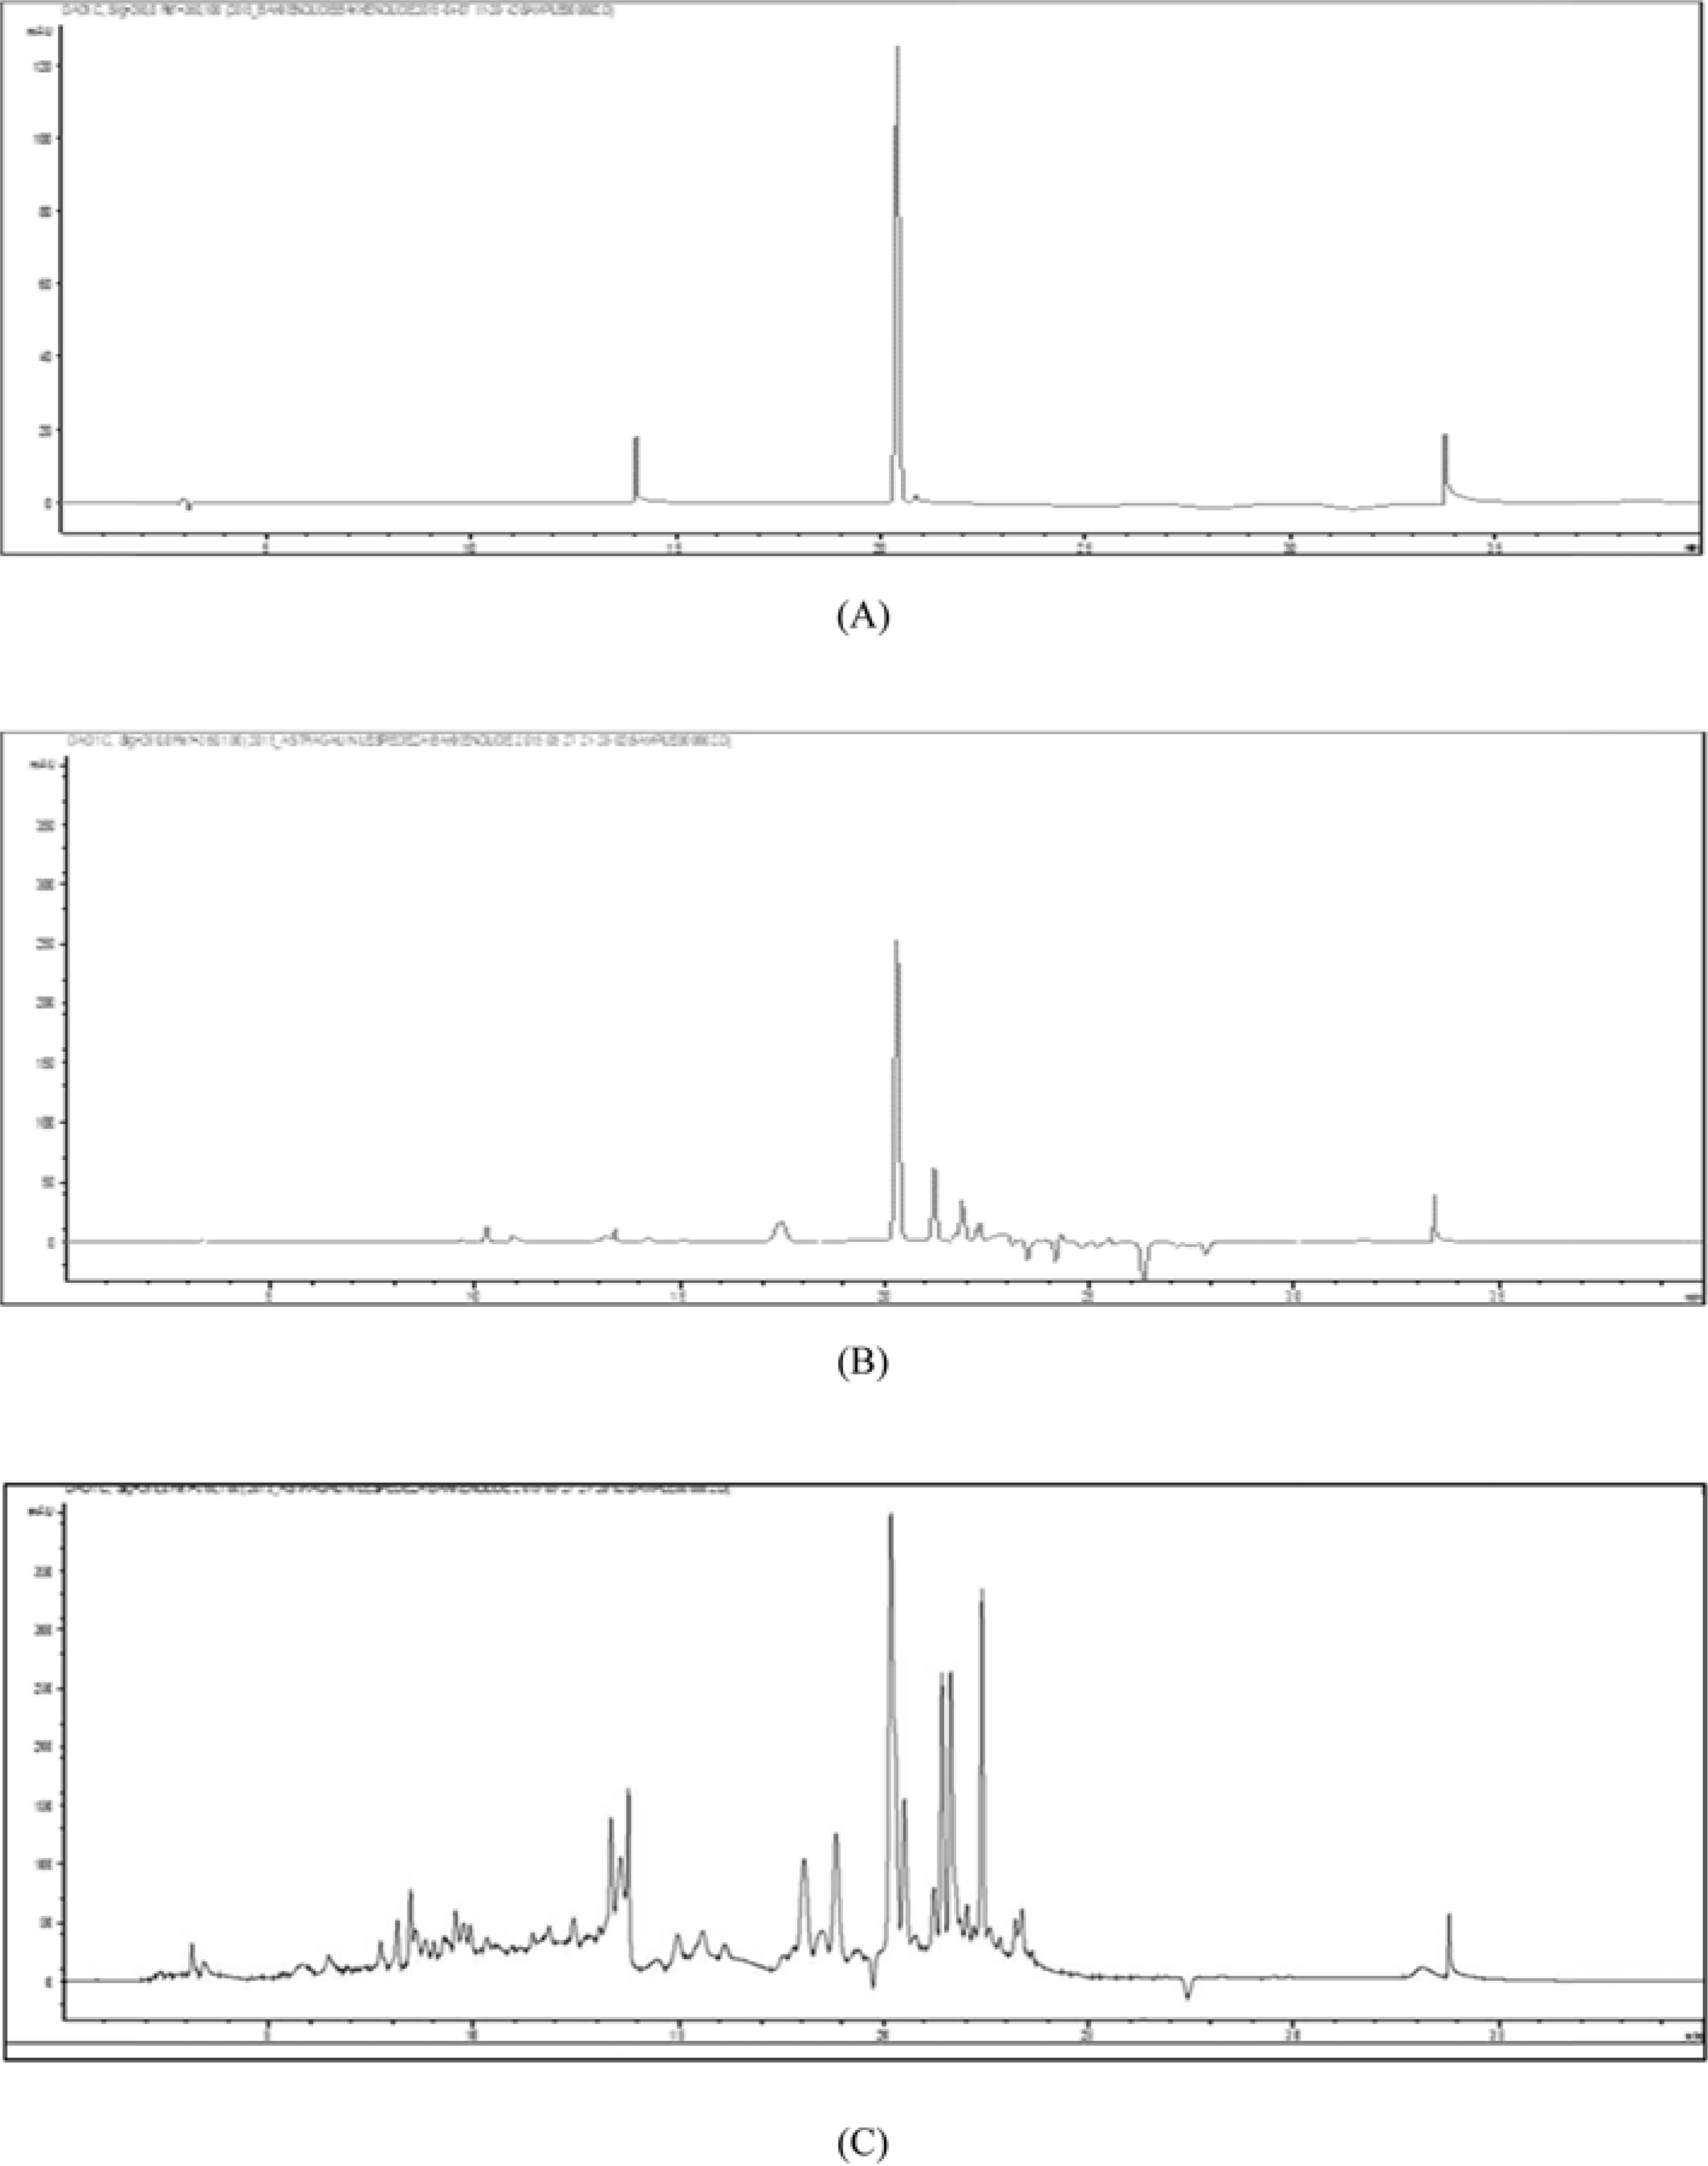
Fig. 2.
HPLC chromatograms of bakkenolide D (A) and the MeOH extracts of P. japonicus (B) and F. japonicum (C).

Table 1.
1H- and13C-NMR spectral data for bakkenolide D in CDCl3
Table 2.
LOD and LOQ values of bakkenolide D
| Compound | Regression equation | r2 | Linear range (mg/mL) | LOD (mg/mL) | LOQ (mg/mL) |
|---|---|---|---|---|---|
| Bakkenolide D | Y = 124.2X + 0.5969 | 0.9999 | 0.006 – 0.1 | 0.0046 | 0.0136 |


 PDF
PDF ePub
ePub Citation
 Print
Print


 XML Download