Abstract
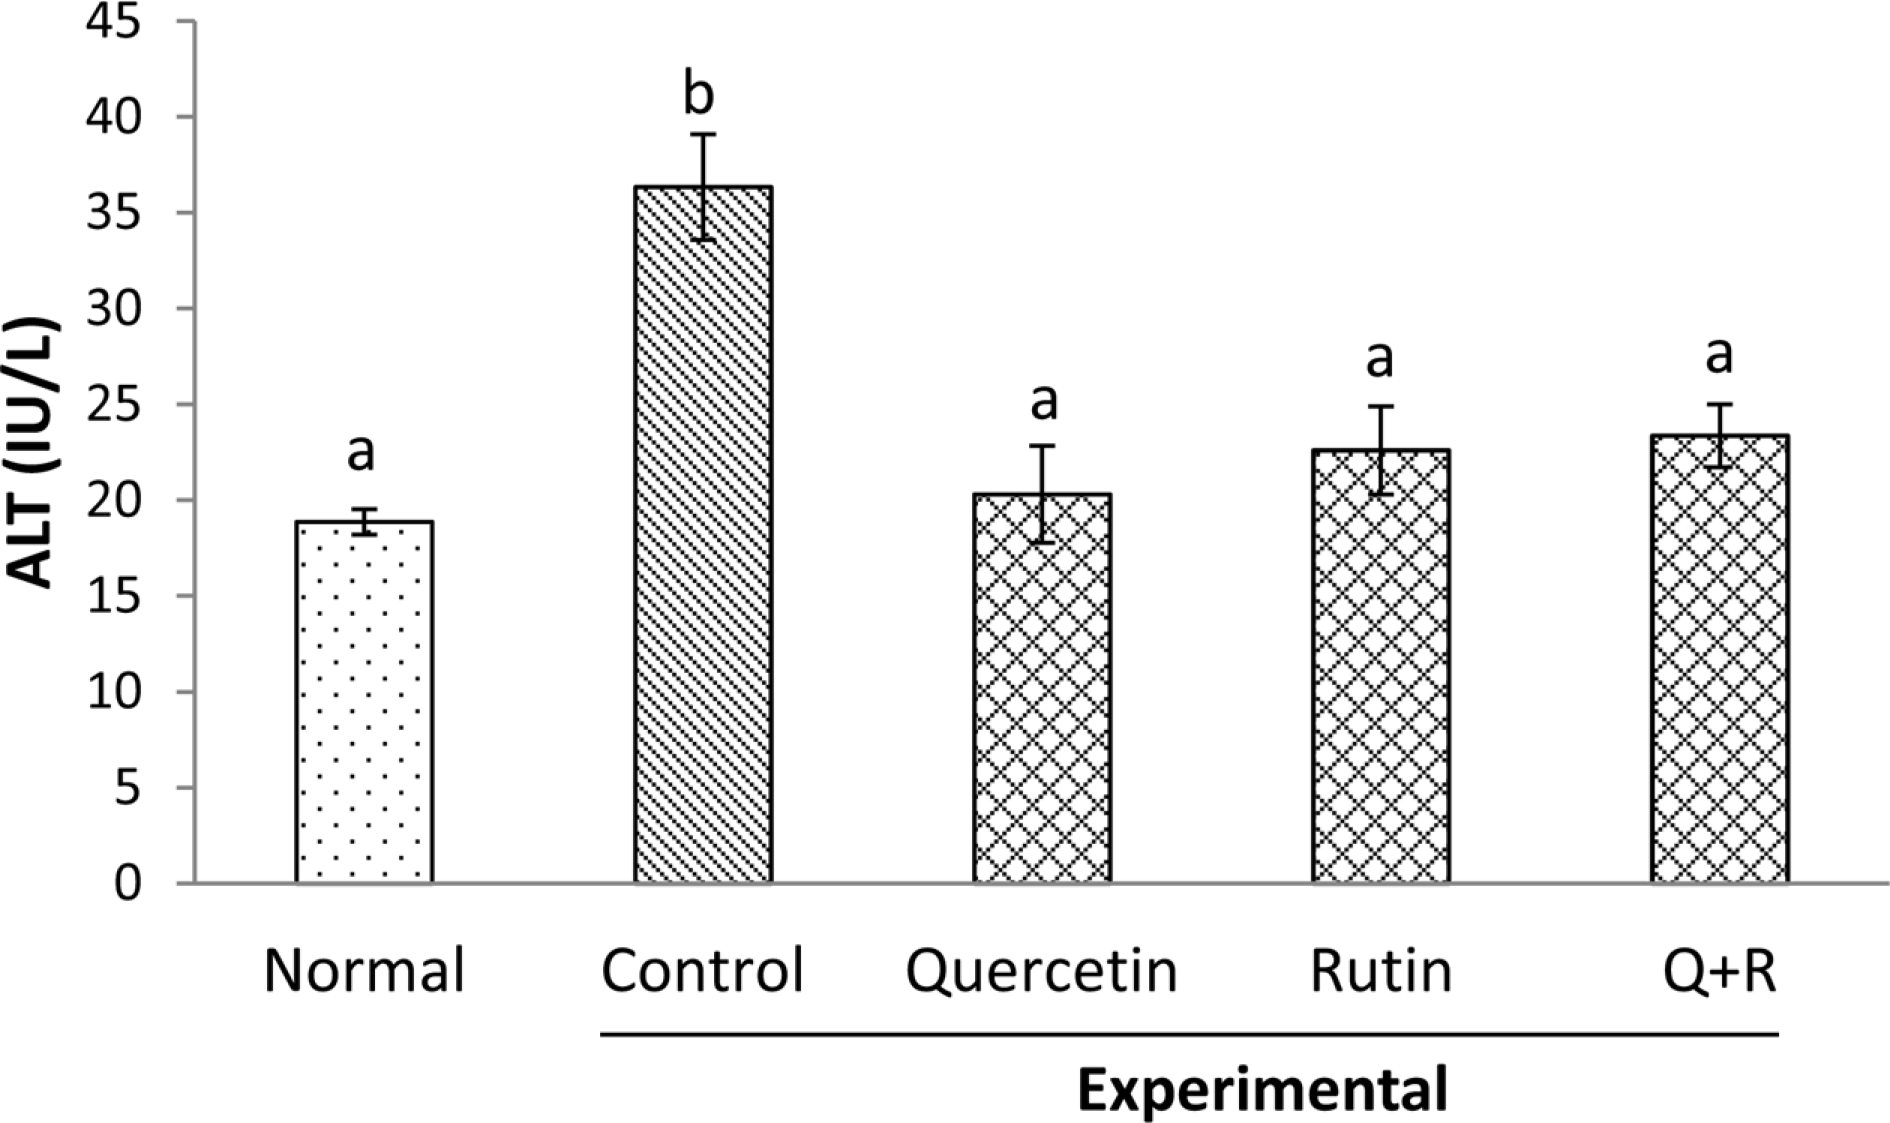
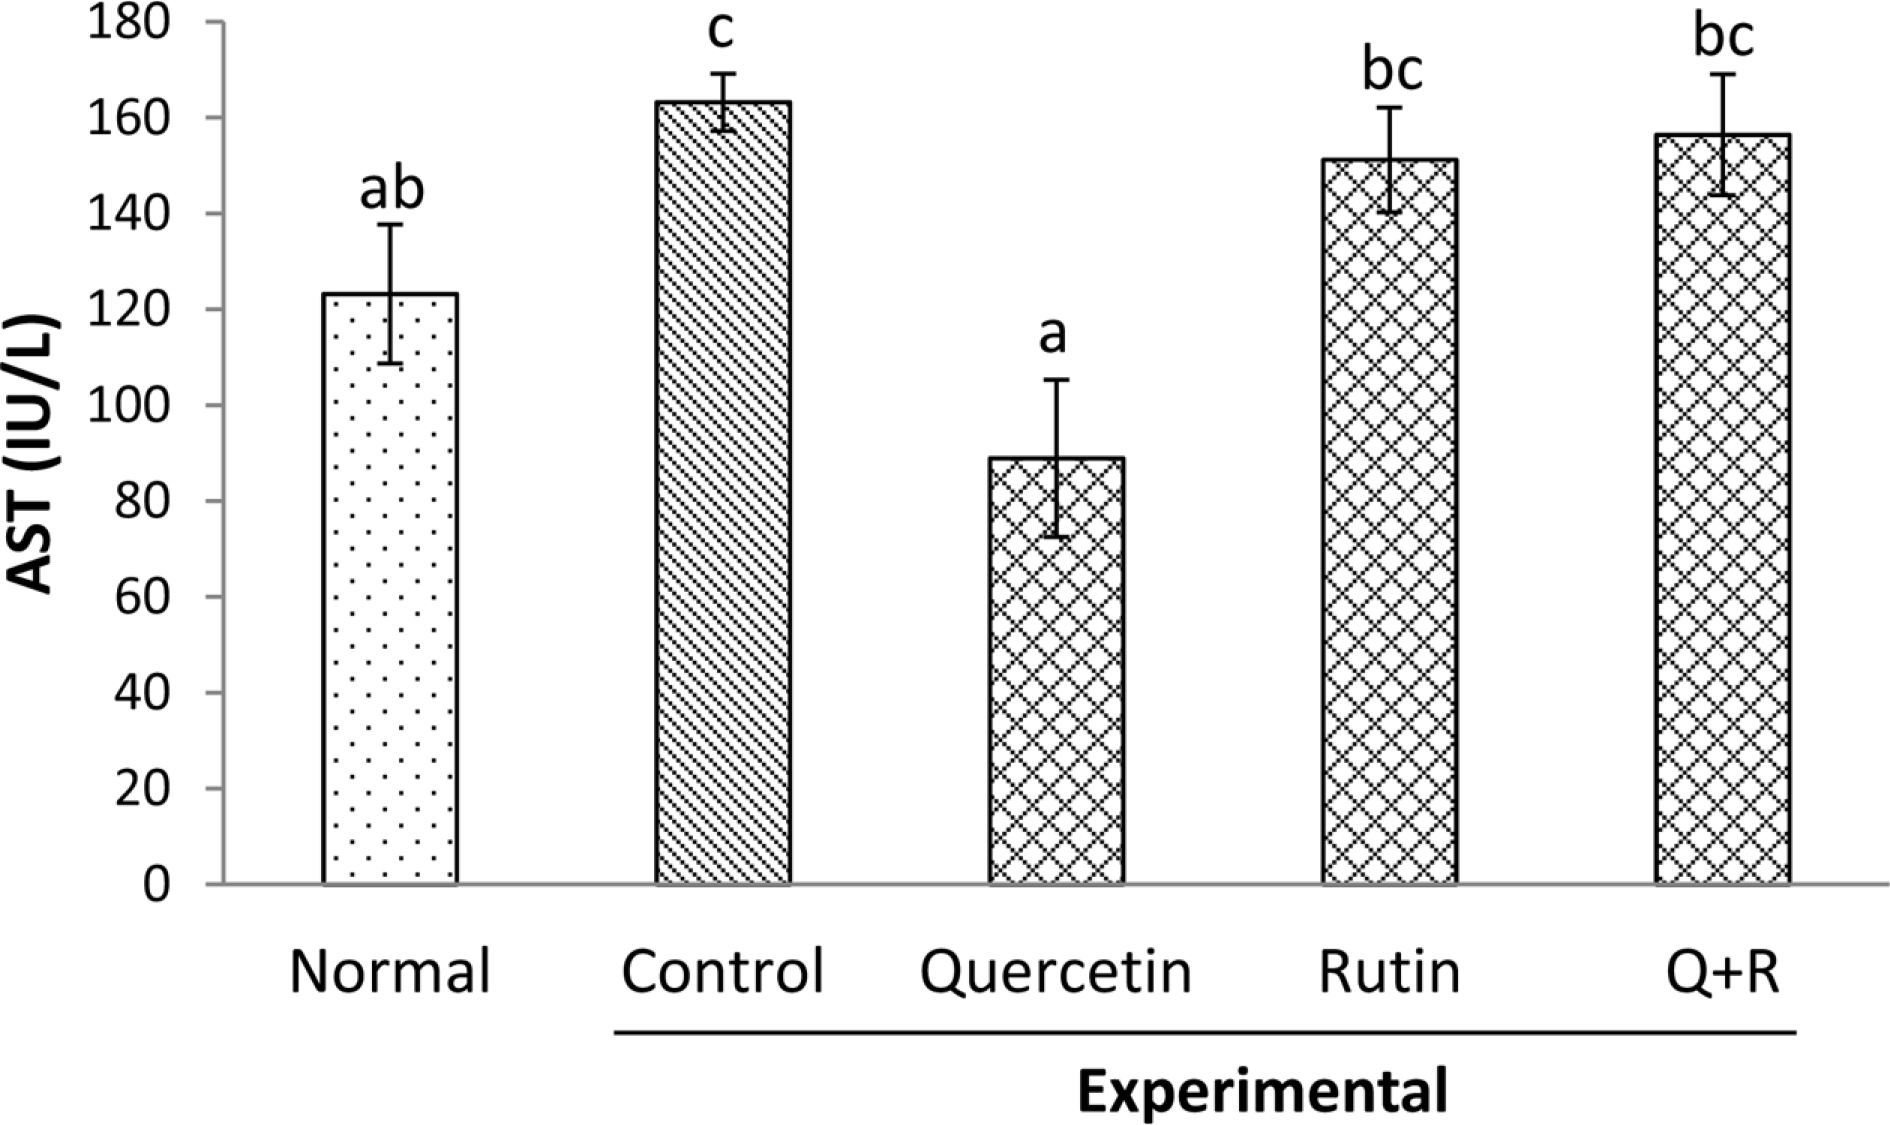
Flavonoids including quercetin and rutin are a group of naturally occurring compounds widely distributed in plants, especially in buckwheat. Thus, cereal and the leaf of the plant have increasingly used as a source of nutritional and functional foods such as noodle, cake or soup in Korea, Japan and other countries. This study investigated comparative effects of dietary rutin rich in buckwheat and its aglycone, quercetin, on serum biomarkers and antioxidant parameters in rats treated with chronic ethanol. Rats were fed with the liquid diets prepared by the method of Lieber Decarli. Serum alanine transaminase (ALT) and aspartate transaminase (AST) activities increased significantly by alcohol feeding. Dietary flavonoids including rutin, quercetin and their mixtures (1/1, v/v) decreased significantly the activities of serum ALT whereas the feeding of quercetin decreased only the activity of serum AST. The concentration of serum malondialdehydes elevated by chronic alcohol feeding decreased markedly in all the experimental groups that were fed with the flavonoids; however, the combined administration of quercetin or rutin, but not that of rutin or quercetin alone decreased significantly the concentration of liver malondialdehydes to the normal range in rats fed without ethanol. Our results suggested that dietary combined mixture of rutin and quercetin might be effective in ameliorating adverse responses seen in rats exposed to ethanol chronically.
Go to : 
References
(1). Nijveldt R. J.., van Nood E.., van Hoorn D. E.., Boelens P. G.., van Norren K.., van Leeuwen P. A.Am. J. Clin. Nutr. 2001. 74:418–425.
(2). Romano B.., Pagano E.., Montanaro V.., Fortunato A. L.., Milic N.., Borrelli F.Phytother. Res. 2013. 27:1588–1596.
(3). Boots A. W.., Haenen G. R.., Bast A.Eur. J. Pharmacol. 2008. 585:325–337.
(4). Kovalskii I. V.., Krasnyuk I. I.., krasnyuk Jr. I. I.., Nikulina O. I.., Belyatskaya A. V.., Kharitonov Yu. Ya.., Feldman N. B.., Lutsenko S. V.Pharmaceutical Chem. J. 2014. 48:73–76.
(5). Crespy V.., Morand C.., Besson C.., Monach C.., Demigne C.., Remesy C. J.Agric. Food Chem. 2002. 50:618–621.
(6). Scalbert A.., Morand C.., Monach C.., Rémésy C.Biomed. Pharmacother. 2002. 56:276–282.
(7). Carbonaro, M; Grant G.Ann. Nutr. Metab. 2005. 49:178–182.
(8). Nordmann R.., Ribière C.., Rouach H.Free Radic. Biol. Med. 1992. 12:219–240.
(9). Tang Y.., Gao C.., Xing M.., Li Y.., Zhu L.., Wang D.., Yang X.., Liu L.., Yao P.Food Chem. Toxicol. 2012. 50:1194–1200.
(10). Shenbagam M.., Nalini N.Fundam. Clin. Pharmacol. 2011. 25:493–502.
(11). Botros M.., Sikaris K.A.Clin. Biochem. Rev. 2013. 34:117–130.
(12). Lieber C. S.., DeCarli L. M.Alcohol Alcohol. 1989. 24:197–211.
(13). Carr T. P.., Andersen C. J.., Rudel L. L.Clin. Biochem. 1993. 26:39–42.
(14). Yagi K.Chem. Phys. Lipids. 1987. 45:337–351.
(15). Lowry O. H.., Rosebrough N. J.., Farr A. L.., Randall R. J. J.Biol. Chem. 1951. 193:265–275.
(16). Gramenzi A.., Caputo F.., Biselli M.., Kuria F.., Loggi E.., Andreone P.., Bernardi M.Aliment Pharmacol. Ther. 2006. 24:1151–1161.
(17). Kim M. K.., Hyun S. H.., Choung S. Y. J.Health Sci. 2006. 52:344–351.
(18). Baraona E.., Lieber C. S. J.Lipid Res. 1979. 20:289–315.
(19). Zeman F. J.In Clinical Nutrition and Dietetics (2/e): Liver disease and alcoholism; Jones, L Ed; Macmillan Publishing; U.S.A,. 1991. 517–553.
(20). Keshavarzian A.., Farhadi A.., Forsyth C. B.., Rangan J.., Jakate S.., Shaikh M.., Banan A.., Fields J. Z. J.Hepatol. 2009. 50:538–547.
(21). Nolan J. P.Hepatology. 2010. 52:1829–1835.
(22). Wang H. J.., Zakhari S.., Jung M. K.World J. Gastroenterol. 2010. 16:1304–1313.
(23). Kim, H; Kong H.., Choi B.., Yang Y.., Kim Y.., Lim M. J.., Neckers L.., Jung Y.Pharm. Res. 2005. 22:1499–1509.
(24). Vuppalanchi R.., Juluri R.., Bell L. N.., Ghabril M.., Kamendulis L.., Klaunig J. E.., Saxena R.., Agarwal D.., Johnson M. S.., Chalasani N.Am. J. Med. Sci. 2011. 342:314–317.
Go to : 
 | Fig. 1.The activities of serum ALT in rats treated with ethanol. a,b Values in a bar without superscript letters denote significant difference (p < 0.05). |
 | Fig. 2.The activities of serum AST in rats treated with ethanol. a,b,c Values in a bar without superscript letters denote significant difference (p < 0.05). |
Table 1.
Diet composition (g/L)
| Normal | Experimental | ||||
|---|---|---|---|---|---|
| Control | Quercetin | Rutin | Q+R | ||
| Casein | 41.4 | 41.4 | 41.4 | 41.4 | 41.4 |
| L-Cystine | 0.5 | 0.5 | 0.5 | 0.5 | 0.5 |
| DL-Methionine | 0.3 | 0.3 | 0.3 | 0.3 | 0.3 |
| Corn oil | 8 | 8 | 8 | 8 | 8 |
| Olive oil | 15 | 15 | 15 | 15 | 15 |
| Dextrin-maltose | 153 | 64 | 64 | 64 | 64 |
| Fiber(cellulose) | 10 | 10 | 10 | 10 | 10 |
| Xanthan gum | 3 | 3 | 3 | 3 | 3 |
| Choline bitartrate | 0.53 | 0.53 | 0.53 | 0.53 | 0.53 |
| Vitamin mix1 | 2.55 | 2.55 | 2.55 | 2.55 | 2.55 |
| Mineral mix2 | 9 | 9 | 9 | 9 | 9 |
| Ethanol3 | 0 | 48 | 48 | 48 | 48 |
| Rutin | 0 | 0 | 9 | 0 | 4.5 |
| Quercetin | 0 | 0 | 0 | 5 | 2.5 |
Table 2.
Body weight and growth parameters
| Parameters | Normal | Experimental | |||
|---|---|---|---|---|---|
| Control | Quercetin | Rutin | Q+R | ||
| Initial body weight (g) | 188 ± 5a | 199 ± 4 a | 187 ± 3 a | 188 ± 3 a | 188 ± 3 a |
| Weight gain (g) | 244 ± 12 b | 125 ± 9 a | 133 ± 14a | 136 ± 11a | 132 ± 17 a |
| Food intake (ml/days) | 110 ± 3 b | 78.1 ± 1.7 a | 85.2 ± 3.5 a | 85.8 ± 2.7 a | 87.4 ± 3.2 a |
| FER | 0.054 ± 0.001 b | 0.039 ± 0.002a | 0.038 ± 0.003a | 0.038 ± 0.002 a | 0.036 ± 0.003 a |
| Relative liver weight (g/100g BW) | 2.73 ± 0.08 a | 2.92 ± 0.05 ab | 3.0 ± 0.1 bc | 3.24 ± 0.06 c | 3.16 ± 0.10 c |
Table 3.
The concentration of serum lipids
| Normal | Experimental | ||||
|---|---|---|---|---|---|
| Control | Quercetin | Rutin | Q+R | ||
| TC (mg/dL) | 52.2 ± 2.6a | 69.5 ± 4.8b | 63.0 ± 3.8b | 50.8 ± 1.9a | 64.3 ± 3.5b |
| HDL-C (mg/dL) | 33.2 ± 1.3ab | 39.6 ± 3.3b | 32.3 ± 2.1ab | 27.8 ± 2.1 a | 28.5 ± 1.8a |
| HDL-C/TC (%) | 63.9 ± 2.5c | 55.5 ± 2.5b | 54.7 ± 3.4b | 51.3 ± 0.9ab | 45.0 ± 3.6a |
| TG (mg/dL) | 100 ± 20 a | 76.9 ± 10.1 a | 84.7 ± 8.1 a | 79.8 ± 6.9 a | 73.3 ± 6.0 a |
| NEFA (mEq/L) | 1188 ± 45 a | 1265 ± 127 a | 1072 ± 171 a | 1192 ± 124 a | 894 ± 146 a |
Table 4.
The concentration of hepatic lipids
| Normal | Experimental | ||||
|---|---|---|---|---|---|
| Control | Quercetin | Rutin | Q+R | ||
| Cholesterol (mg/g) | 55.7 ± 0.5a | 11.0 ± 1.9b | 59.0 ± 1.3ab | 59.1 ± 1.5ab | 59.7 ± 2.2ab |
| Triacylglycerol (mg/g) | 60.4 ± 7.2a | 66.8 ± 8.1a | 57.7 ± 10.8a | 54.6 ± 10.3a | 52.1 ± 10.9a |


 PDF
PDF ePub
ePub Citation
 Print
Print


 XML Download