Abstract
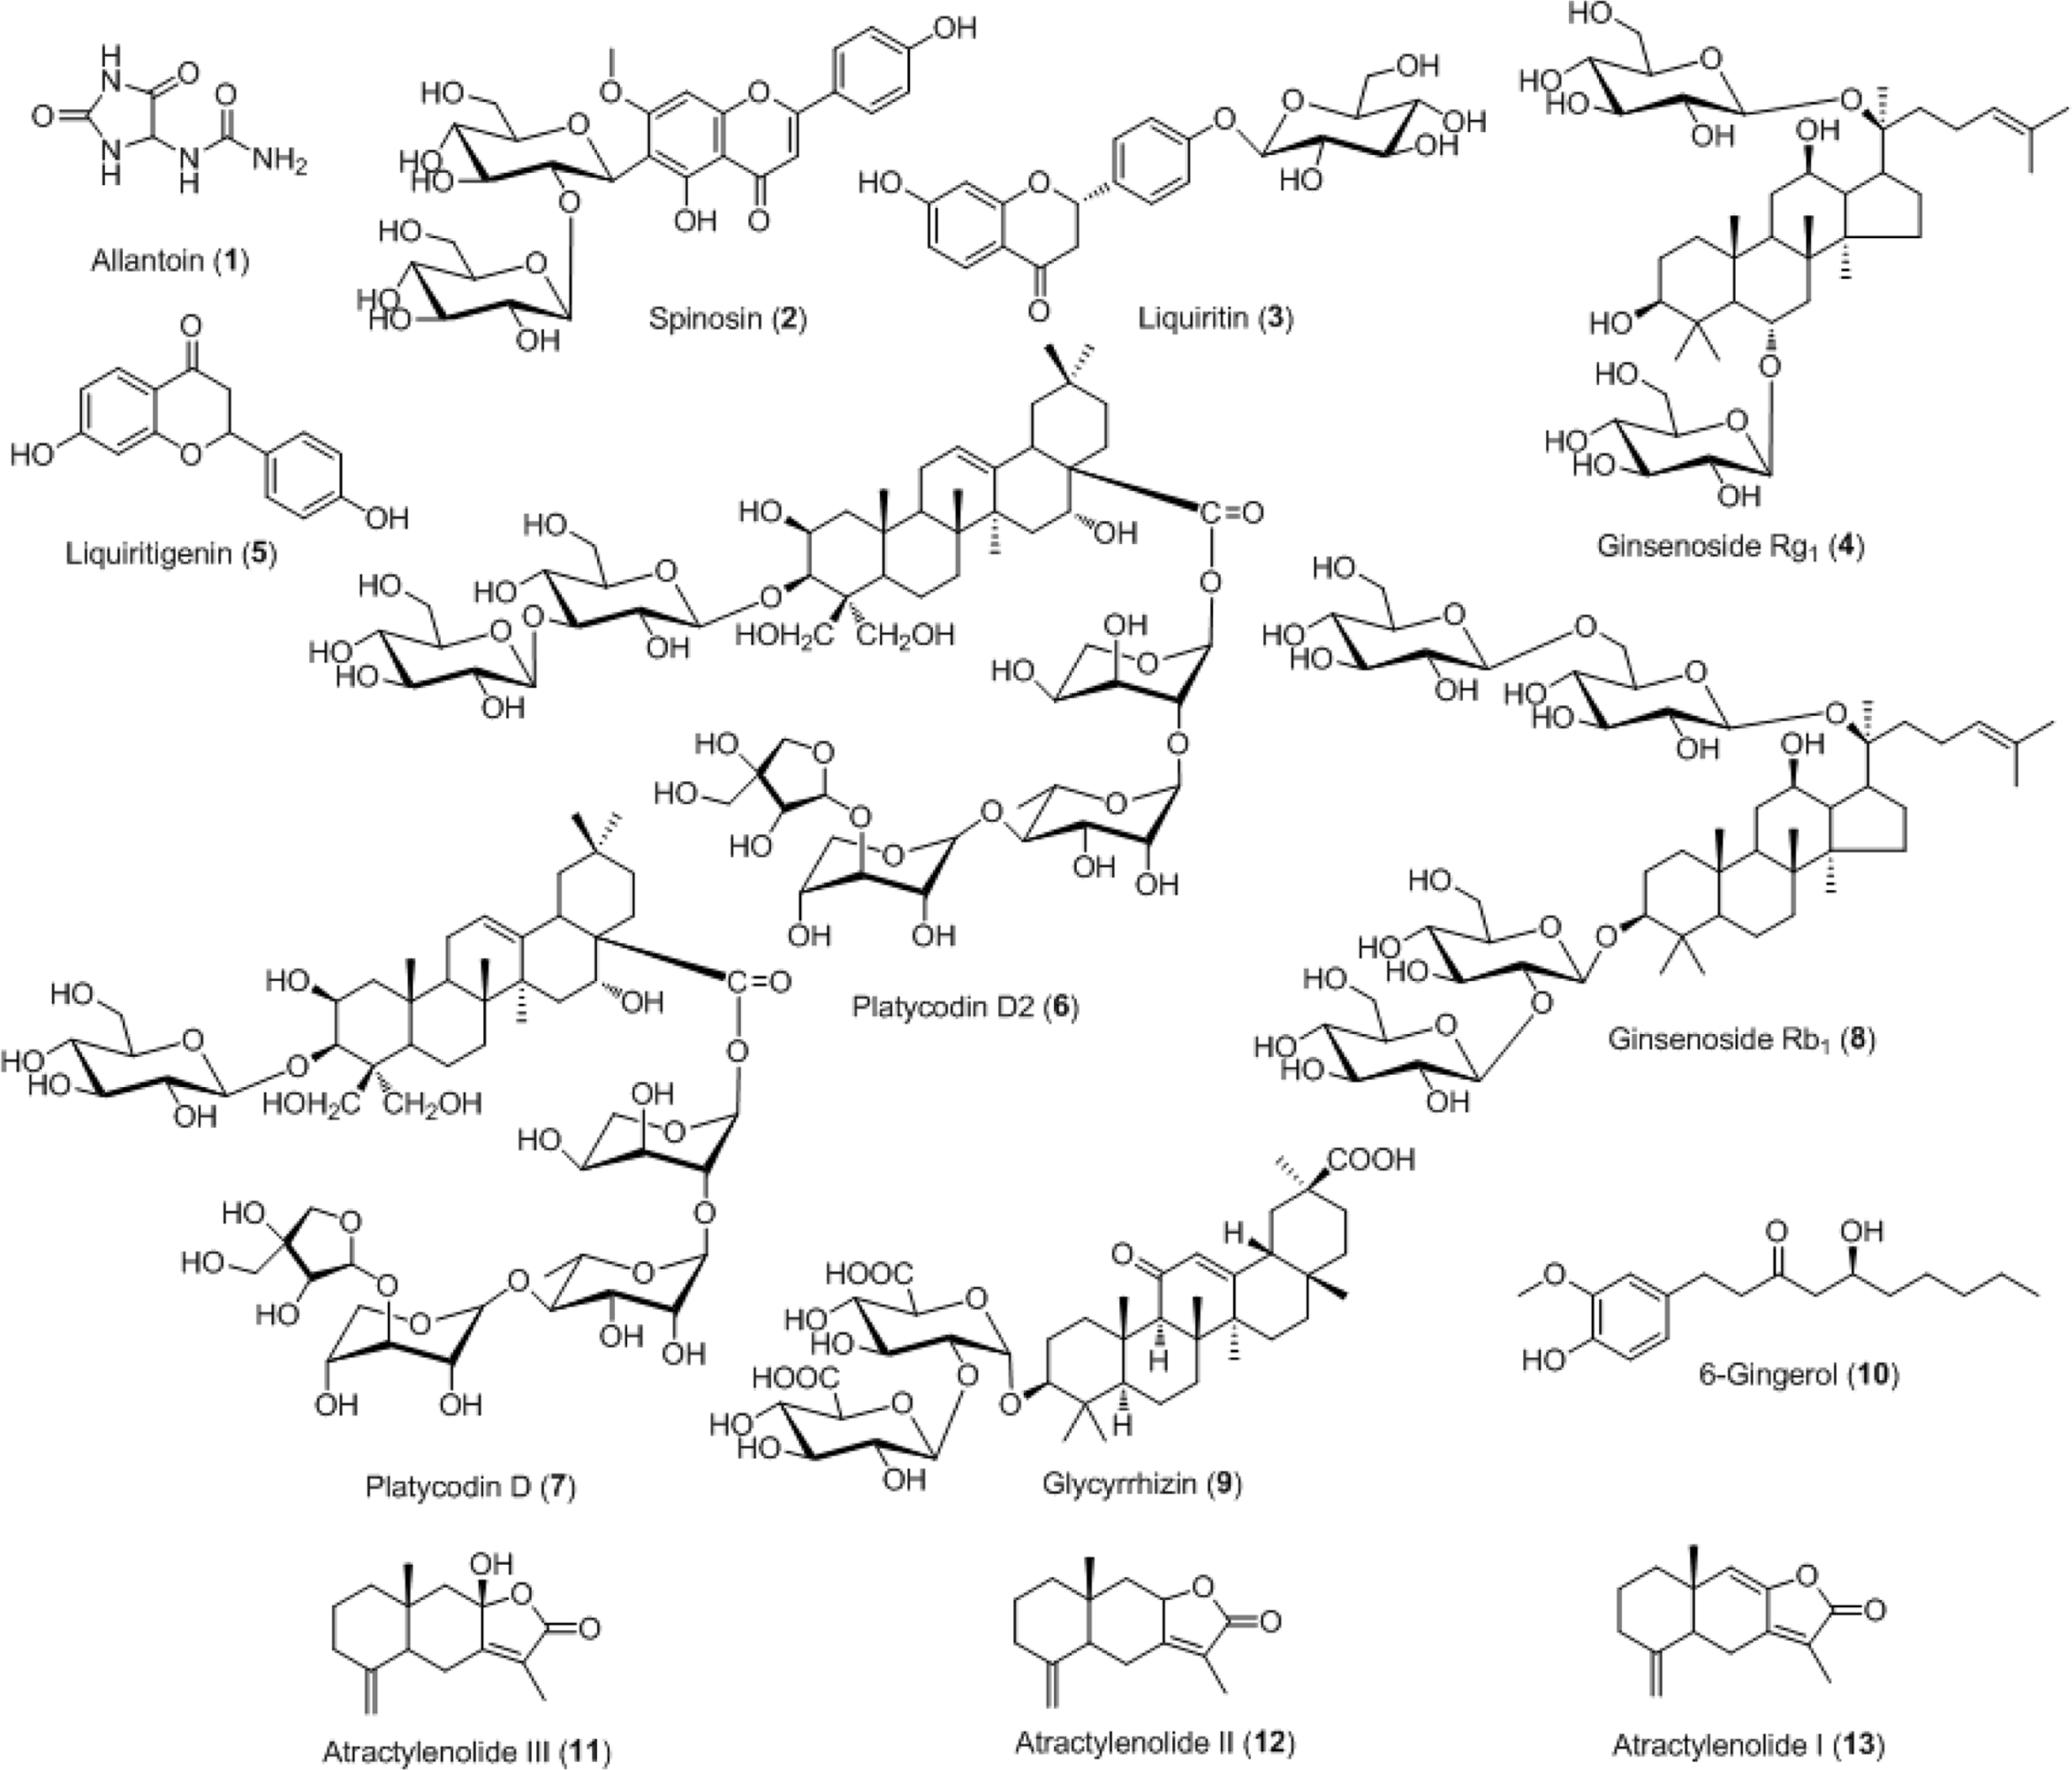
For efficient quality control of the Samryeongbaekchul-san decoction, a powerful and accurate an ultra-performance liquid chromatography (UPLC) coupled with electrospray ionization (ESI) tandem mass spectrometry (MS) method was developed for quantitative analysis of the thirteen constituents: allantoin (1), spinosin (2), liquiritin (3), ginsenoside Rg1 (4), liquiritigenin (5), platycodin D2 (6), platycodin D (7), ginsenoside Rb1 (8), glycyrrhizin (9), 6-gingerol (10), atractylenolide III (11), atractylenolide II (12), and atractylenolide I (13). Separation of the compounds 1–13 was performed on a UPLC BEH C18 column (2.1 × 100 mm, 1.7 μm) at a column temperature of 40oC with a gradient solvent system of 0.1% (v/v) formic acid aqueous-acetonitrile. The flow rate and injection volume were 0.3 mL/min and 2.0 μL. Calibration curves of all compounds were showed good linearity with values of the correlation coefficient ≥ 0.9920 within the test ranges. The values of limits of detection and quantification for all analytes were 0.04–4.53 ng/mL and 0.13–13.60 ng/mL. The result of an experiment, compounds 2, 6, 12, and 13 were not detected while compounds 1, 3–5, and 7–11 were detected with 1,570.42, 5,239.85, 299.35, 318.88, 562.27, 340.87, 12,253.69, 73.80, and 115.01 μg/g, respectively.
Go to : 
REFERENCES
(1). Qiu J.Nat. Rev. Drug Discov. 2007; 6:506–507.
(2). Wang L., Zhou G. B., Liu P., Song J. H., Liang Y., Yan X. J., Xu F., Wang B. S., Mao J. H., Shen Z. X., Chen S. J., Chen Z.Proc. Natl. Acad. Sci. U. S. A. 2008; 105:4826–4831.
(3). Chen H., Wu M., Kubo K. Y. J.Ethnopharmacol. 2012; 142:80–85.
(4). Lee S. R.Korean J. Orient. Physiol. Pathol. 2009; 23:374–380.
(5). Heo J.Dongeuibogam; Namsandang: Seoul. 2004; 440.
(6). Yang Q. H., Xu Y. J., Liu Y. Z., Liang Y. J., Feng G. F., Zhang Y. P., Xing H. J., Yan H. Z, Li Y. Y.Evid. Based Complement. Alternat. Med. 2014; 2014:671013–671021.
(7). Yang Q. H., Xu Y. J., Feng G. F., Hu C. F., Zhang Y. P., Cheng S. B., Wagn Y. P., Gong X. W. Afr. J.Tradit. Complement. Altern. Med. 2013; 11:213–221.
(8). Liu X., Jia Y., Iiu Q., Wu J.Lishizhen Med. Mater. Med. Res. 2011; 22:2671–2673.
(9). You Y., Liu U., Gao S.Chinese J. Experiment. Trad. Med. Formulae. 2012; 18:136–140.
(10). Turner R., Stamp L. K., Kettle A. J. J.Chromatogr. B Analyt. Technol. Biomed. Life Sci. 2012; 891-892:85–89.
(12). Wang Y., Yang L., He Y. Q., Wang C. H., Welbeck E. W., Bligh S. W., Wang Z. T.Rapid Commun. Mass Spectrom. 2008; 22:1767–1778.
(13). Zhao J., Su C., Yang C., Liu M., Tang L., Su W., Liu Z. J.Pharm. Biomed. Anal. 2012; 64-65:94–97.
(14). Tan G., Zhu Z., Jing J., Lv L., Lou Z., Zhang G., Chai Y.Biomed. Chromatogr. 2011; 25:913–924.
(15). Na Y. C., Ha Y. W., Kim Y. S., Kim K. J. J.Chromatogr. A. 2008; 1189:467–475.
(16). Chen L., Qi J., Chang Y. X., Zhu D., Yu B. J.Pharm. Biomed. Anal. 2009; 50:127–137.
Go to : 
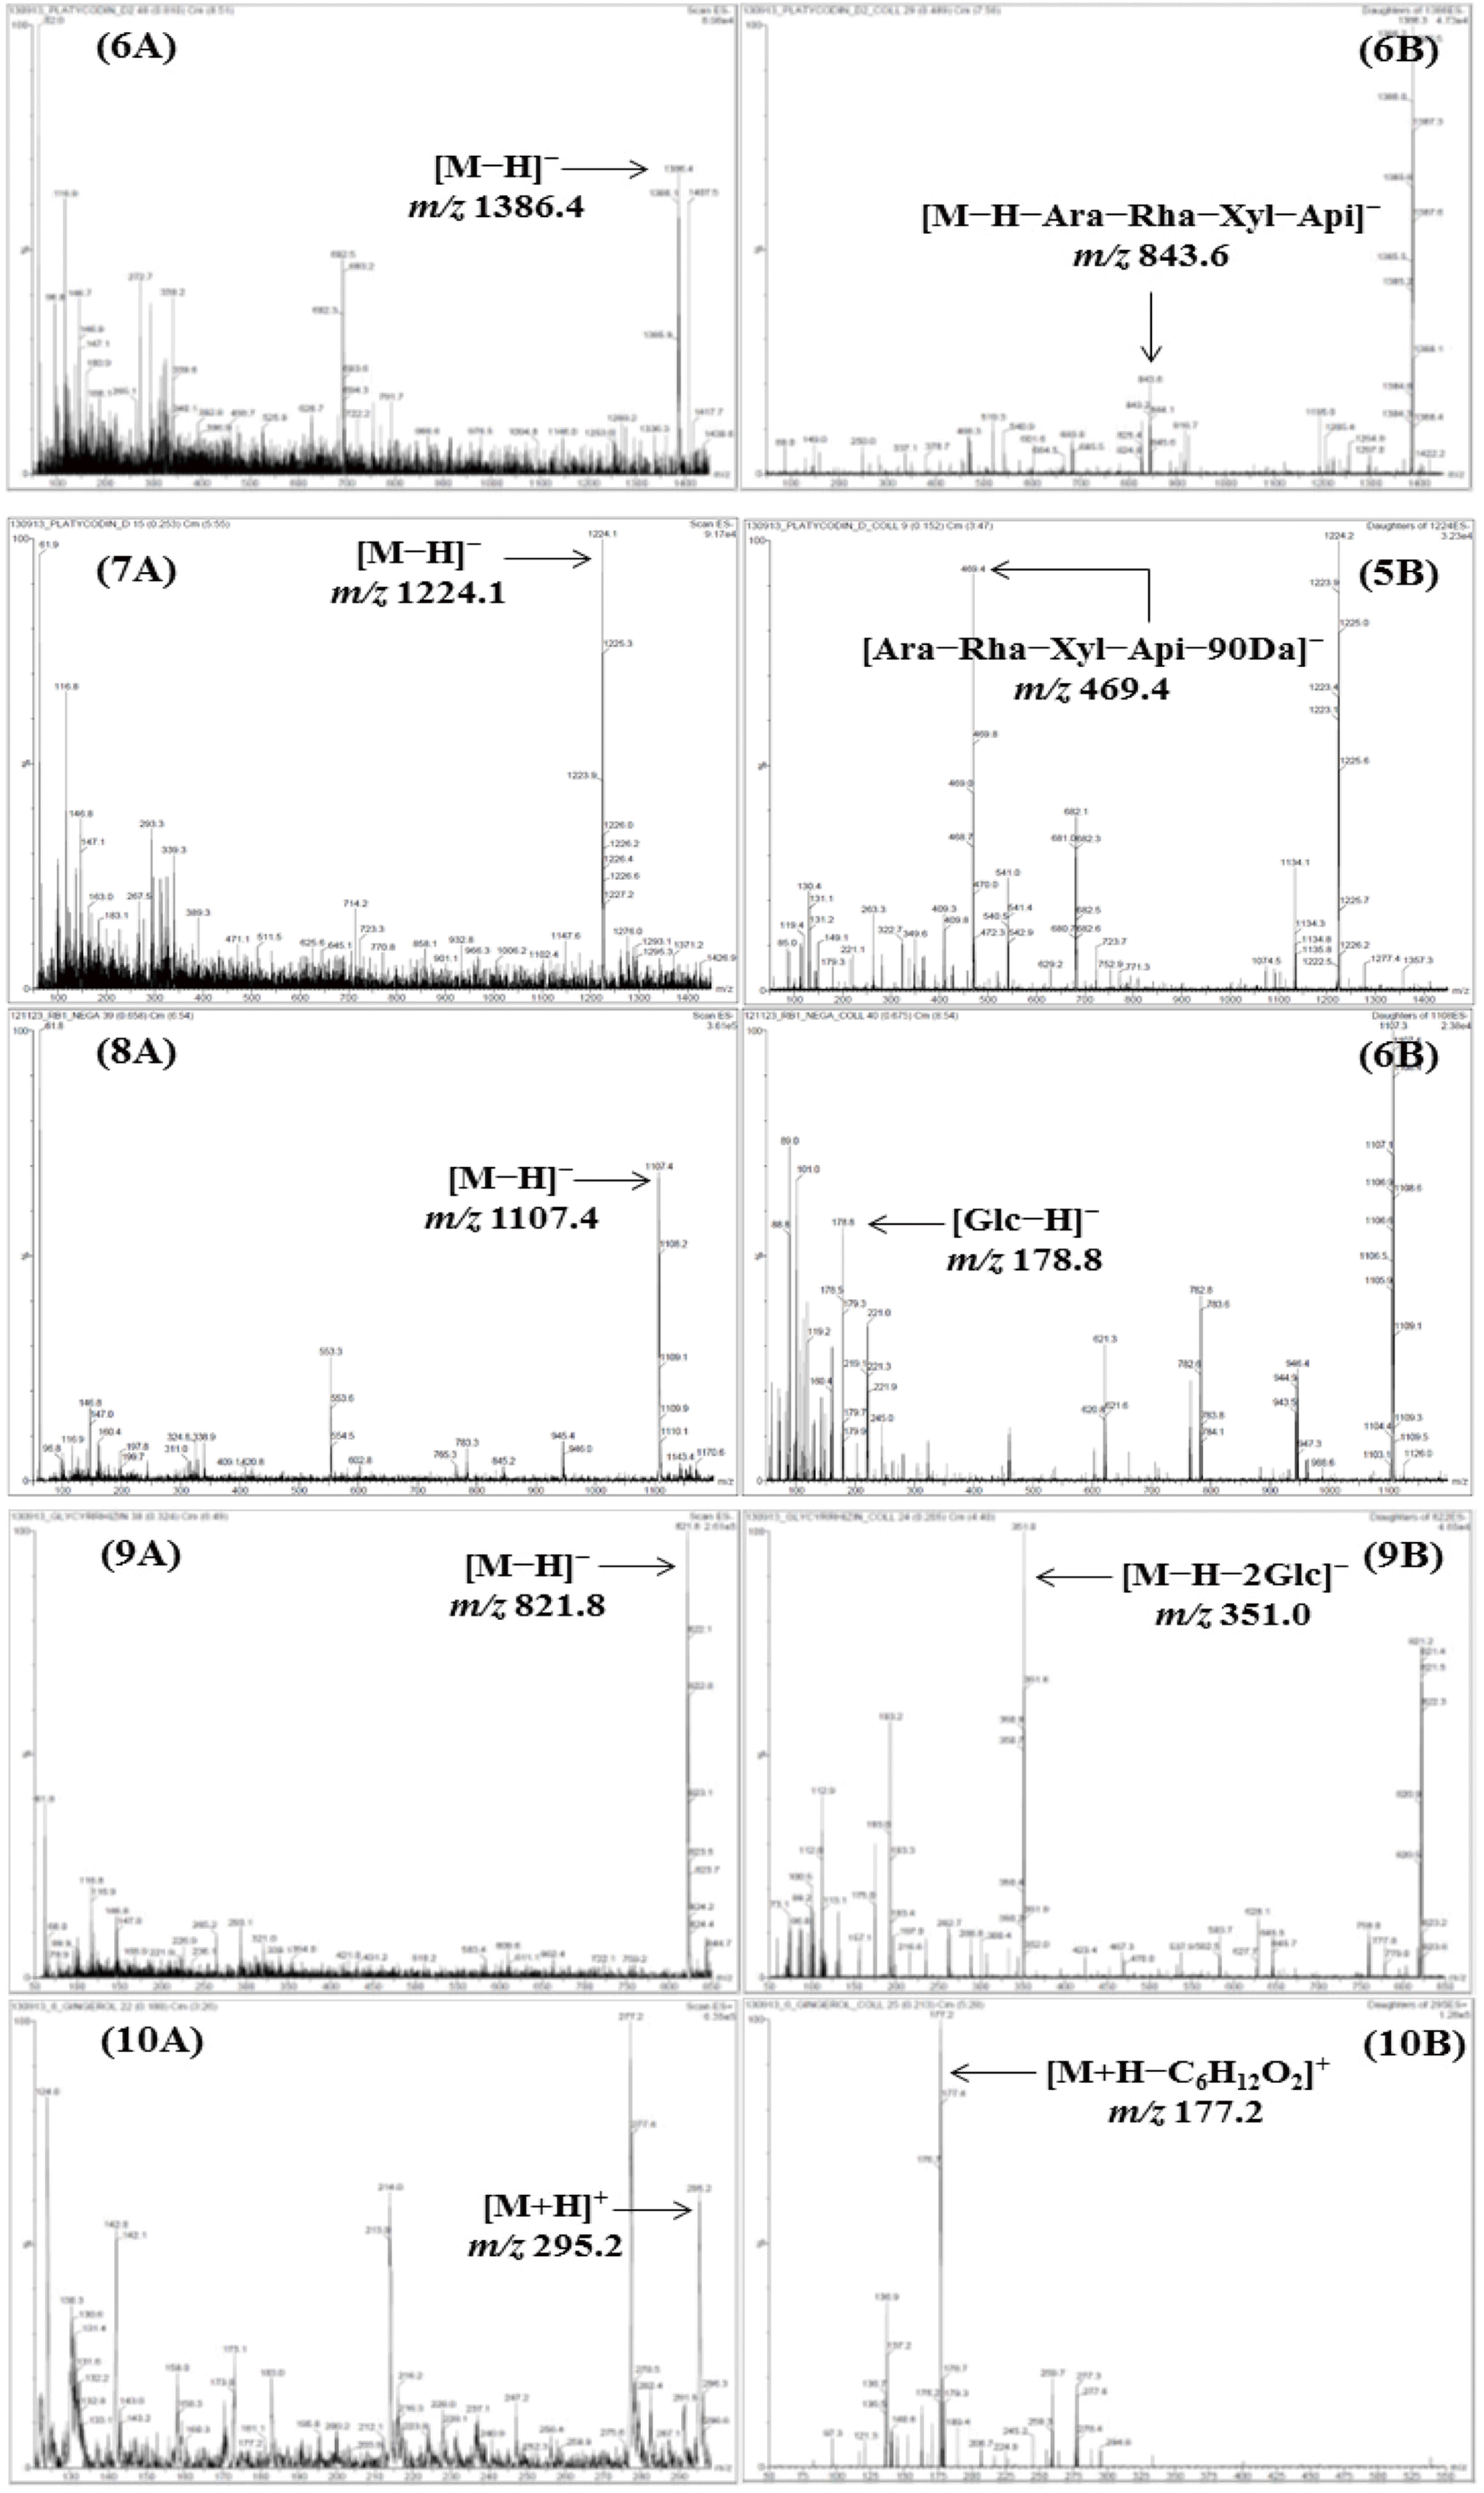
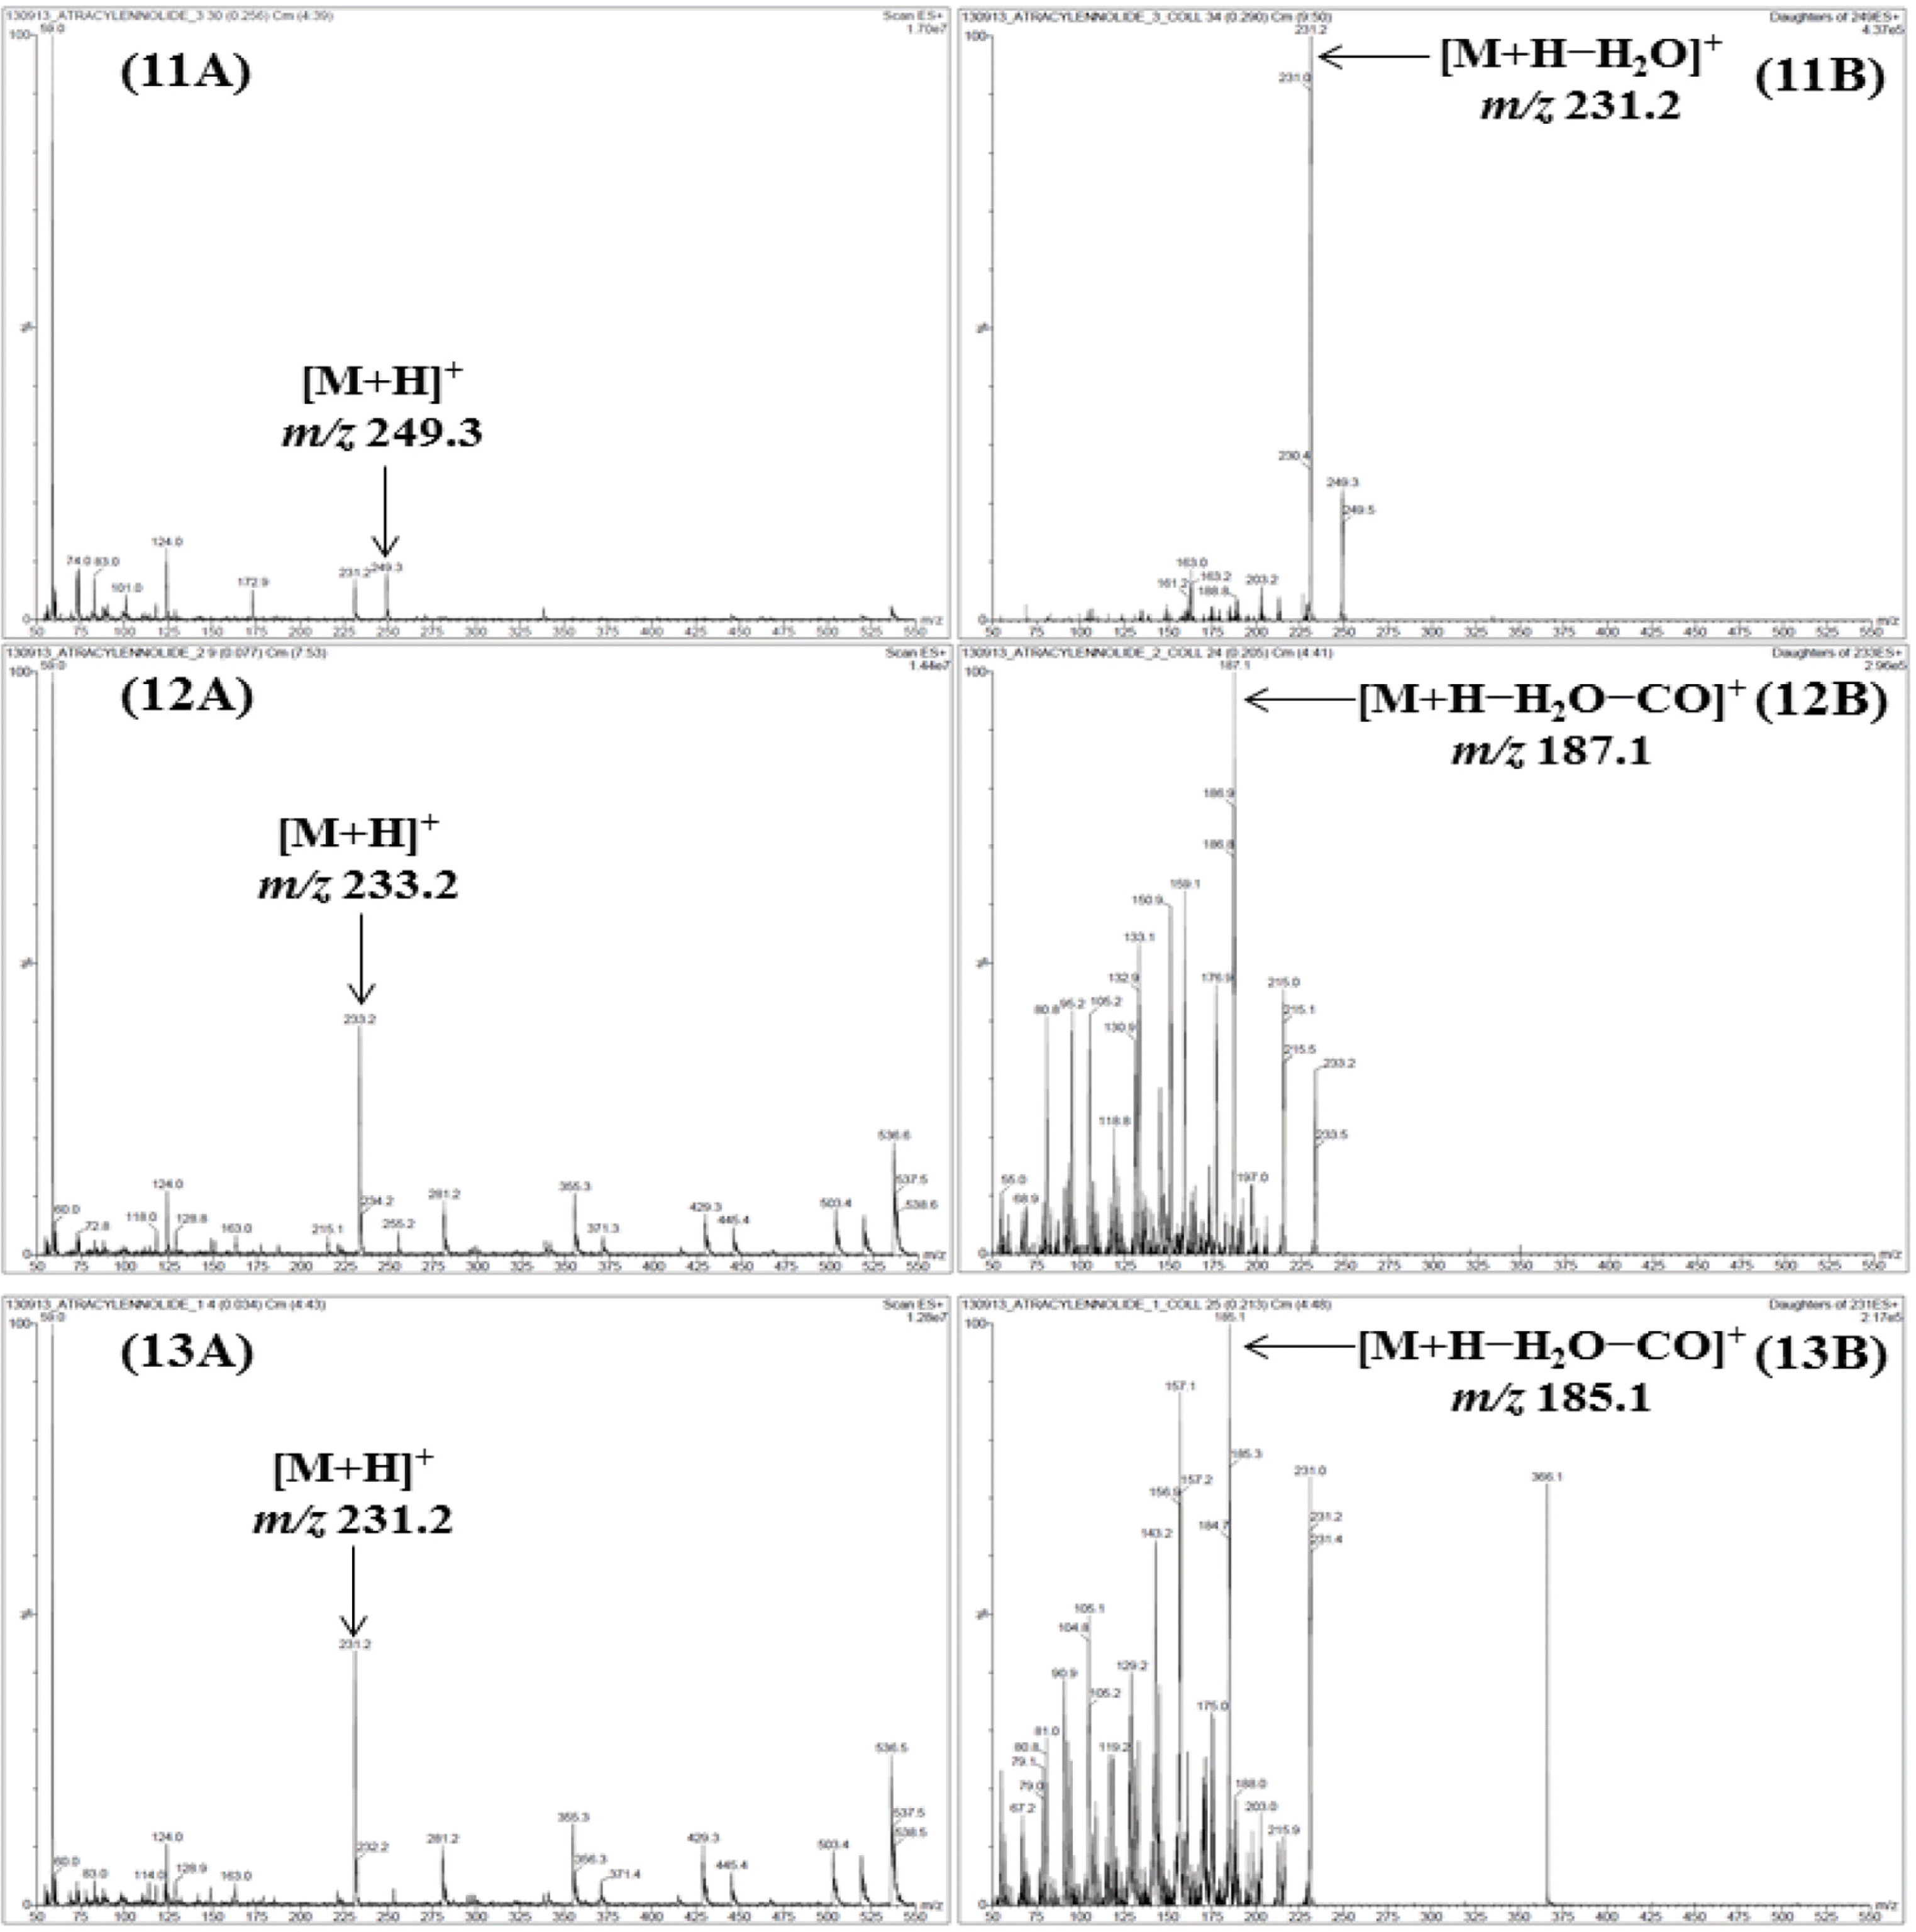
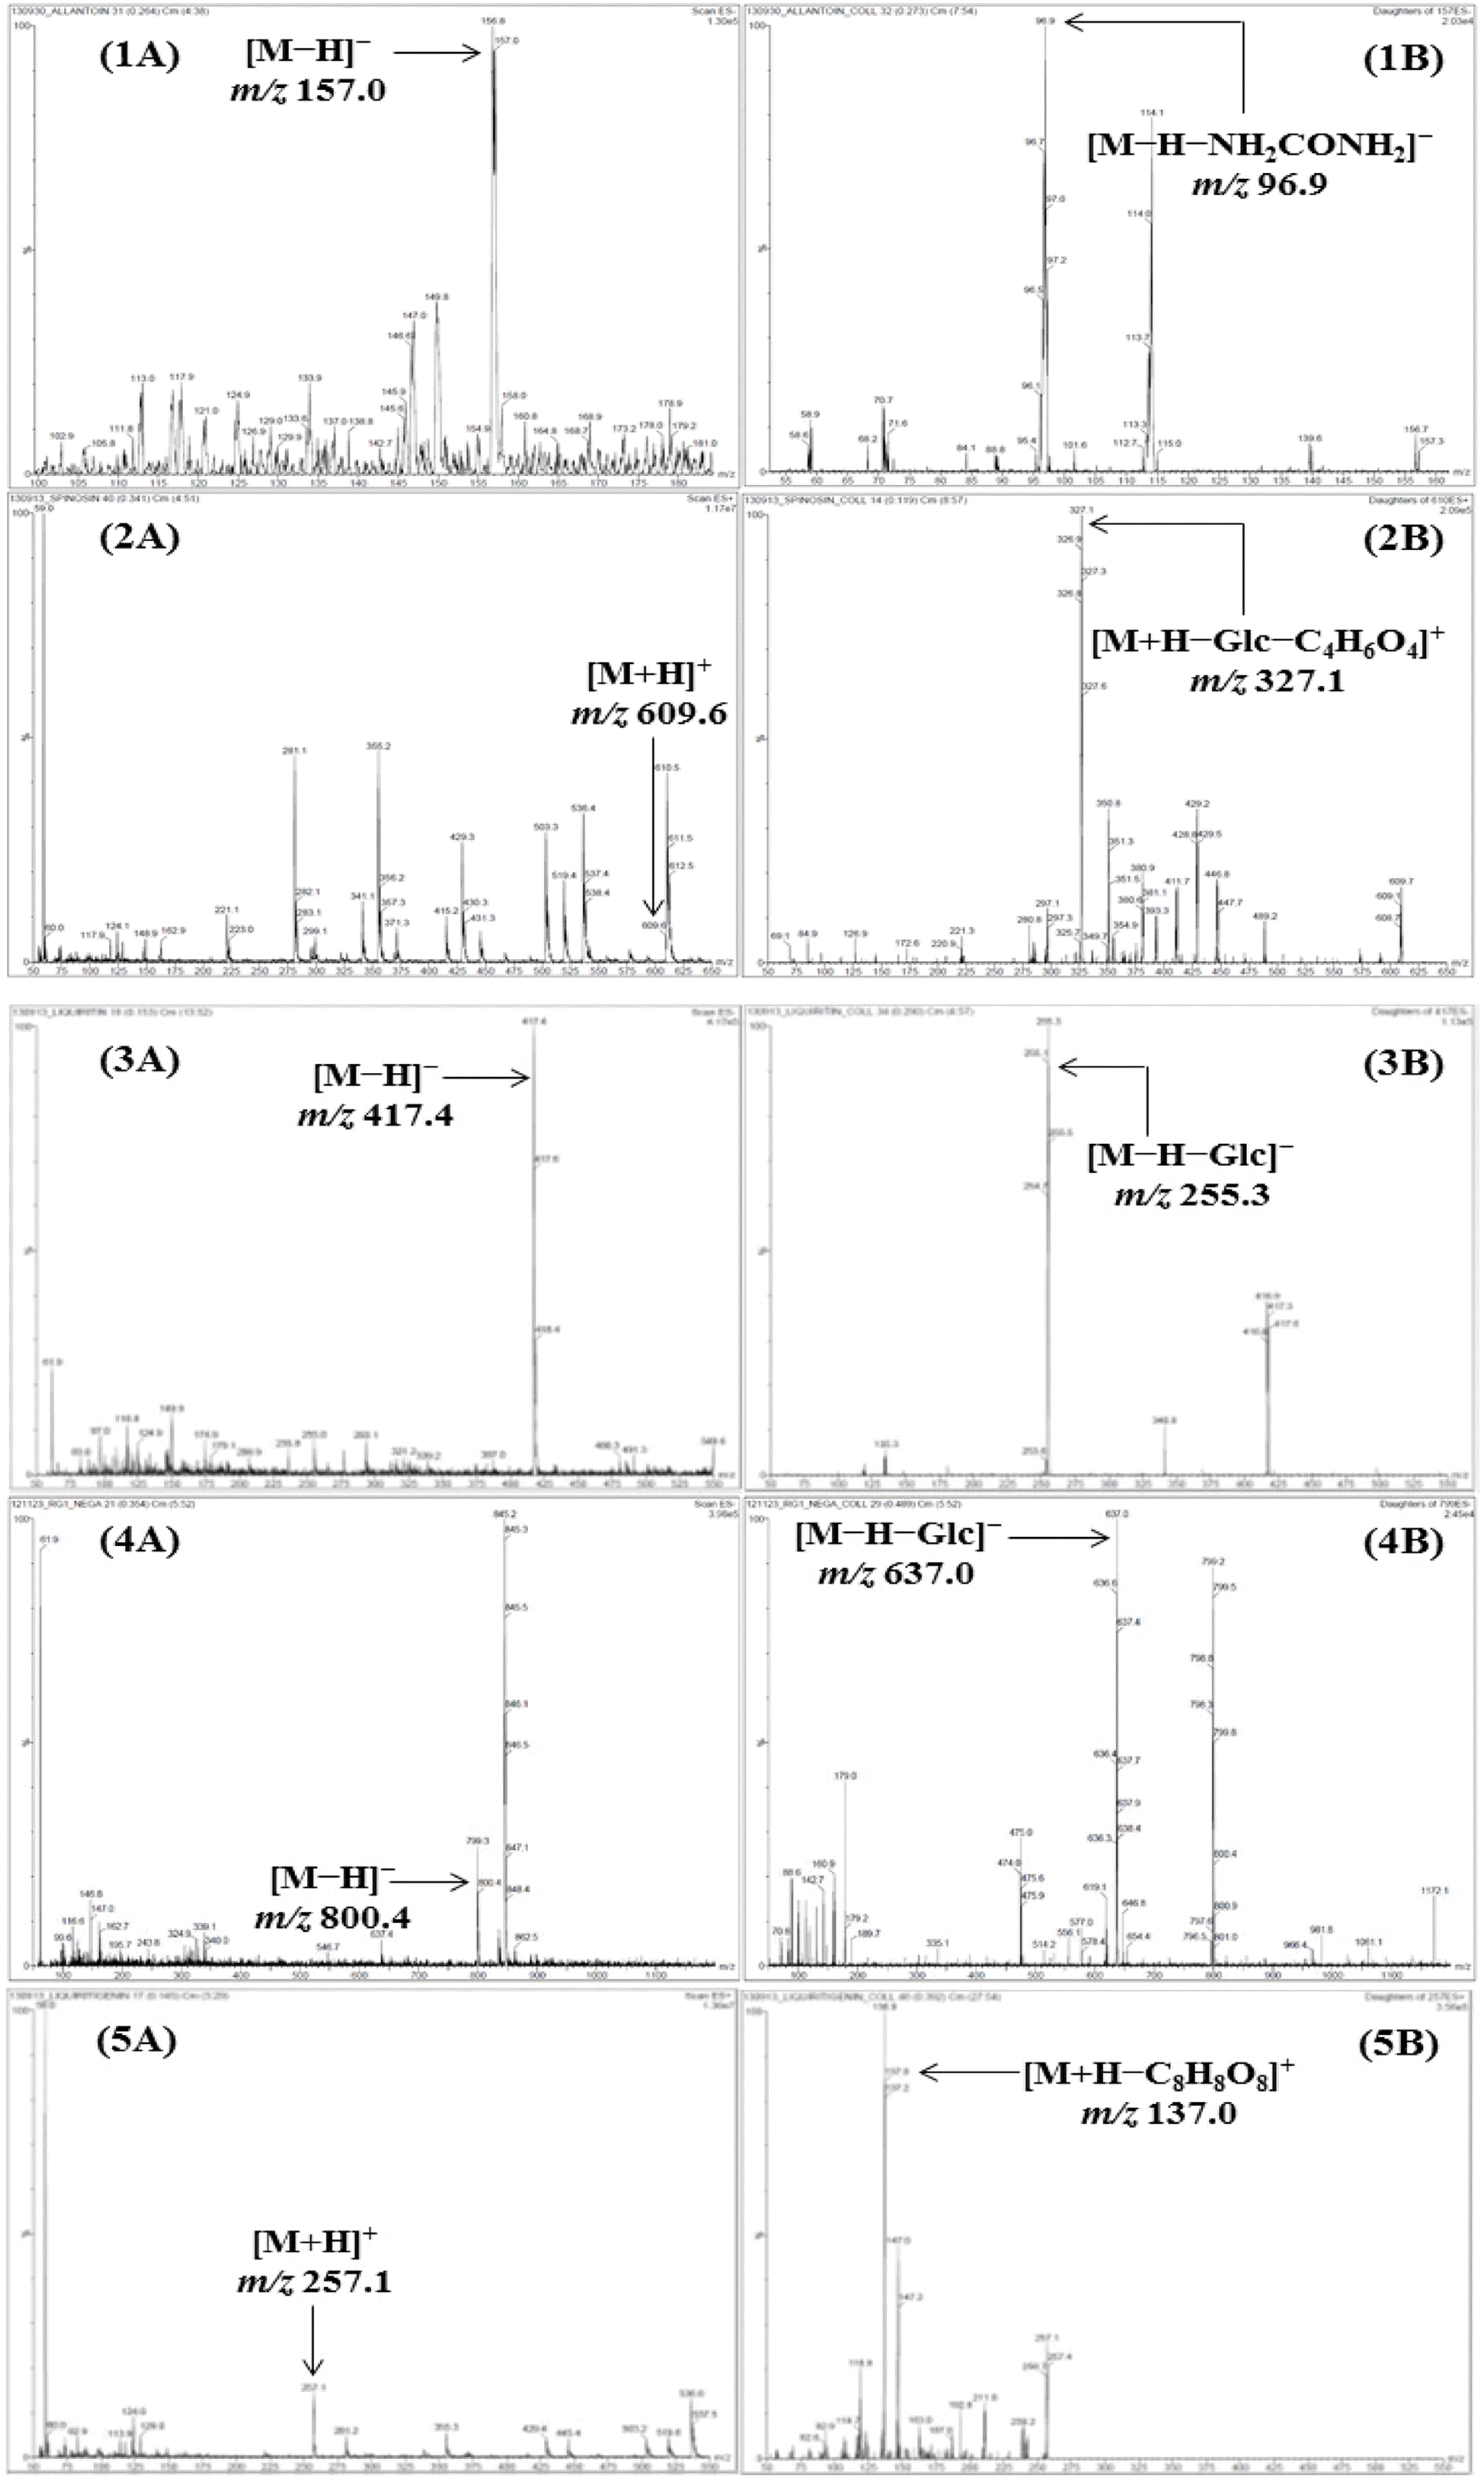 | Fig. 2.M ass spectra of the precursor ion (Q1, A) and product ion (Q3, B) for LC-MS/MS MRM mode of the compounds 1–13. Allantoin (1), spinosin (2), liquiritin (3), ginsenoside Rg1 (4), liquiritigenin (5), platycodin D2 (6), platycodin D (7), ginsenoside Rb1 (8), glycyrrhizin (9), 6-gingerol (10), atractylenolide III (11), atractylenolide II (12), and atractylenolide I (13). |
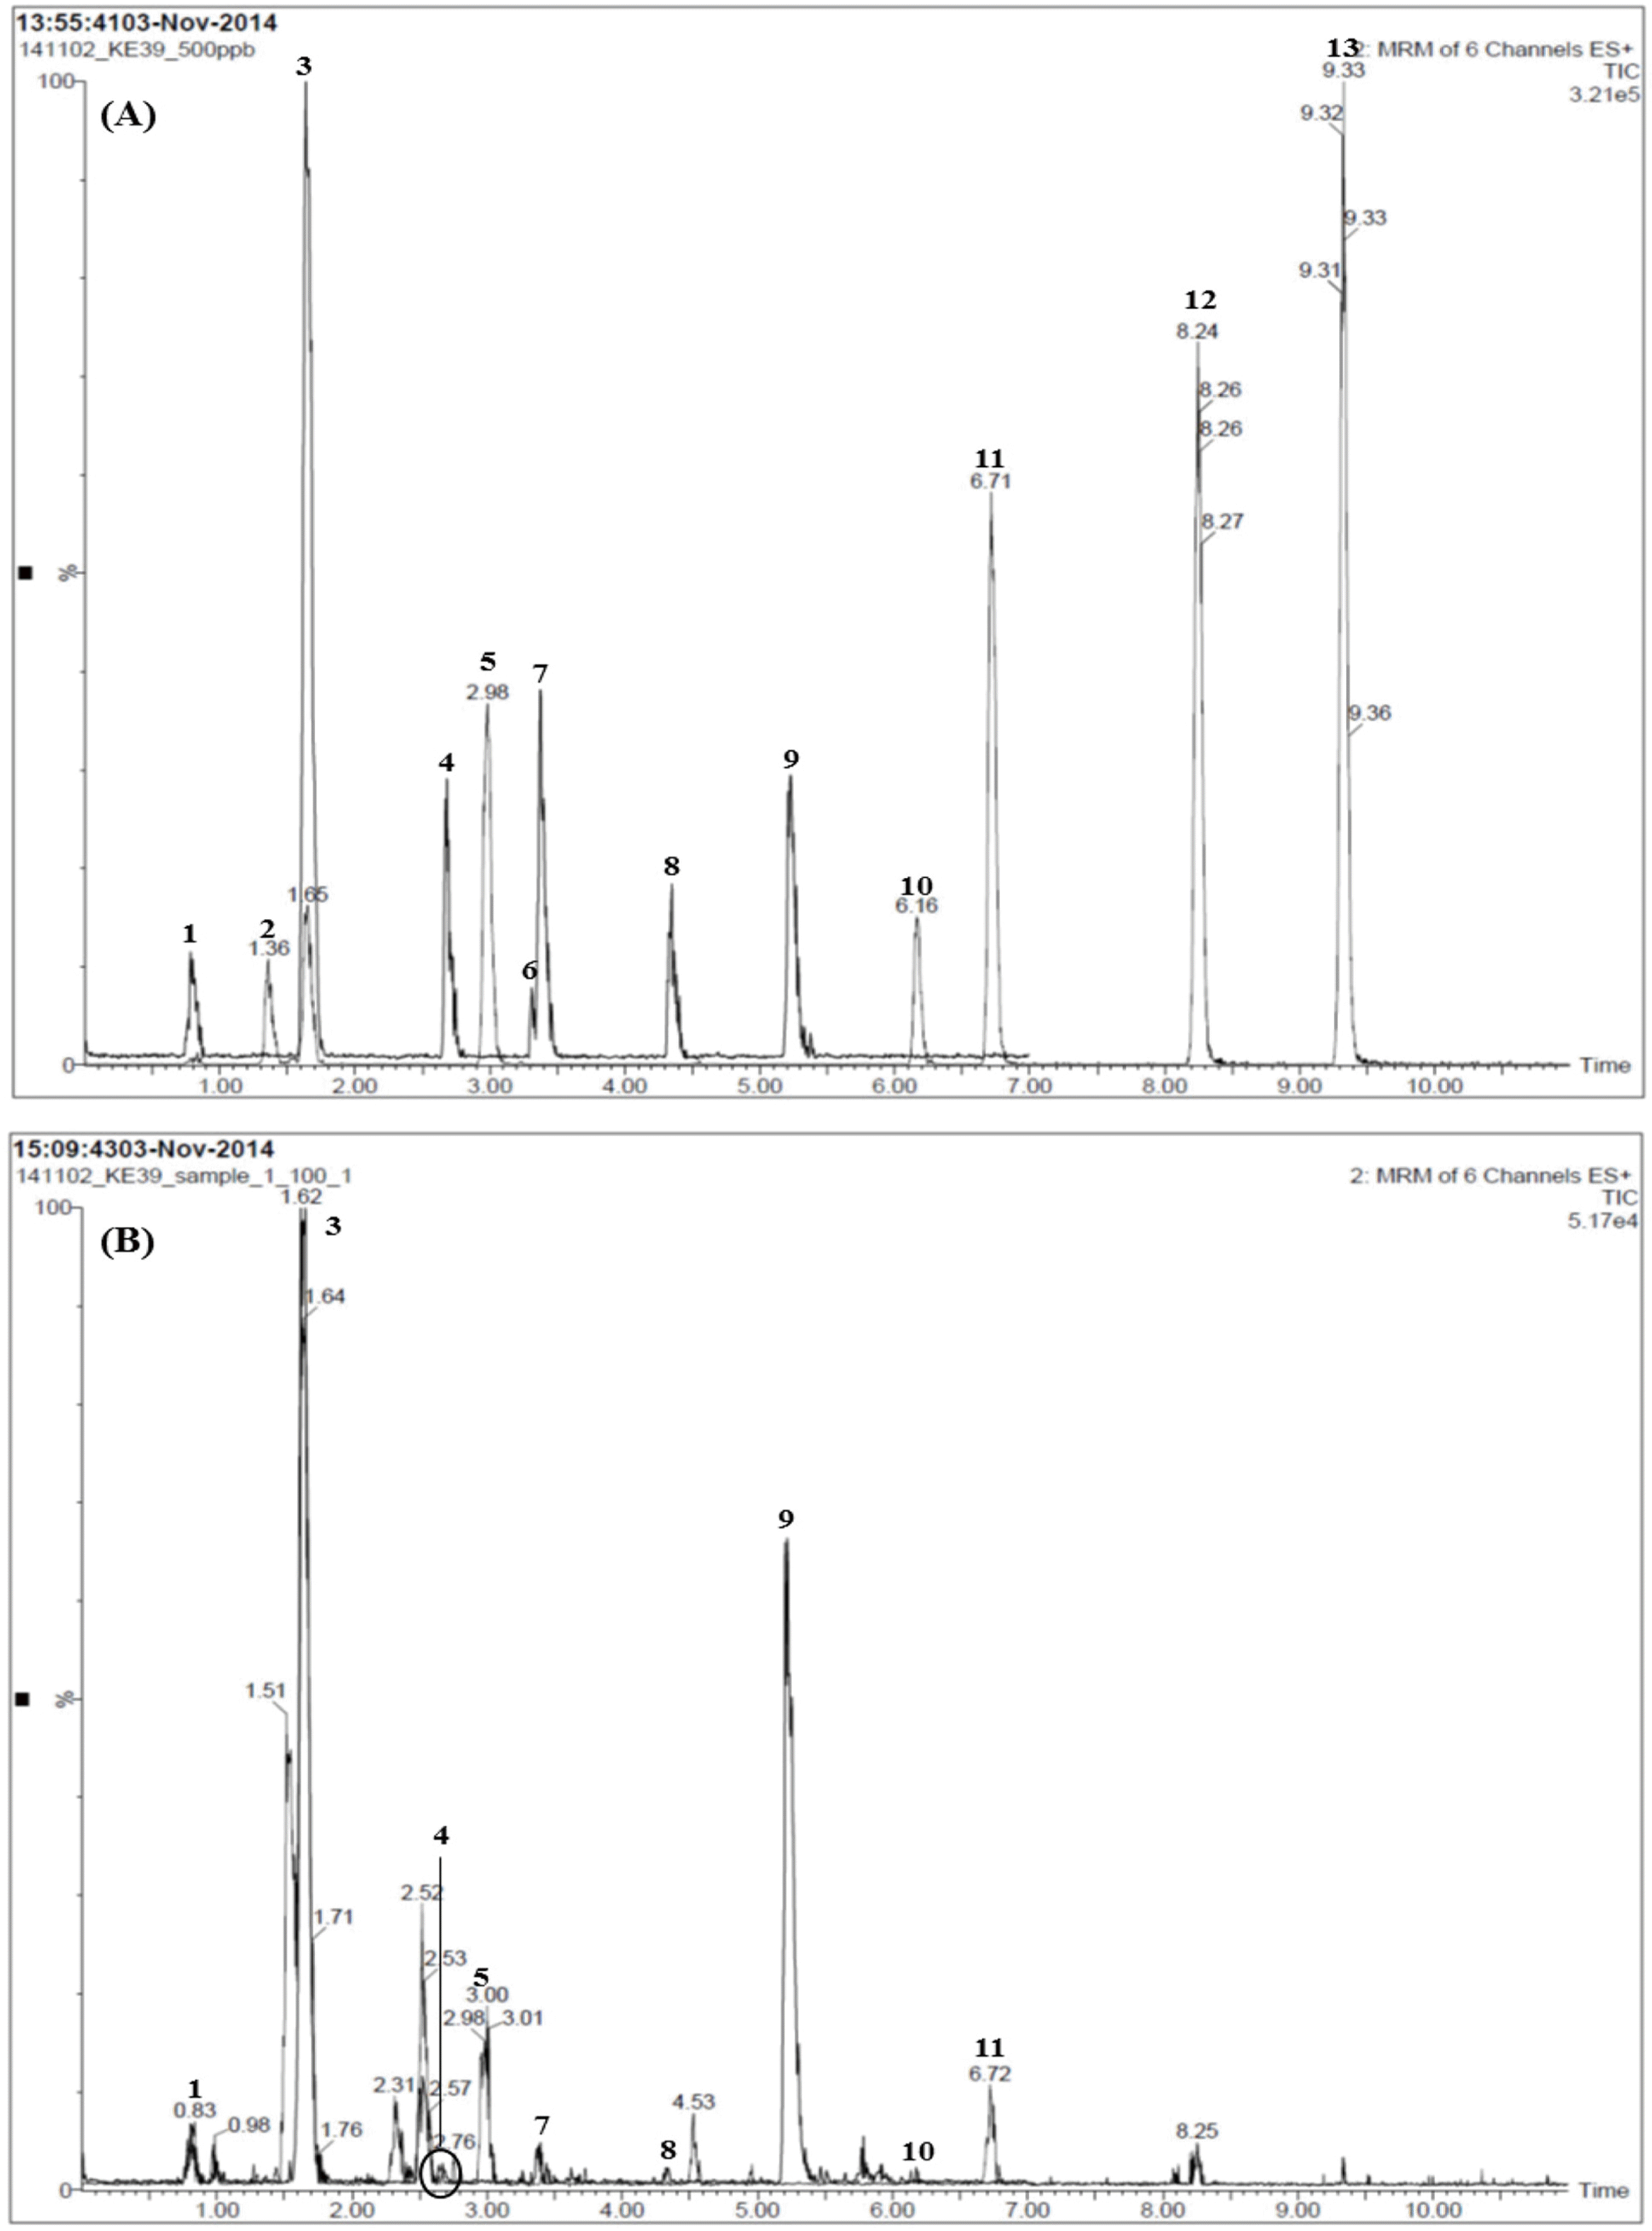 | Fig. 3.Total ion chromatograms of the standard solution (A) and Samryeongbaekchul-san sample (B) by LC-MS/MS MRM mode. Allantoin (1), spinosin (2), liquiritin (3), ginsenoside Rg1 (4), liquiritigenin (5), platycodin D2 (6), platycodin D (7), ginsenoside Rb1 (8), glycyrrhizin (9), 6-gingerol (10), atractylenolide III (11), atractylenolide II (12), and atractylenolide I (13). |
Table 1.
Composition of Samryeongbaekchul-san
Table 2.
Conditions for the LC-MS/MS analysis of Samryeongbaekchul-san
| HPLC condition | |||
|---|---|---|---|
| Column | ACQUITY UPLC BEH C18 (100 × 2.1 mm, 1.7 µ m) | ||
| Flow rate | 0.3 mL/min | ||
| Injection volume | 2.0 µ L | ||
| Column temperature | 45°C | ||
| Sample temperature | 5°C | ||
| Mobile phase |
Time (min) |
A (%)a |
B (%)b |
| 0 | 80 | 20 | |
| 0.1 | 80 | 20 | |
| 14.0 | 5 | 95 | |
| 15.0 | 0 | 100 | |
| 15.1 | 80 | 20 | |
| 18.1 | 80 | 20 | |
| MS condition | |||
| Capillary voltage (kV) | 3.3 | ||
| Extract voltage (V) | 3.0 | ||
| Source temp. (°C) | 120 | ||
| RF lens (V) | 0.3 | ||
| Desolvation temp. (°C) | 300 | ||
| Desolvation gas (L/h) | 600 | ||
| Cone gas (L/h) | 50 | ||
| Collision gas (mL/min) | 0.14 | ||
Table 3.
Linearities, regression equation, correlation coefficients, LOD, and LOQ for the compounds 1–13
| Analyte | Linear range (ng/mL) | Regression equationa | Correlation coefficient | LODb (ng/mL) | LOQc (ng/mL) |
|---|---|---|---|---|---|
| 1 | 0–500 | y = 0.50 x – 9.16 | 0.9922 | 4.53 | 13.60 |
| 2 | 0–500 | y = 4.02 x – 9.16 | 0.9987 | 0.18 | 0.53 |
| 3 | 0–500 | y = 5.62x – 11.57 | 0.9997 | 0.18 | 0.53 |
| 4 | 0–500 | y = 1.03 x – 12.52 | 0.9974 | 1.11 | 3.33 |
| 5 | 0–500 | y = 15.87 x + 28.64 | 0.9996 | 0.06 | 0.18 |
| 6 | 0–500 | y = 0.29 x – 3.61 | 0.9923 | 2.79 | 8.37 |
| 7 | 0–500 | y = 1.44 x – 2.69 | 0.9978 | 0.96 | 2.89 |
| 8 | 0–500 | y = 0.70 x – 4.92 | 0.9920 | 0.94 | 2.81 |
| 9 | 0–500 | y = 1.56 x – 18.10 | 0.9964 | 0.46 | 1.38 |
| 10 | 0–500 | y = 5.72 x – 43.06 | 0.9982 | 0.04 | 0.13 |
| 11 | 0–500 | y = 21.20 x + 41.06 | 0.9997 | 0.28 | 0.85 |
| 12 | 0–500 | y = 28.32 x + 172.36 | 0.9993 | 0.12 | 0.37 |
| 13 | 0–500 | y = 35.25 x + 133.65 | 0.9996 | 0.06 | 0.17 |
Table 4.
Mass detection condition of the compounds 1–13
Table 5.
Contents of the compounds 1–13 in Samryeongbaekchul-san (n = 3)


 PDF
PDF ePub
ePub Citation
 Print
Print


 XML Download