Abstract
REFERENCES
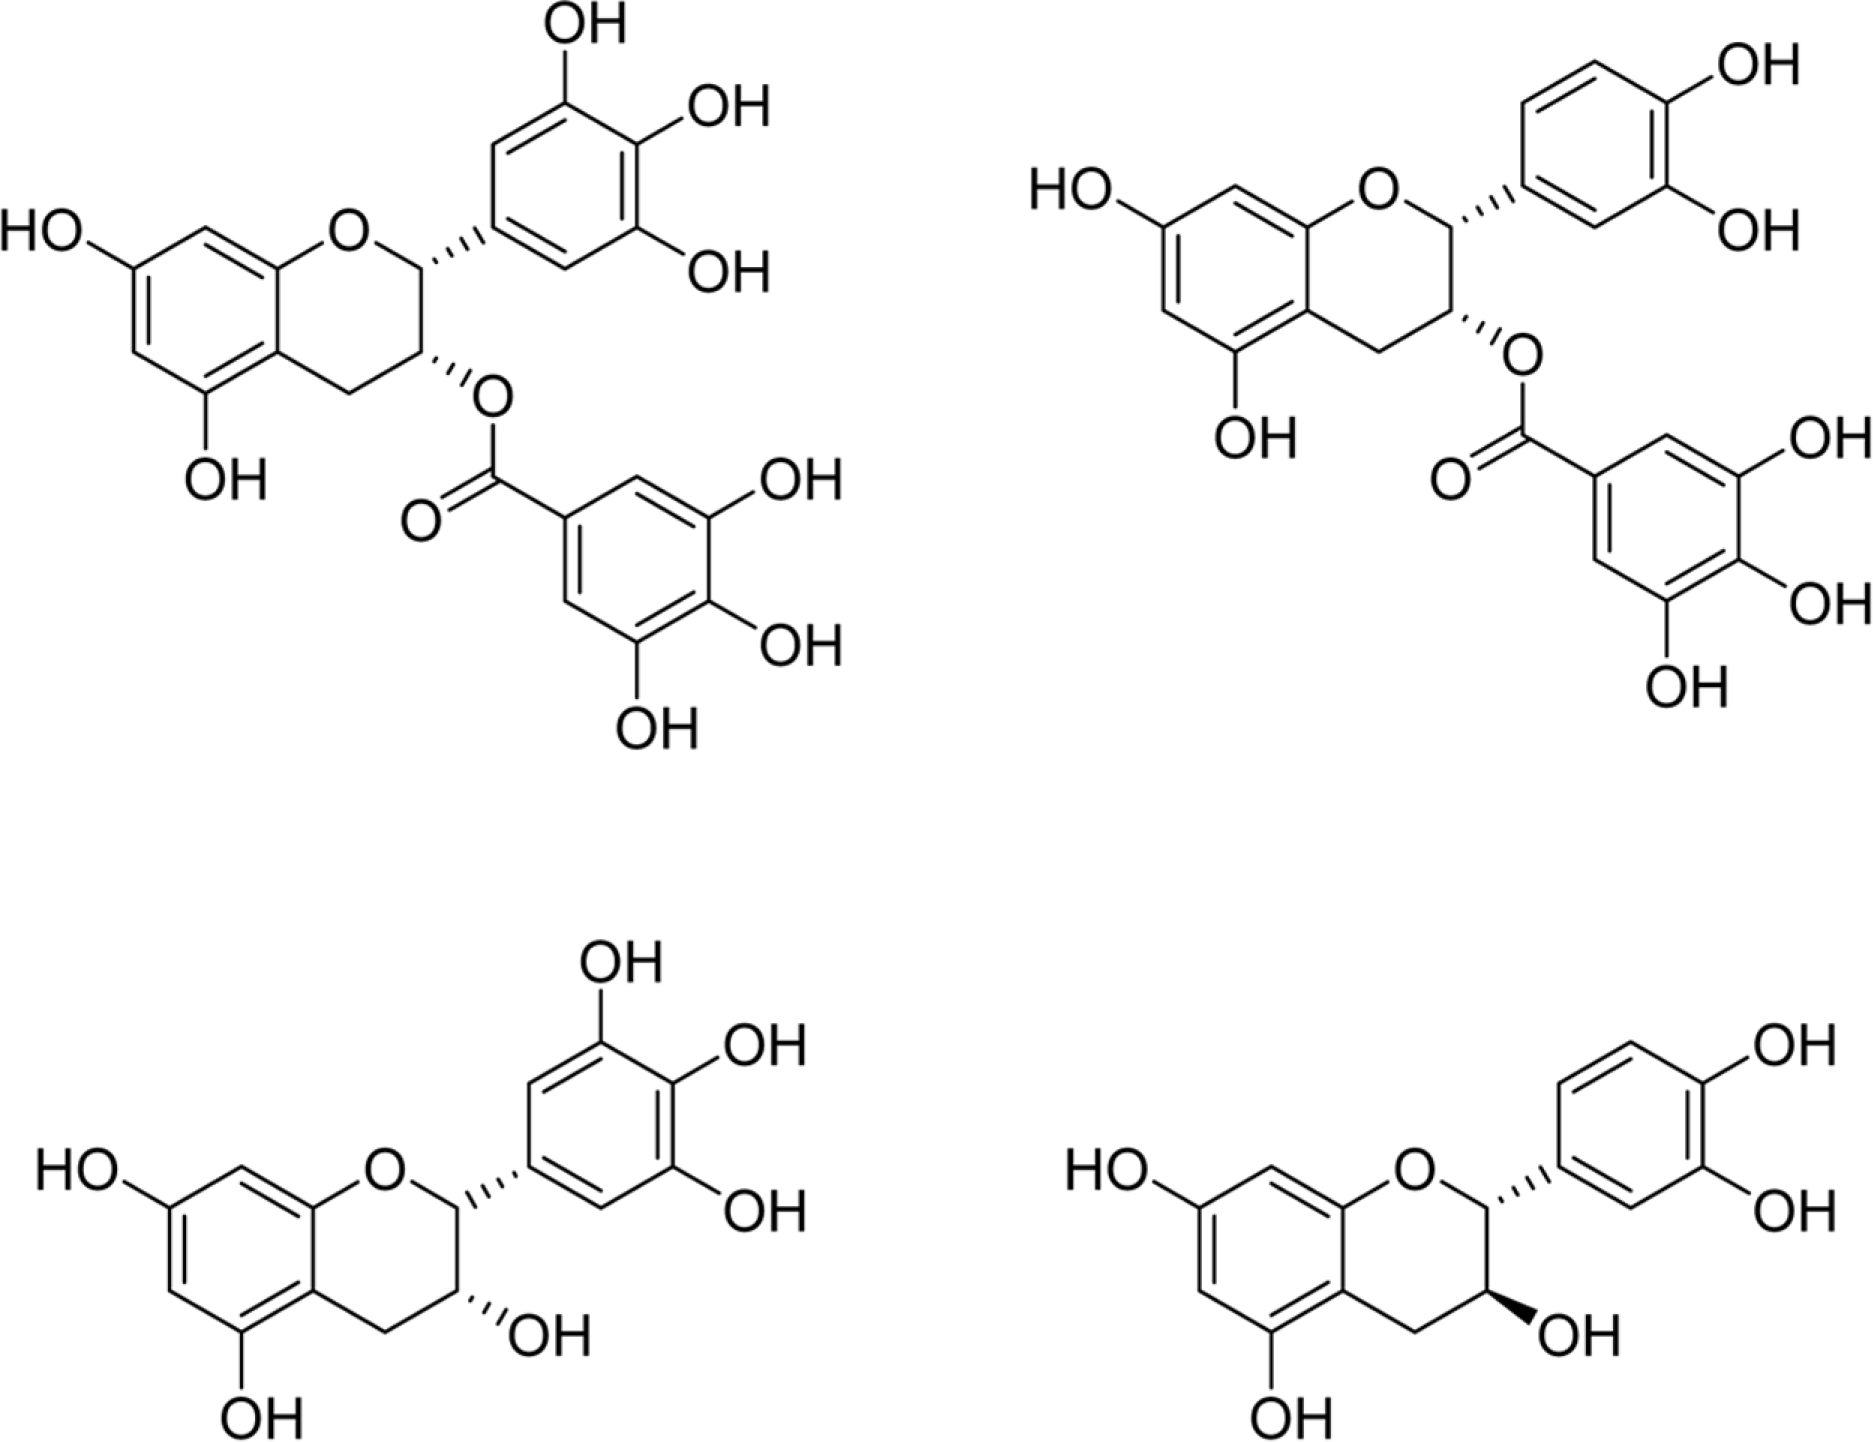
 | Fig. 1.Chemical Structures of catechins. Structures of (−)-epigallocatechin gallate (EGCG) (a), (−)-epicatechin gallate (ECG)(b), (−)-epigallocatechin (EGC) (c), and (+)-catechin (C) (d). |
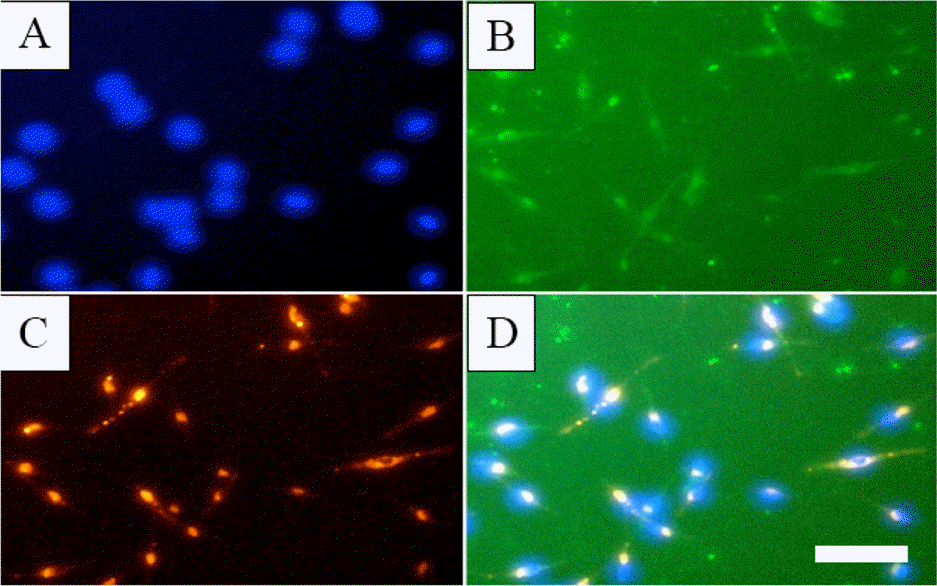
 | Fig. 2.PB-EPCs lectin binding and LDL uptake. PB-EPCs were seeded in 96-well plate and subjected to Fluorescent Staining as described in Experimental. A: DAPI, B: FITC-UEA-I, C: Dil-acLDL, D: Merge of A, B and C. White bar: 50 μ m. |
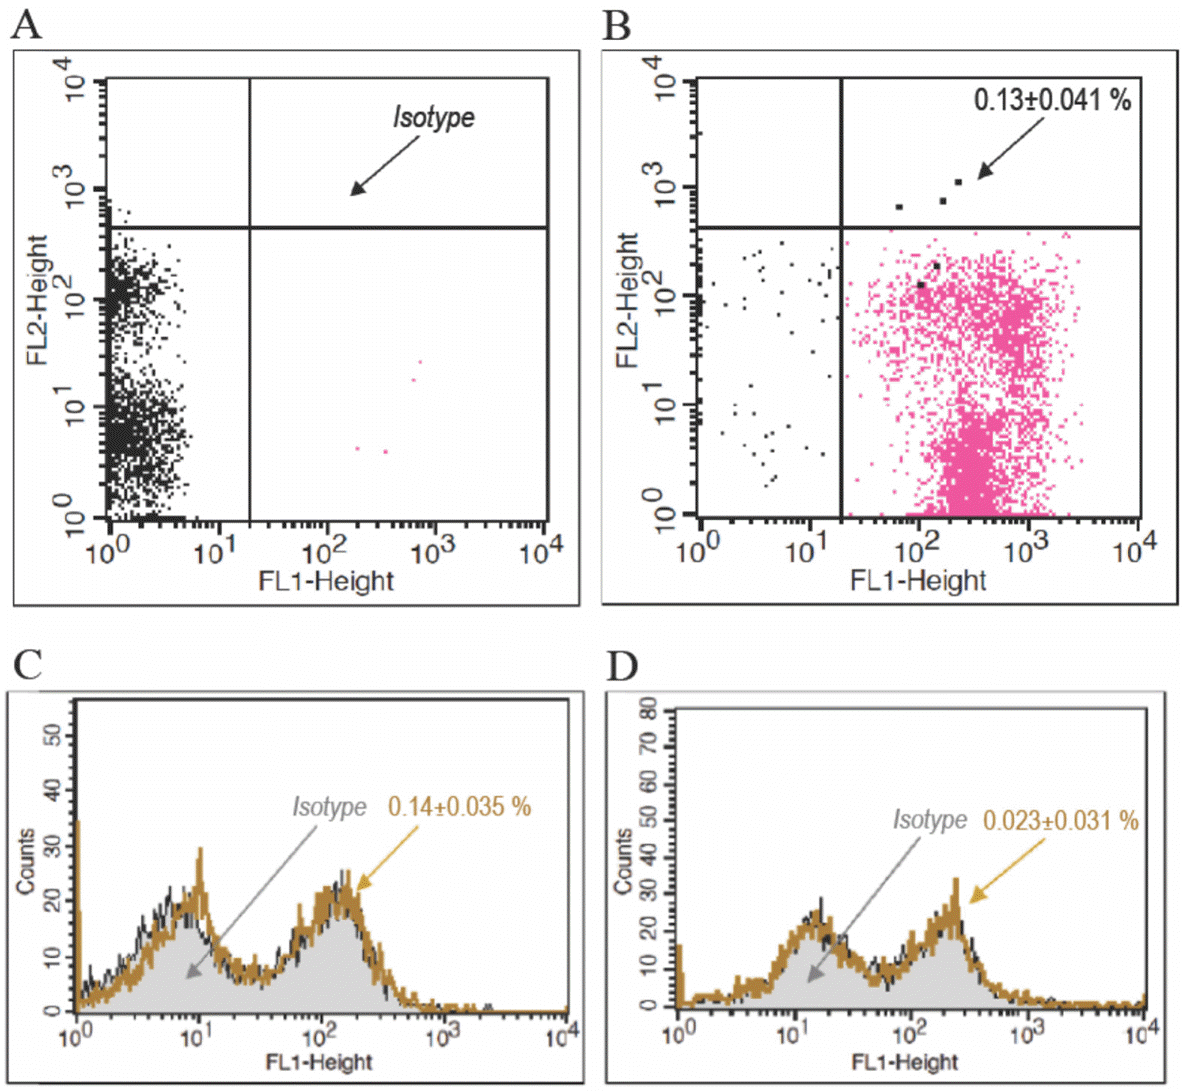
 | Fig. 3.PB-EPCs immunophenotypes. PB-EPCs were detached and subjected to Immunophenotyping as described in Experimental. A: isotype, B: CD34/45, C: CD133 and its isotype, D: VEGF-R2 and its isotype. |
Table 1.
PB-EPCs were treated with 12.5, 25, 50 or 100 µmol/L of EGCG, ECG, EGC or C for 24 hours. MTS Assay was carried out as described in Experimental. Each treatment was done in triplicate.
a,b,c Means in the same column containing the same superscript are not significant (p ≥ 0.05), while means in the same column containing different superscript in small letter indicate significant differences (p < 0.05).
AB Means in the same row containing the same superscript are not significant (p ≥ 0.05), while means in the same row containing different superscript in capital letter indicate significant differences (p < 0.05). Statistical analysis was performed based on Duncan's post-hoc test. SD: standard deviation.
Table 2.
| Treatment | Percentage of SubG1 |
|---|---|
| Untreated | 11.68 ± 1.20a |
| 0.5% DMSO | 14.93 ± 1.60a |
| EGCG | 14.48 ± 6.83a |
| ECG | 14.57 ± 7.67a |
| EGC | 12.31 ± 3.00a |
| C | 15.97 ± 3.62a |
Ten thousands PB-EPCs were seeded in each 12-well plate and treated with 12.5 µmol/L EGCG, ECG, EGC or C for 24 hours. After 24 hours, Apoptosis Assay was carried out as described in Experimental. Each treatment was done in triplicate. The apop-totic cells were determined on the basis of the SubG1 area. The data are presented as mean ± standard deviation.
Table 3.
| Treatment | CD34 (%) | CD133 (%) | VEGFR-2 (%) |
|---|---|---|---|
| Untreated | 52.86 ± 8.44b | 0.63 ± 0.02ab | 0.22 ± 0.02a |
| 0.5% DMSO | 28.96 ± 9.68a | 0.36 ± 0.14a | 1.78 ± 0.15c |
| EGCG | 51.09 ± 2.77b | 0.83 ± 0.41ab | 1.22 ± 0.19b |
| ECG | 60.48 ± 2.60b | 0.61 ± 0.08ab | 2.42 ± 0.13c |
| EGC | 54.70 ± 3.74b | 1.13 ± 0.71b | 1.21 ± 0.22b |
| C | 62.24 ± 9.22b | 1.01 ± 0.13ab | 1.47 ± 0.33bc |
Isolated-PB-MNCs were cultured with addition of 12.5 µmol/L EGCG, ECG, EGC or C. PB-EPCs Culture was then carried out as described in Experimental. PB-EPCs were then detached for Immunophenotyping as described in Experimental. Each treatment was done in triplicate. The data are presented as mean ± standard deviation.
Table 4.
| Treatment | ROS Level (%) | Ratio of All to Negative Control (%) | Ratio of All to Positive Control (%) |
|---|---|---|---|
| Untreated (negative control) | 7.20 ± 1.65a | 599.95 ± 22.97a | 22.81 ± 5.24a |
| H2 O2 (positive control) | 31.55 ± 1.10e | 438.15 ± 15.22e | 99.99 ± 3.47e |
| EGCG + H2 O2 | 12.92 ± 0.70c | 179.49 ± 9.67c | 40.96 ± 2.21c |
| ECG + H2 O2 | 10.83 ± 2.35bc | 150.46 ± 32.62bc | 34.34 ± 7.44bc |
| EGC + H2 O2 | 18.66 ± 2.81d | 259.21 ± 39.09d | 59.15 ± 8.92d |
| C + H2 O2 | 8.85 ± 1.13ab | 122.96 ± 15.73ab | 28.06 ± 3.59ab |
PB-EPCs were treated with 12.5 µmol/L of EGCG, ECG, EGC or C for 30 minutes. PB-EPCs were then treated with H2 O2 with final concentration of 200 µmol/L for 1 hour. Treated-PB-EPCs were subjected to Intracellular ROS Assay as described in Experimental. Each treatment was done in triplicate. The data are presented as mean±standard deviation.


 PDF
PDF ePub
ePub Citation
 Print
Print


 XML Download