Abstract
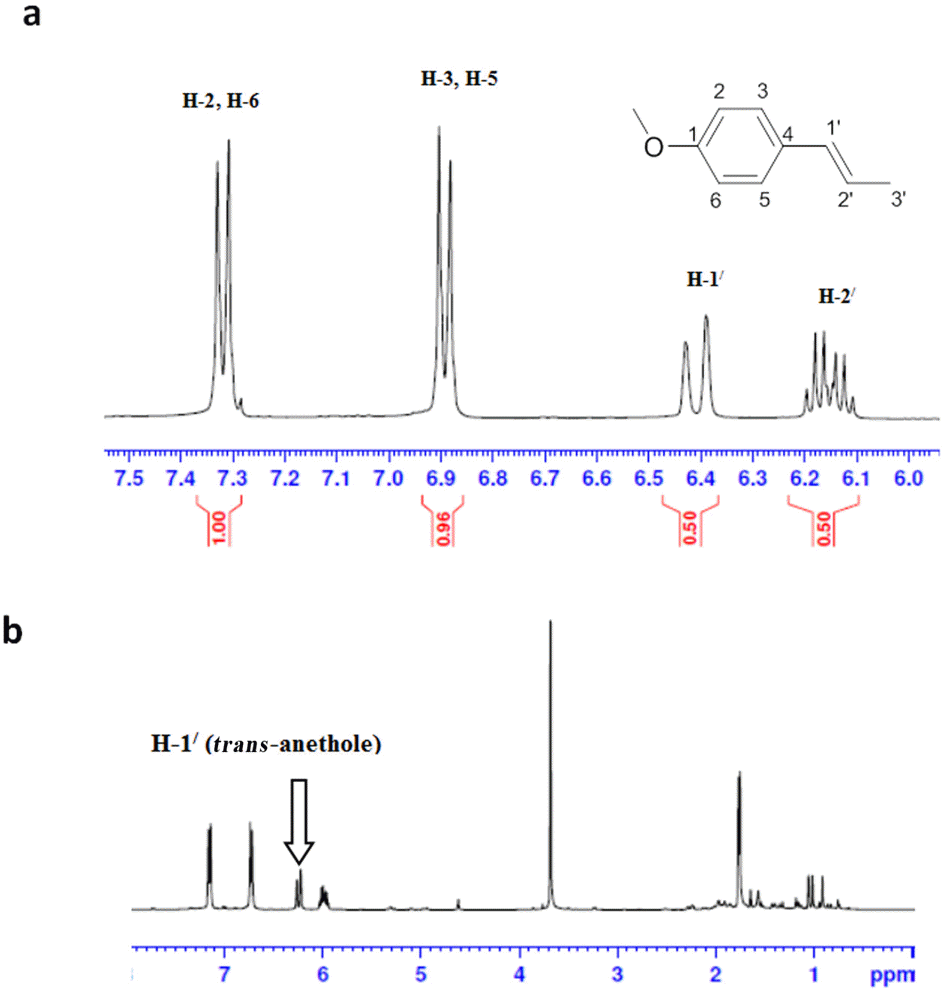
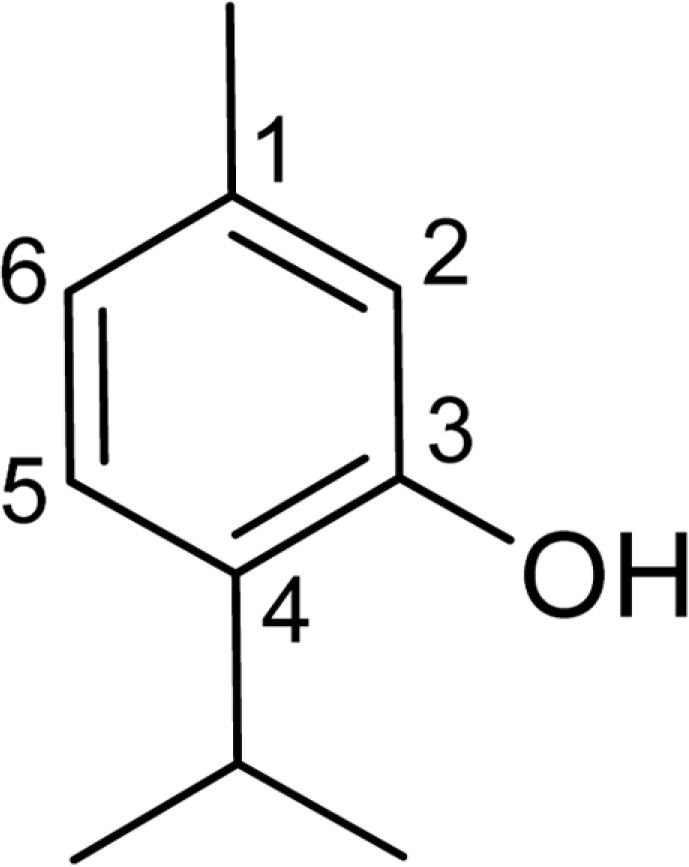
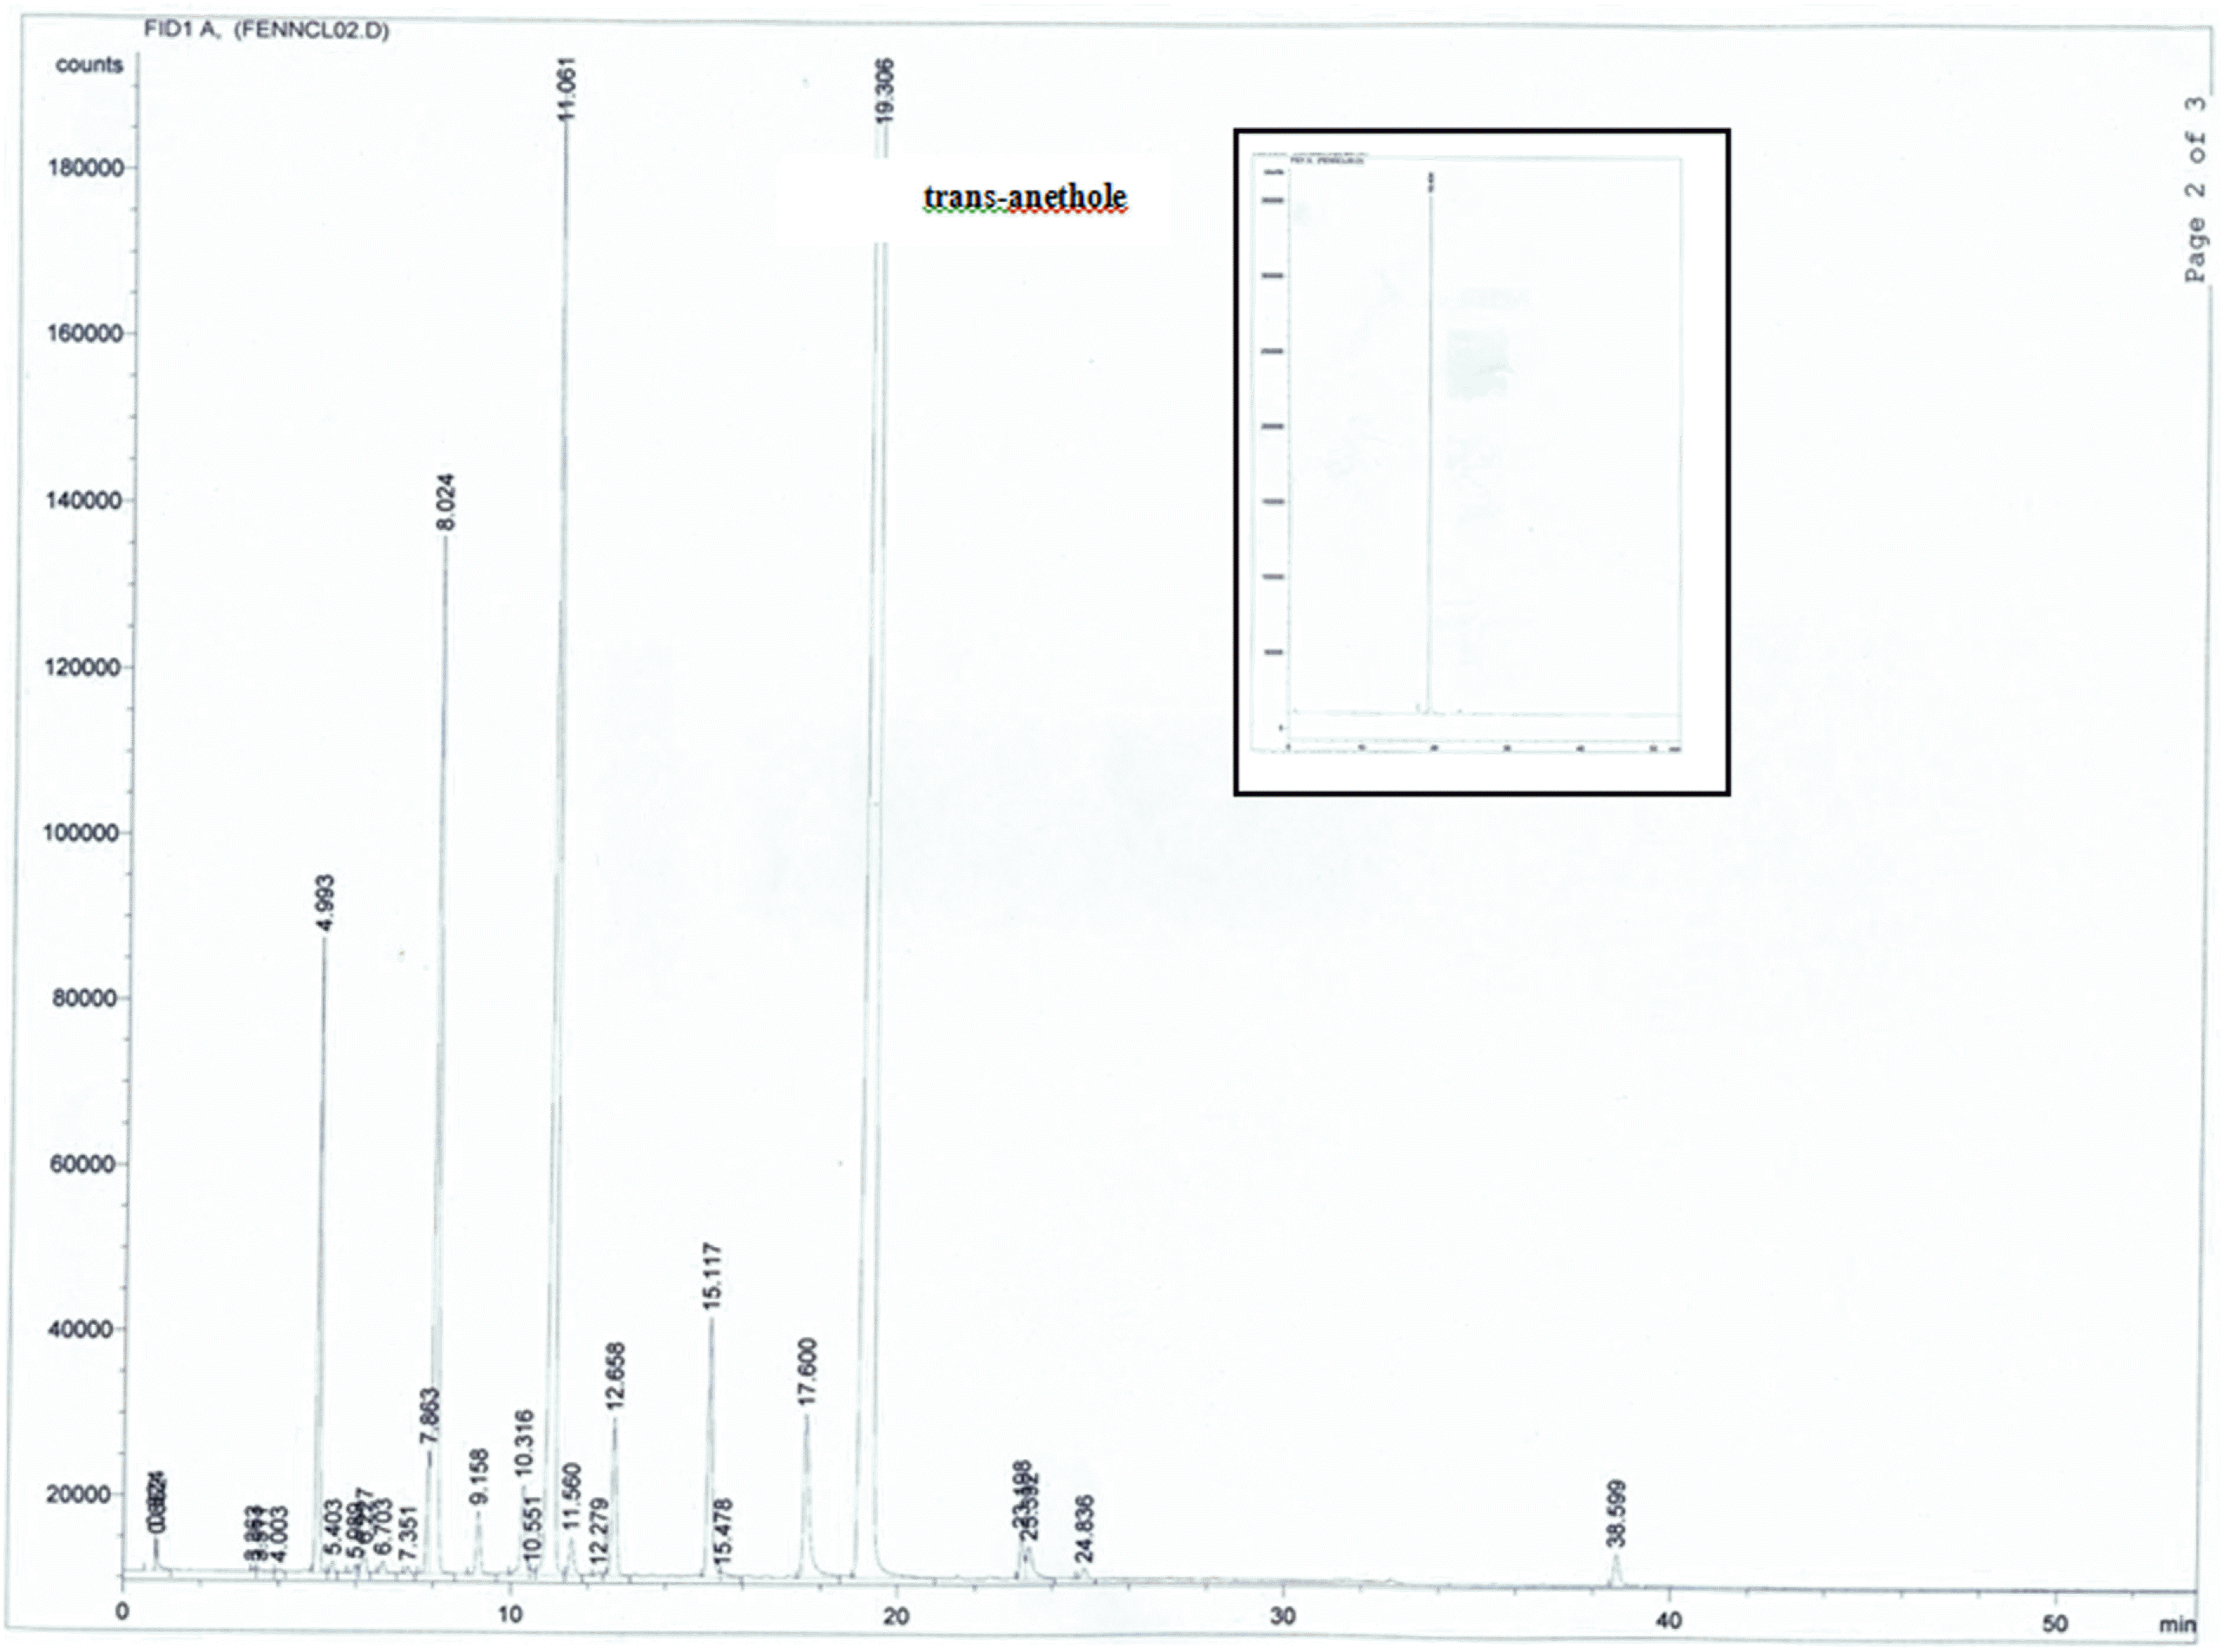
A simple and rapid method based on proton nuclear magnetic resonance spectroscopy was developed for determination of trans-anethole content in fennel essential oil. Spectra of pure trans-anethole, of the pure essential oil of fennel, and of the pure oil of fennel with thymol internal standard were recorded. The signal of H-1/ was used for quantification of trans-anethole. This proton signal is well separated in the proton magnetic resonance spectrum of the compound. No reference compound is needed and cheap internal standard was used. The results obtained from spectroscopic analysis were compared with those obtained by gas chromatography. Additionally, the developed method was used for determination of the type of vegetable oil used as a carrier in commercial products, which cannot be quantified as such by gas chromatography. This study demonstrates the application of proton nuclear magnetic resonance spectroscopy as a quality control method for estimation of essential oil components.
Go to : 
REFERENCES
(1). Boulos L.Flora of Egypt; Al Hadara Publishing: Egypt. 2000.
(2). Blumenthal I. J. R.Soc. Med. 2000; 93:172–174.
(3). Holt S., Muntyan I., Likver L.Alter. Complemen. Therap. 1996; 2:46–50.
(4). Hodgson I, Stewart J., Fyfe L. J.Essent. Oil Res. 1998; 10:293–297.
(5). Zoubiri S., Baaliouamer A.Food Chem. 2011; 129:179–182.
(6). Dadalioglu I., Evrendilek G. A. J.Agric. Food Chem. 2004; 52:8255–8260.
(7). Shahat A. A., Ibrahim A. Y., Hendawy S. F., Omer E. A., Hammouda F. M., Abdel-Rahman F. H., Saleh M. A.Molecules. 2011; 16:1366–1377.
(8). Senatore F., Oliviero F., Scandolera E., Taglialatela-Scafati O., Roscigno G., Zaccardelli M., De Falco E.Fitoterapia. 2013; 90:214–219.
(9). British Pharmacopoeia Commission. British Pharmacopoeia; The Stationary Office Ltd;London UK: 1998. p. 576–578.
(10). Howes M. J., Houghton P. J., Barlow D. J., Pocock V. J., Milligan S. R. J.Pharm. Pharmacol. 2002; 54:1521–1528.
(11). Raffo A., Nicoli S., Leclercq C.Food Chem. Toxicol. 2011; 49:370–375.
(12). Pauli G. F., Jaki B. U., Lankin D. C. J.Nat. Prod. 2005; 68:133–149.
(13). Strehle M. A., Rösch P., Baranska M., Schulz H., Popp J.Biopolymers. 2005; 77:44–52.
(14). Juliani H. R., Kapteyn J., Jones D., Koroch A. R., Wang M., Charles D., Simon J. E.Phytochem. Anal. 2006; 17:121–128.
(15). Alencar J. W., de Vasconcelos Silva M. G., Machado M. I. L., Craveiro A. A., de Abreu Matos F. J., de Abreu Magalhães R. J.Spectroscopy. 1997; 13:265–273.
(16). Formacek V., Kubeczka K. H.In Aromatic Plants World Crops: Production, Utilization and Description; Springer; Netherlands. 1982; 177–181.
(17). Cavalli J. F., Tomi F., Bernardini A. F., Casanova J.Phytochem. Anal. 2004; 15:275–279.
(18). Skakovskii E. D., Lamotkin S. A., Shpak S. I., Tychinskaya L. Y., Gaidukevich O. A., Lamotkin A. I. J.Appl. Spectrosc. 2006; 73:275–279.
(19). Friedman M. J.Agric. Food Chem. 2014; 62:7652–7670.
(21). Sacchi R., Patumi M., Fontanazza G., Barone P., Fiordiponti P., Mannina L., Rossi E., Segre A. L. J.Am. Oil Chem. Soc. 1996; 73:747–758.
Go to : 
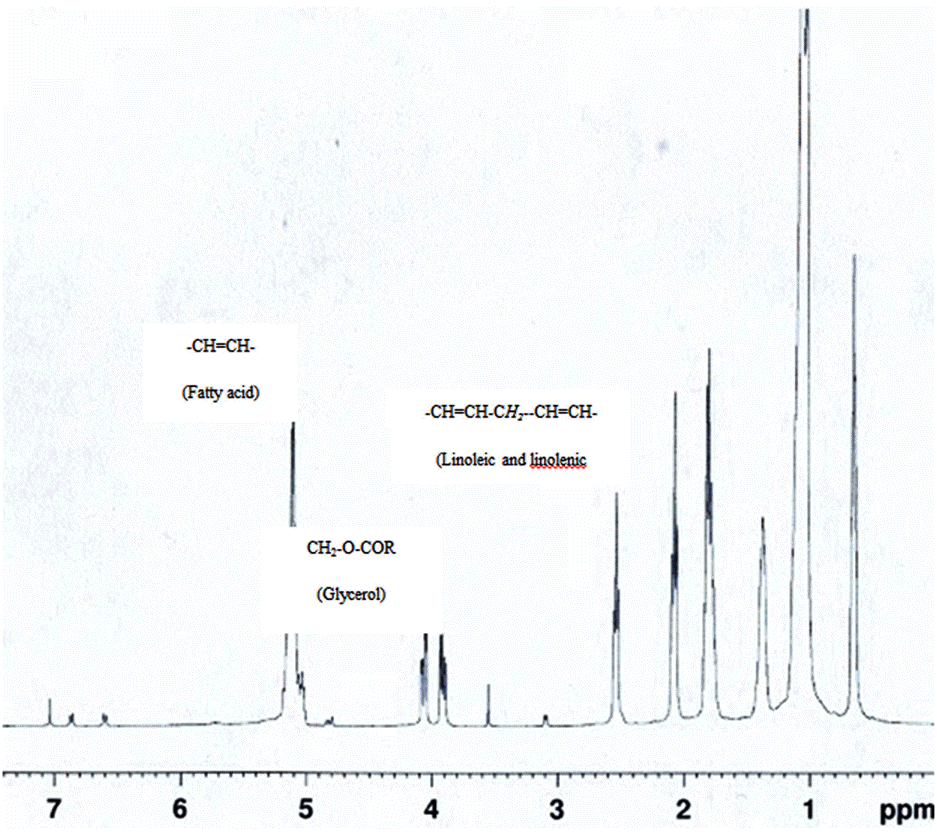
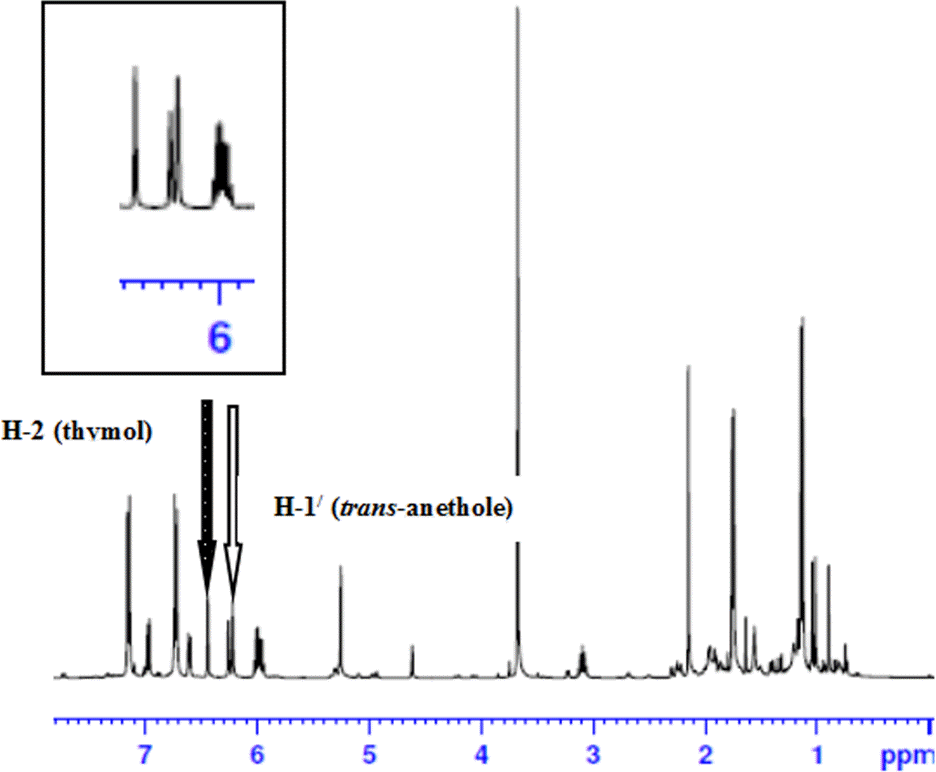 | Fig. 3.
1 H NMR spectrum of pure essential oil of fennel and thymol added as an internal standard. The inset shows the H-2 of thymol used as a reference peak for analysis. |


 PDF
PDF ePub
ePub Citation
 Print
Print


 XML Download