Journal List > Nat Prod Sci > v.22(4) > 1060636

Nugroho, Song, Seong, Choi, Choi, Choi, and Park: HPLC analysis of Phenolic Substances and Anti-Alzheimer's Activity of Korean Quercus Species

Abstract

This study aimed to establish the quantitative method to analyze the content of peroxynitrite-scavengers belonging to polyphenols in six Korean Quercus species (Quercus mongolica, Q. dentata, Q. acutissima, Q. alienta, Q. serrata, and Q. variabilis) by HPLC. The twelve peroxynitrite-scavengers, flavanols (catechins: (+)-catechin, (−)-epicatechin, and (−)-epigallocatechin), flavonols (kaempferol and quercetin), flavonol glycosides (astragalin, quercitrin, and isoquercitrin), flavonol acylated glycosides (astragalin 6''-gallate and isoquercitrin 6''-gallate), gallic acid and its dimer (ellagic acid) were analyzed by HPLC. Further, anti-Alzheimer's activity was assayed in a passive avoidance testusing mice by measuring the retention latency (sec), the concentration of acetylcholine (ACh), and acetylcholinesterase (AChE) activity. Simultaneous analysis of the extracts of the six Quercus leaves was achieved on a Capcell C18 column (5 µm, 250 mm × 4.6 mm i.d.) with a gradient elution of 0.05% HAc and 0.05% HAc in CH3CN. In the extract of Q. mongolica leaves, the content of gallic acid (32.53 mg/g), (+)-catechin (28.78 mg/g), (−)-epicatehin (22.03 mg/g), astragalin 6''-gallate (20.94 mg/g), and isoquercitrin 6''-gallate (44.11 mg/g) and peroxynitrite-scavenging activity (IC50, 0.831 µg/ml) were high. This extract delayed the retention latency and inhibited acetylcholinesterase activity in scopolamine-induced memory impairment of mice, suggesting that it has anti-Alzheimer's activity.

References

(1). Kim J. G.., Bae Y. S.Chemical constituents of domestic Quercus spp. Leaves. Mokchae Konghak. 2006. 34:61–71.
(2). Kuliev Z. A.., Vdovin A. D.., Abdullaev N. D.., Makhamatkulov A. D.., Matikov V. M.Chem. Nat. Prod. 1997. 33:642–652.
(3). Sakar M. K.., Söhretogu D.., Özalp M.., Ekizoglu M.., Piancente S.., Pizza C.Turk. J. Chem. 2005. 29:555–559.
(4). Zaveri N. T.Life Sci. 2006. 78:2073–2080.
(5). Patcher P.., Obrosova I. G.., Mabley J. G.., Szabó C.Curr. Med. Chem. 2005. 12:267–275.
(6). Zhang Y. J.., Xu Y. F.., Liu Y. H.., Yin J.., Li H. L.., Wang Q.., Wang J. Z.FASEB J. 2006. 20:131–142.
(7). Ortiz G. G.., Benítez-King G. A.., Rosales-Corral S. A.., Pacheco-Moisés F. P.., Velázquez-Brizuela I. E.Curr. Neuropharmacol. 2008. 6:203–214.
(8). Syad A. N.., Devi K. P.Bot. Targ. Ther. 2014. 4:11–26.
(9). Moniruzzaman M.., Asaduzzaman M.., Hossain M. S.., Sarker J.., Rahman S. M. A.., Rashid M.., Rahman M. M.BMC Complement. Altern. Med. 2015. 15:403–412.
(10). Nugroho A.., Rhim T. J.., Choi M. Y.., Choi J. S.., Kim Y. C.., Kim M. S.., Park H. J.Arch. Pharm. Res. 2014. 37:890–898.
(11). Kooy N. W.., Royall J. A.., Ischiropoulos H.., Beckman J. S.Free Radic. Biol. Med. 1994. 16:149–156.
(12). Van der Zee E. A.., Biemans B. A.., Gerkema M. P.., Daans S. J.Neurosci. Res. 2004. 78:508–519.
(13). Ellman G. L.., Courtney K. D.., Andres V. Jr.., Feather-stone R. M.Biochem. Pharmacol. 1961. 7:88–95.
(14). Hestrin S. J.Biol. Chem. 1949. 180:249–261.
(15). Chung H. Y.., Yokozawa T.., Soung D. Y.., Kye I. S.., No J. K.., Baek B. S. J.Agric. Food Chem. 1998. 46:4484–4486.
(16). Gimenez-Garzó C.., Urios A.., Agustí A.., González-López O.., Escudero-García D.., Escudero-Sanchis A.., Serra M. A.., Giner-Durán R.., Montoliu C.., Felipo V.Antioxid. Redox Signal. 2015. 22:871–877.
(17). Smith M. A.., Taneda S.., Richey P. L.., Miyata S.., Yan S. D.., Stern D.., Sayre L. M.., Monnier V. M.., Perry G. Proc. Natl. Acad. Sci. U. S.A. 1994. 91:5710–5714.
(18). Sayre L. M.., Zelasko D. A.., Harris P. L.., Perry G.., Salomon R. G.., Smith M. A. J.Neurochem. 1997. 68:2092–2097.
(19). Perry G.., Cash A. D.., Smith M. A. J.Biomed. Biotechnol. 2002. 2:120–123.
(20). Durairajan S. S.., Yuan Q.., Xie L.., Chan W. S.., Kum W. F.., Koo I.., Liu C.., Song Y.., Huang J. D.., Klein W. L.., Li M.Neurochem Int. 2008. 52:741–750.
(21). Feng Y.., Yang S. G.., Du X. T.., Zhang X.., Sun X. X.., Zhao M.., Sun G. Y.., Liu R. T.Biochem. Biophys. Res. Commun. 2009. 390:1250–1254.
(22). Zhang L.., Fiala M, Cashman J.., Sayre J.., Espinosa A.., Mahanian M.., Zaghi J.., Badmaev V.., Graves M. C.., Bernard G.., Rosenthal M. J.Alzheimers Dis. 2006. 10:1–7.
(23). Hwang E. M.., Ryu Y. B.., Kim H. Y.., Kim D. G.., Hong S. G.., Lee J. H.., Curtis-Long M. J.., Jeong S. H.., Park J. Y.., Park K. H.Bioorg. Med. Chem. 2008. 16:6669–6674.
(24). Descamps O.., Spilman P.., Zhang Q.., Libeu C. P.., Poksay K.., Gorostiza O.., Campagna J.., Jagodzinska B.., Bredesen D. E.., John V. J.Alzheimers Dis. 2013. 37:343–355.

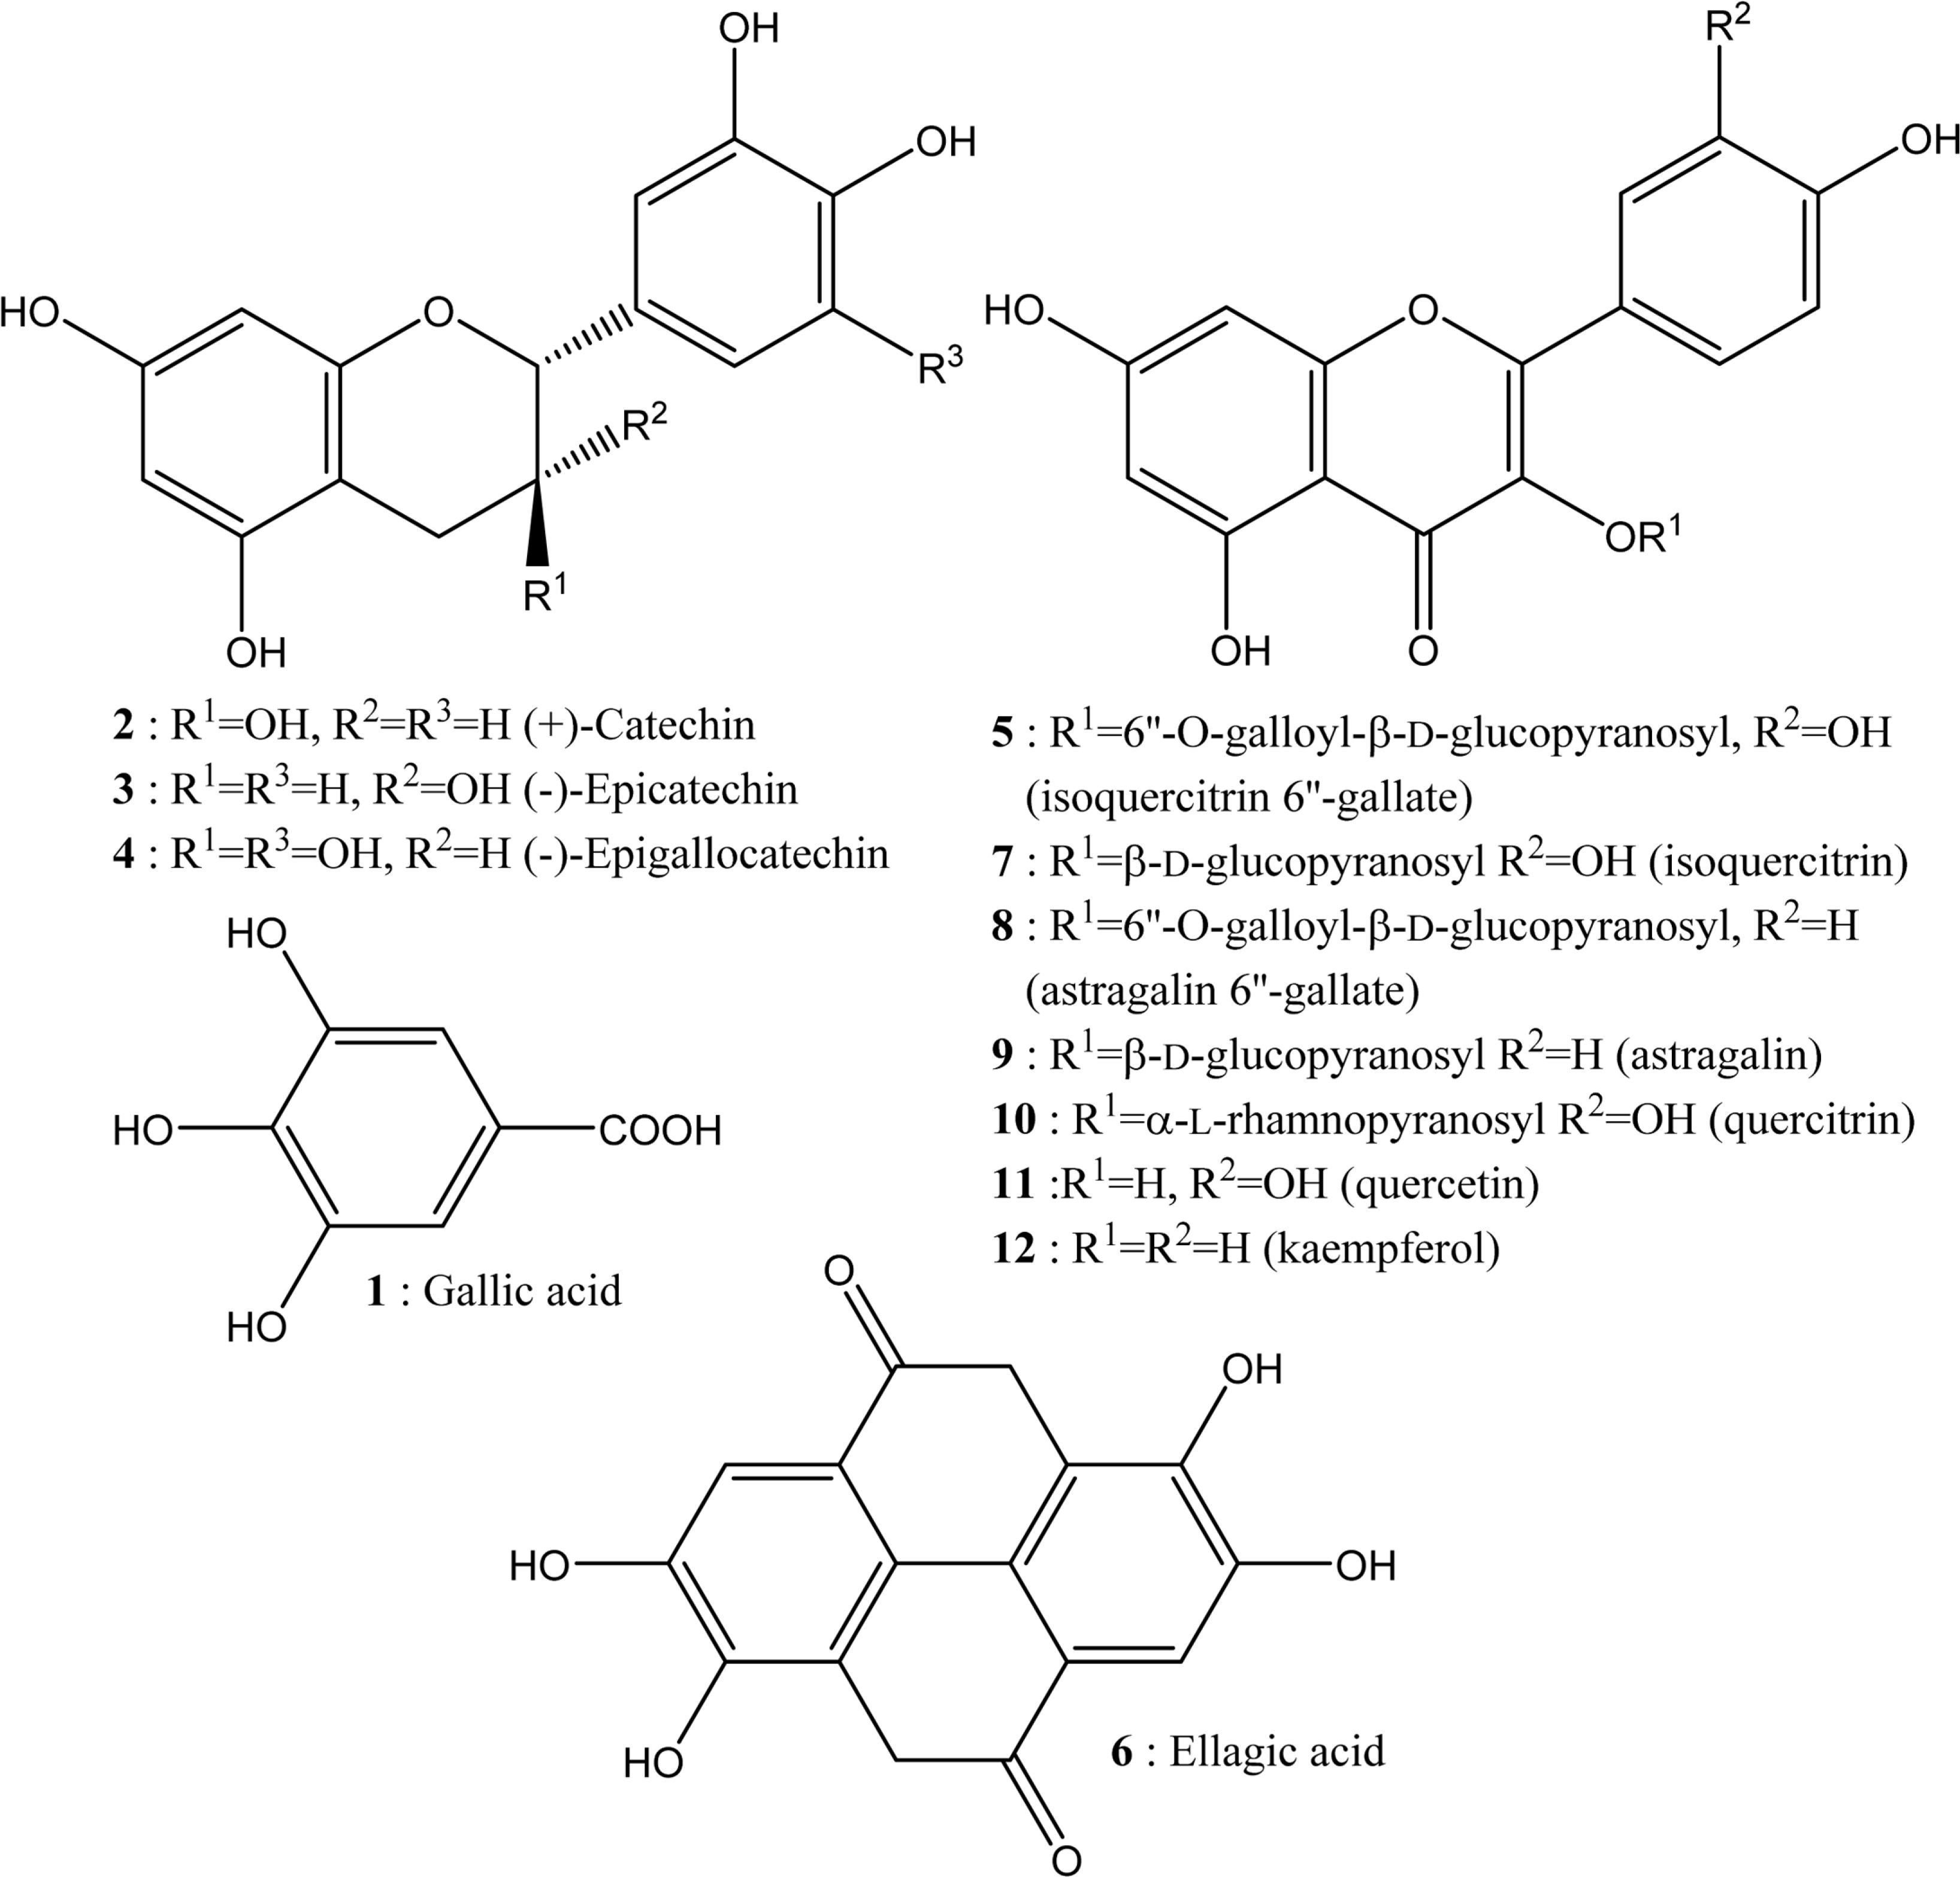
Fig. 1.
Structure of the twelve phenolic compounds used for the analysis of Quercus species.
nps-22-299f1.tif
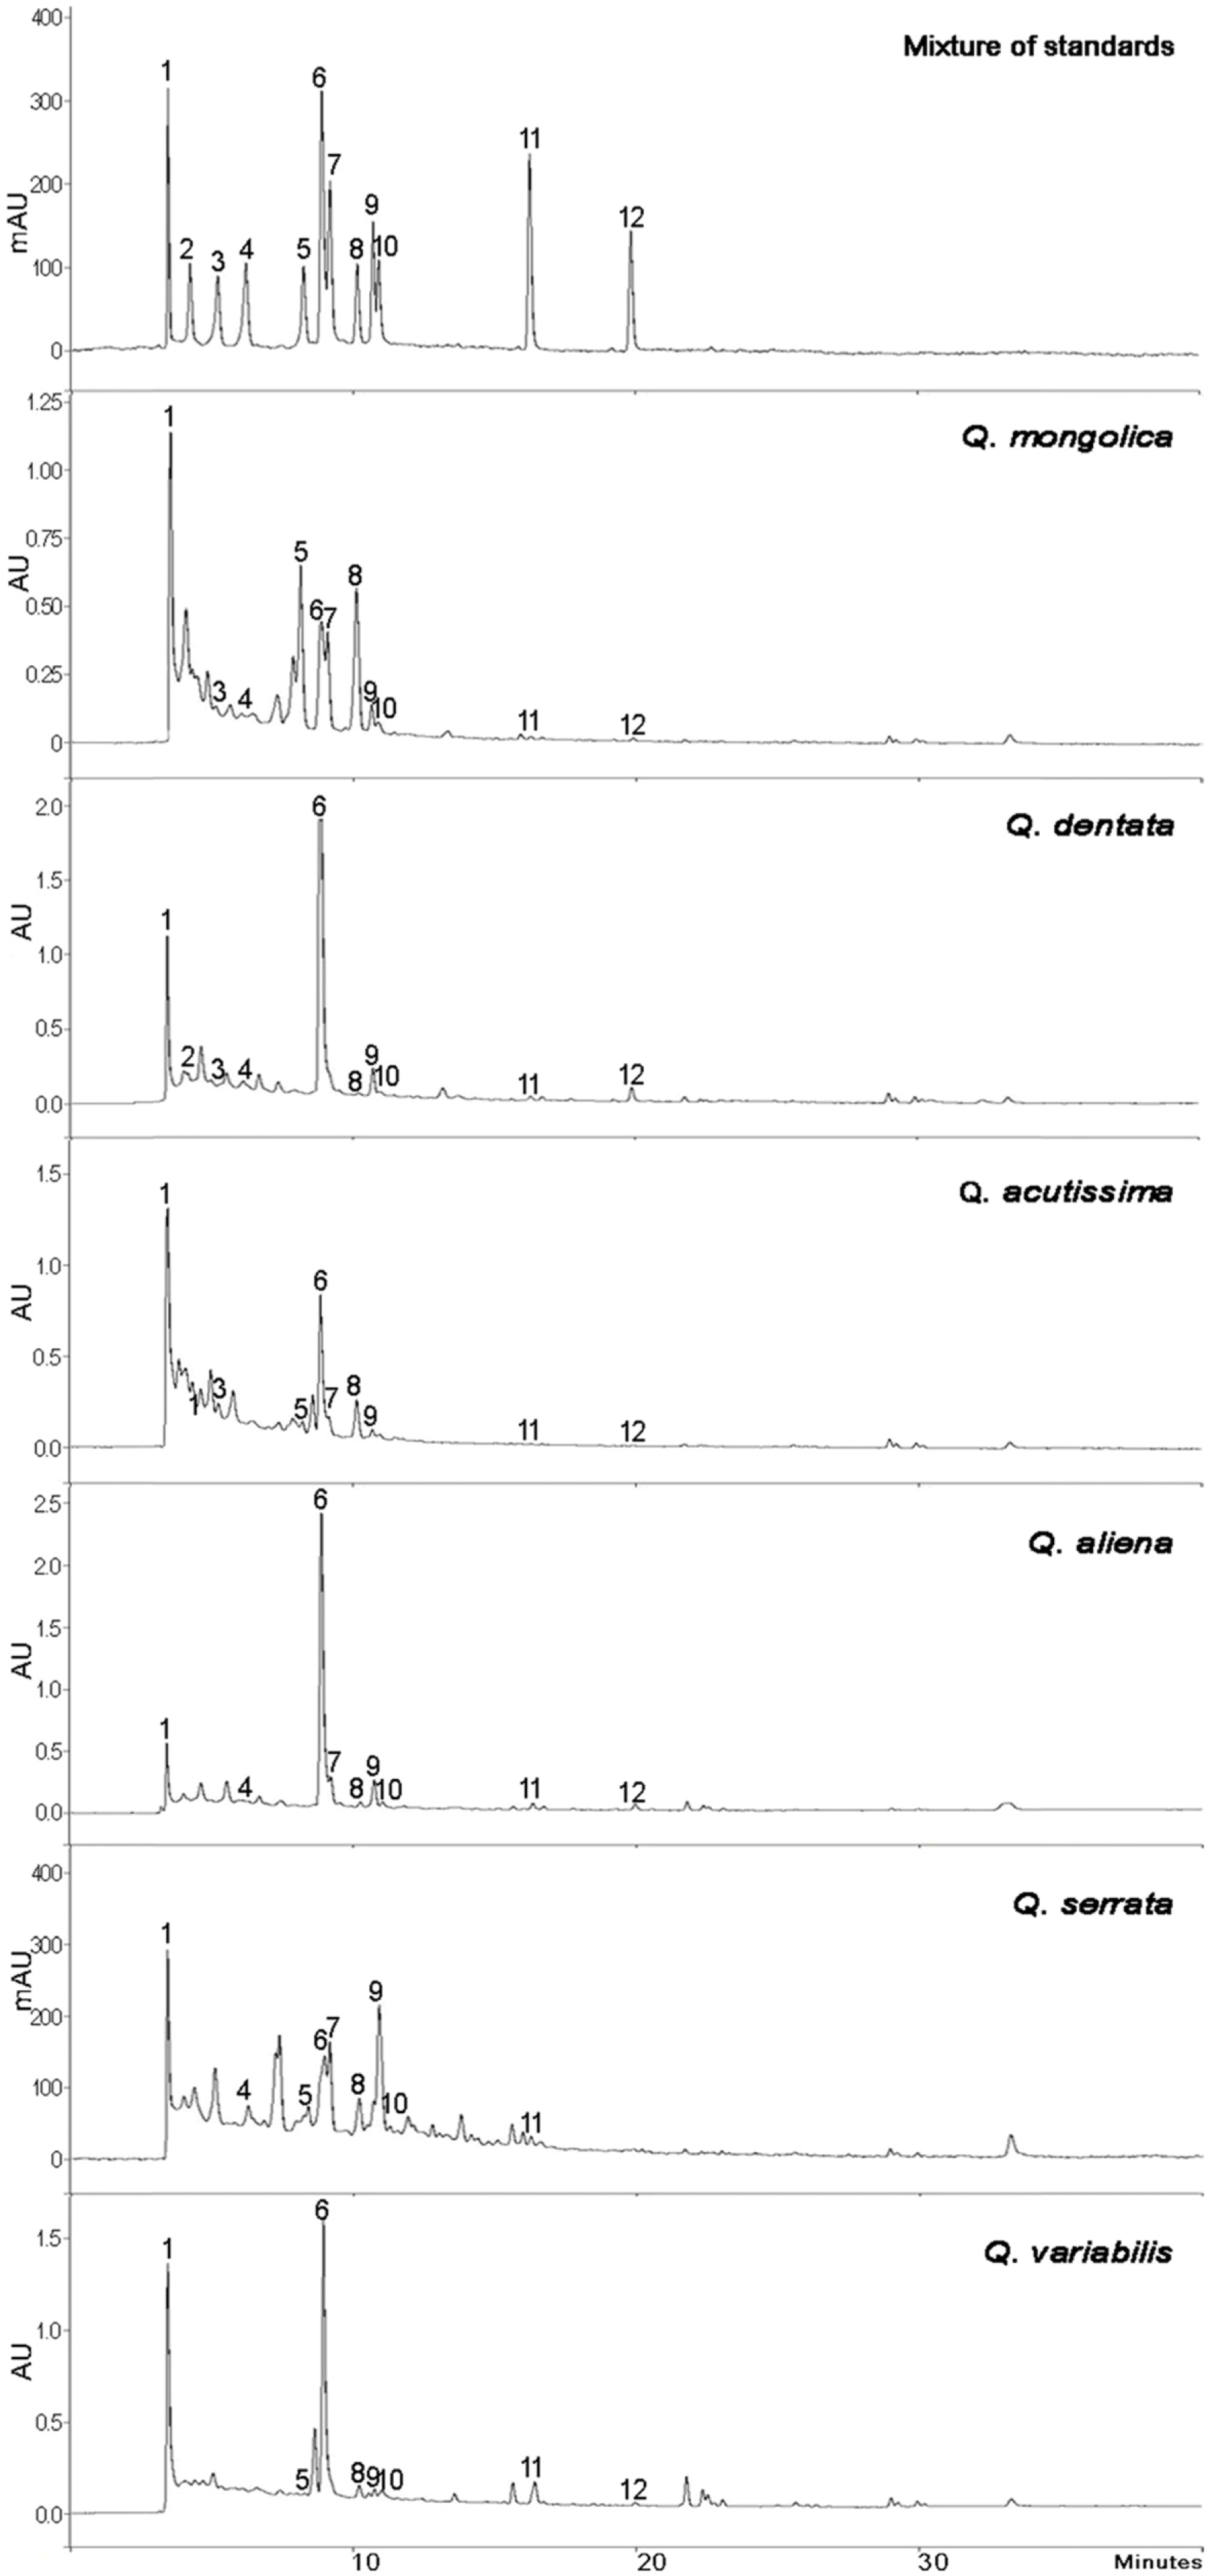
Fig. 2.
HPLC chromatograms of mixed standards and the extracts of six Quercus species.
nps-22-299f2.tif
Fig. 3.
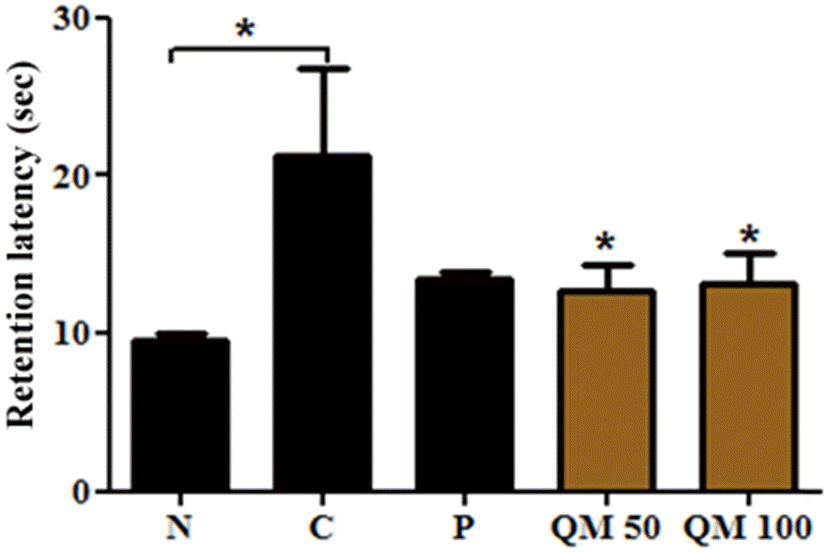
Effect of the extract of Q. mongolica leaves on the retention latency in passive avoidance test. QM 50 and QM 100 represent the group of mice treated with 50 and 100 mg/kg dose, respectively. The retention test was performed 24 h after the training trial. Normal group (N) of mice without any treatment (n = 5); Control group (C) was intraperitoneally injected with 1 mg/kg of scopolamine (n = 5); The positive control group (P) was injected with donepezil (x mg/kg); The two treatment groups, QM 50 and QM 100, were orally administered for 4 weeks before the training trial. Bars represent means ± SEM of retention latency. ∗ p < 0.05 vs. the C.
nps-22-299f3.tif
Fig. 4.
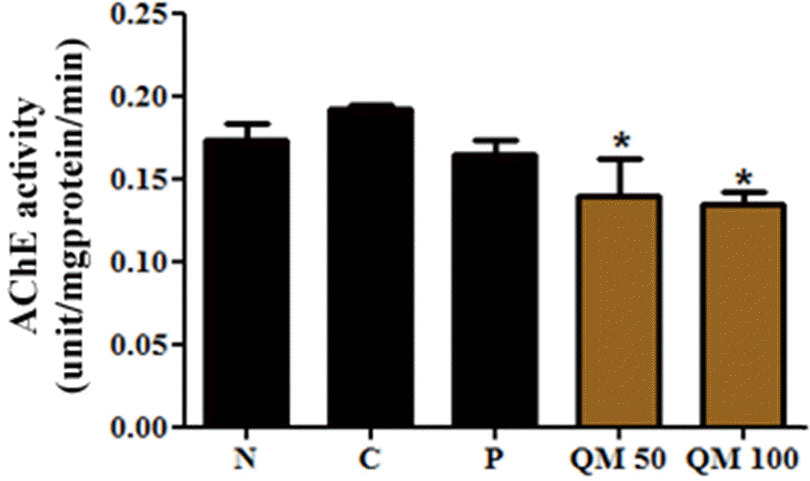
Acetylcholinesterase inhibitory activity of the extract of Q. mongolica leaves at the 50 (QM 50) and 100 mg/kg (QM 100) dose. Acetylcholinesterase inhibitory activity of the extract of Q. mongolica leaves at the 50 (QM 50) and 100 mg/kg (QM 100) dose. ∗p < 0.001 vs. C.
nps-22-299f4.tif
Fig. 5.
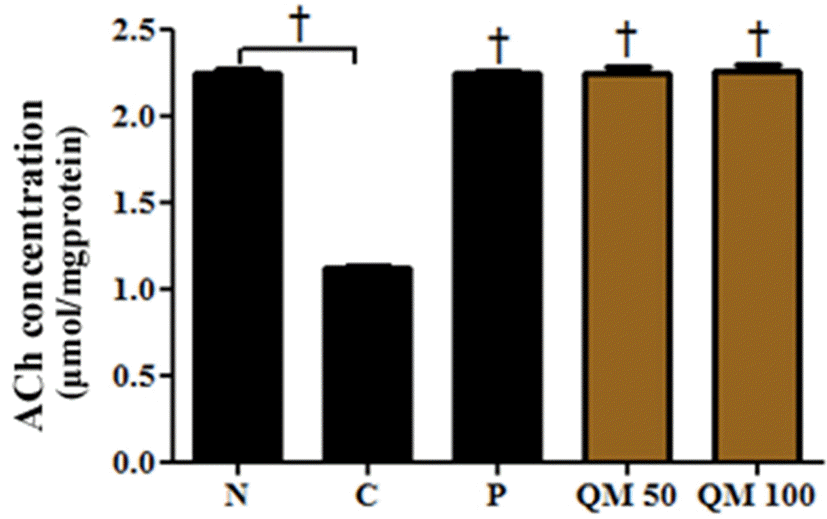
Effect of the extract of Q. mongolica leaves on the concentration of acetylcholine in scopolamine-treated mice. Effect of the extract of Q. mongolica leaves on the concentration of acetylcholine in scopolamine-treated mice. p < 0.001 vs. C.
nps-22-299f5.tif
Fig. 6.
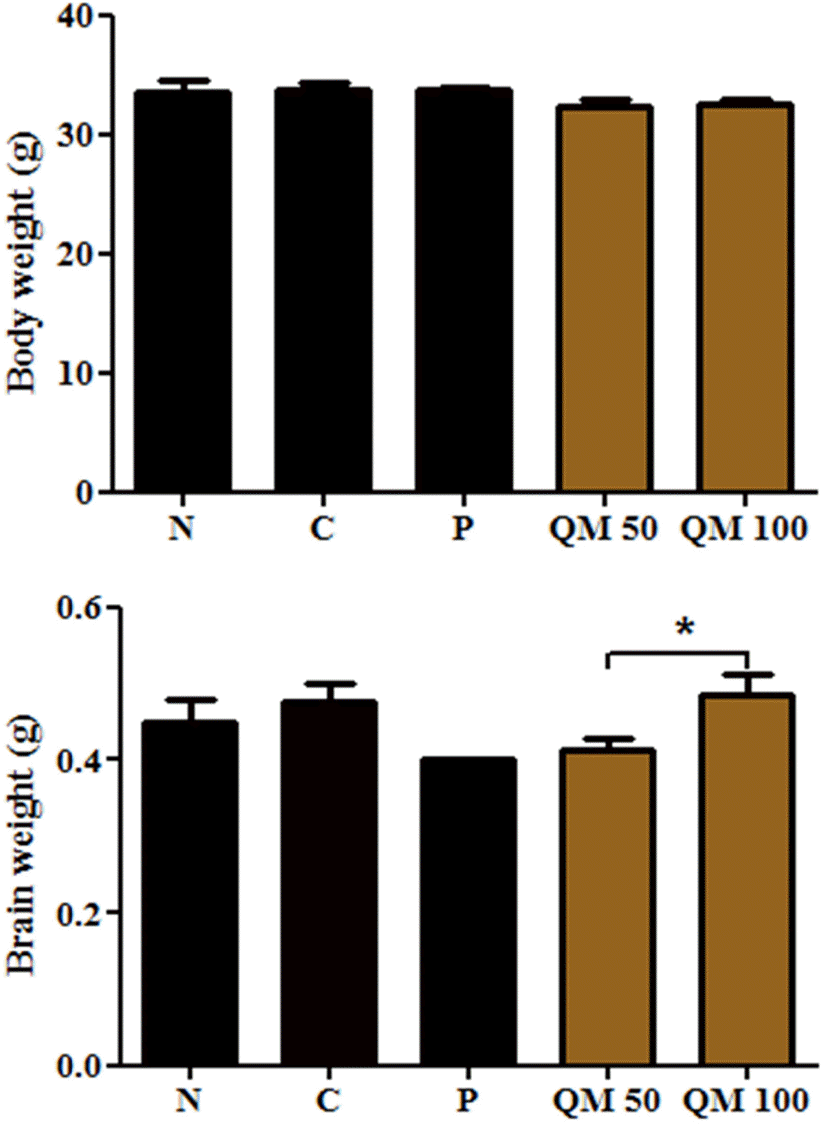
Effect of the extract of Q. mongolica leaves on body and brain weight in scopolamine-treated mice.
nps-22-299f6.tif
Table 1.
Linearity and limit of detection and quantification (LOD and LOQ) of the analytes
Compound Equation of the linear regressiona Linear range (µg/mL) R2 b tR LODc (µg/mL) LOQd (µg/mL)
Gallic acid (1) y = 321.92x + 78.01 3.13–100.0 0.9998 3.41 0.13 0.44
(−)-Epigallocatechin (2) y = 44.059x + 24.48 15.6–500.0 0.9996 4.21 2.17 7.23
(+)-Catechin (3) y = 43.089x + 30.85 15.6–500.0 0.9995 5.21 2.07 6.90
(−)-Epicatechin (4) y = 60.405x + 43.58 15.6–500.0 0.9996 6.21 1.26 4.21
Isoquercitrin6''-gallate (5) y = 166.69x + 73.31 3.13–100.0 0.9998 8.25 0.28 0.93
Ellagic acid (6) y = 1651.8x + 94.63 0.78–25.00 0.9991 8.94 0.03 0.10
Isoquercitrin (7) y = 472.75x + 75.62 1.56–50.00 0.9997 9.19 0.09 0.31
Astragalin 6''-gallate (8) y = 255.79x + 59.05 3.13–100.0 0.9998 10.17 0.24 0.80
Astragalin (9) y = 459.93x + 56.94 1.56–50.00 0.9997 10.72 0.14 0.50
Quercitrin (10) y = 456.52x + 72.11 1.56–50.00 0.9998 10.93 0.11 0.35
Quercetin (11) y = 663.43x + 79.10 1.56–50.00 0.9996 16.31 0.06 0.21
Kaempferol (12) y = 460.36x + 63.79 1.56–50.00 0.9997 19.89 0.12 0.41

a y, peak area at 254 nm; x, concentration of the standard (µg/ml);

b R2, correlation coefficient for 6 data points in the calibration curves (n = 3);

c LOD, limit of detection (S/N = 3);

d LOQ, limit of quantification (S/N = 10).

Table 2.
Recovery and precision data of each analyte
Compounds Recovery test Precision test
Initial conc. (µg/ml) Amount added (µg) Concentration after addition (µg/ml) Recovery (%) RSD (%) Intra-day variability RSD (%) Inter-day variability RSD (%)
Expect Real tR Area tR Area
Gallic acid 16.26 12.50 28.76 27.17 94.45 1.39 0.43 2.69 0.92 4.76
(−)-Epigallocatechin 9.240 15.63 24.87 23.06 92.71 2.81 0.41 4.15 0.89 6.12
(+)-Catechin 14.39 15.63 30.02 28.29 94.22 1.97 0.21 3.97 0.75 4.91
(−)-Epicatechin 11.02 15.63 26.64 24.81 93.12 2.45 0.19 3.24 0.63 4.28
Isoquercitrin 6''-gallate 22.06 25.00 47.05 45.81 97.35 0.57 0.15 2.54 0.67 4.21
Ellagic acid 1.685 1.560 3.245 3.397 104.69 2.01 0.14 1.54 0.51 2.92
Isoquercitrin 4.475 3.130 7.605 7.773 102.21 1.79 0.11 1.37 0.39 2.86
Astragalin 6''-gallate 10.47 12.50 22.97 22.62 98.47 0.51 0.09 0.66 0.41 1.17
Astragalin 1.260 1.560 2.820 2.712 96.18 1.53 0.08 0.76 0.25 1.23
Quercitrin 0.625 0.780 1.405 1.344 95.65 2.16 0.06 0.92 0.31 1.59
Quercetin 0.100 0.780 0.880 0.891 101.28 2.31 0.06 1.32 0.69 1.74
Kaempferol 0.105 0.780 0.885 0.904 102.15 2.49 0.08 1.45 0.78 2.18

Recovery tests were performed on the extract of Q. mongolica spiked with each standard compound except for (−)-epigallocatechin. The tests of (−)-epigallocatechin were performed on the extract of Q. dentata. Relative standard deviation (RSD) values of precision tests were calculated for both retention time (tR) and peak area of threeindependent experiments.

Table 3.
Amount of compounds in the leaf extracts (80% MeOH) of six Quercus species
Plant material Yield of extract (%) Amount of compounds in the extract (mg/g)
1 2 3 4 5 6 7 8 9 10 11 12 Total
Q. mongolica 24.8 32.53 28.78 22.03 44.11 3.37 8.95 20.94 2.52 1.25 0.20 0.21 164.90
Q. dentata 14.6 23.25 18.48 27.39 28.90 14.95 0.59 3.99 1.22 0.44 1.94 121.14
Q. acutissima 23.6 50.31 49.05 10.96 6.07 6.19 12.40 6.68 0.07 0.12 141.85
Q. aliena 12.6 18.70 19.85 16.04 6.44 2.96 6.69 1.73 1.04 1.36 74.81
Q. serrata 18.0 10.06 20.01 2.91 1.56 3.15 2.44 1.65 6.34 0.19 48.33
Q. variabilis 9.80 37.94 6.26 7.42 2.63 0.97 1.37 2.07 0.28 58.95

The sign (−) indicates that the compound cannot be quantified (< LOQ) or not detected (< LOD) under 254 nm UV wavelength. Compounds: 1 (gallic acid), 2 ((−)-epigalocatechin), 3 ((+)-catechin), 4 ((−)-epicatechin), 5 (isoquercitrin 6''-gallate), 6 (ellagic acid), 7 (isoquercitrin), 8 (astragalin 6''-gallate), 9 (astragalin), 10 (quercitrin), 11 (quercetin), and 12 (kaempferol).

Table 4.
Peroxynitrite-scavenging effect of the leaf extracts of six Quercus species
Extract Concentration (µg/ml) IC50 µg/ml
0.08 0.4 2 10
Q. acutissima 12.41 ± 0.46a 31.07 ± 0.45 67.37 ± 0.18 91.93 ± 0.27 1.316 ± 0.011
Q. alienta 16.76 ± 2.67 32.84 ± 3.54 59.19 ± 2.00 88.37 ± 0.12 1.503 ± 0.117
Q. dentata 12.41 ± 0.98 20.59 ± 2.06 56.07 ± 0.62 89.01 ± 0.07 1.727 ± 0.037
Q. mongolica 31.06 ± 0.01 48.02 ± 0.62 70.68 ± 0.21 87.55 ± 0.36 0.831 ± 0.015
Q. serrata 57.81 ± 1.04 24.23 ± 1.21 57.10 ± 0.65 87.63 ± 0.25 1.672 ± 0.012
Q. variabilis 15.49 ± 1.19 24.29 ± 0.36 63.59 ± 0.07 89.35 ± 0.15 1.451 ± 0.001
L-penicillamine 38.92 ± 0.07 73.74 ± 0.86 91.37 ± 0.07 0.910 ± 0.015

a Valuerepresents the mean ± SEM (n = 2).

TOOLS
Similar articles