

 PDF
PDF ePub
ePub Citation
 Print
Print


Introduction
Breast cancer is one of the most frequently diagnosed cancers and became a second leading cause of death among women after lung cancer.12 Breast cancer is closely related with the lack or complete loss of critical component of caspase-3. Caspase-3 plays a key role in the death receptor pathway, which initiated by caspase-8 and the mitochondrial pathway which involving caspase-9.3 Therefore, the execution phase of apoptosis involves the activation of a series of caspases which are caspase-9 as the upstream caspase for the intrinsic pathway while caspase-8 in extrinsic pathway and caspase-3 in both intrinsic and extrinsic pathways. However, normal expression level of caspase-8 and caspase-9 were shown in MCF-7 cells. PUMA also plays an important role in apoptosis process. PUMA known as p53 unregulated modulator of apoptosis, is a potent pro-apoptotic molecule which is initially identified as a gene activated by p53 in cells undergoing p53 induced apoptosis. All genes used in this study are the pro-apoptotic which induced apoptosis. PUMA, caspase-8 and caspase-9 genes were used in this study except for caspase-3 because the MCF-7 cell line does not express caspase-3 due to deletion of cas-3 gene.4
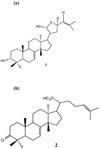
The plant-derived triterpenoids commonly used due to its ability to exhibit cytotoxicity against a variety of tumor cells. Our previous publication reported isolation of flindissol (compound 1) (Fig. 1(a)) and 3-oxotirucalla-7,24-dien-21-oic acid (compound 2) (Fig. 1(b)) from L. scandens exhibited cytotoxic activity assayed by MTT technique. It was found that the inhibitory activities (IC50) of compound 1 and 2 were 13.8 µM and 27.5 µM, respectively.5 In this paper, the study has been extended with the flow cytometric analysis of apoptotic cells and quantitative RT-PCR to determine cell cycle regulation after treatment with compound 1 and 2.
Experimental
Cell culture
Human breast adenocarcinoma (MCF-7) cell line was courtesy by Prof. Masa-Aki Ikeda of Tokyo Medical and Dental University, Tokyo. MCF-7 cell line was cultured in Dulbecco's modified Eagle's medium (DMEM) supplemented with 10% fetal bovine serum (FBS) and 1% penicillin-streptomycin (Gibco, US) and incubated at 37 ℃ in a humidified atmosphere containing 5% CO2. Cells were treated with the IC50value of each compound. Doxorubicin, an anticancer chemotherapy drug was used as a positive control.
Cell Cycle Analysis
The cells were cultured in 25 cm2 T-flask to 85% confluence. And then treated with the compound 1 and 2 (13.8 and 27.5 µM, respectively) for 24 h at 37 ℃. The total populations of floating and adherent cells were collected and centrifuged at 900 g at 4 ℃ for 5 min. The cells were washed with PBS and fixed with 75% cold ethanol. Cells in cold ethanol were centrifuged and washed with PBS to collect the cells' pellet. The cells' pellet were suspended in PBS containing 50 µg/mL Propidium Iodide (PI) (Invitrogen), 0.2 mg/mL RNase A (Sigma) and 0.1% Triton X-100 (Fisher Scientific), and incubated at 37 ° for 30 min. Cell cycle profiles were analysed using Guava® easyCyte flow cytometer (Merck Millipore).
mRNA expression studies in MCF-7 cells by quantitative RT-PCR Reverse Transcription
The expression of apoptosis-related genes, such as PUMA, caspase-8 and caspase-9 were determine by RT-PCR. Total RNA isolation was done using TRIzol® reagent (Invitrogen, USA). Single-stranded cDNA was synthesized from 2 µg total RNA using Omniscript reverse transcriptase (Qiagen). 1 µL reverse transcriptase was required to equal 2 µg of cDNA in 20 µL of reaction volume. The cDNA was determined at 4 µg per reaction, thus reverse transcriptase needed was 2 µL. Briefly, 4 µL of 10×Qiagen one step RT-PCR buffer was added followed by addition of 4 µL of dNTP mix. 0.4 µL of each Oligo-dT primer was added and then 2 µL of Omniscript reverse transcriptase was added. Finally, PCR grade RNAse–free water was added to make total volume of 40 µL and Mixed it gently by vortex and centrifuged in PCR tubes.
Quantitative RT-PCR
RT-qPCR analysis was performed with Quantitect SYBR® Green PCR (Qiagen) kit, in a Corbett Rotor-Gene 6000. 4 µL of RNase-free water was added followed by 7 µL of 2× QuantiTech SYBR Green PCR master mix. 1 µL and 2 µL of primer mix and cDNA was added respectively to a final volume of 14 µL. Each sample was performed in triplicate. Each cycle included an initial denaturation (predenaturation) step of 15 min at 95 ℃. Denaturation step at 95 ℃ for 10 sec except PUMA, 95 ℃ for 40 sec. Annealing at 60 ℃ for 30 min for β-actin, 55 ℃ for 40 min for PUMA, 61 ℃ for 30 min for caspase-8 and caspase-9. A final extension step was performed in order to complete the PCR reaction, at 72 ℃ for 30 min (β-actin, caspase-8 and caspase-9) and 73 ℃ for 10 min (PUMA). 50 amplification cycles were performed for β-actin and PUMA, and 55 cycles for caspase-8 and caspase-9. The oligonucleotide primer pairs for RT-PCR used in this study were: PUMA, 5′-GACC TCAACGCACAGTACGA-3′ (forward) and 5′-GAGAT TGTACAGGACCCTCCA-3′ (reverse); caspase-8, 5′-CAT CCAGTCACTTTGCCAGA-3′ (forward) and 5′-GCATC TGTTTCCCCATGTTT-3′ (reverse); caspase-9, 5′-TTCC CAGGTTTTGTTTCCTG-3′ (forward) and 5′-CCTTTC ACCGAAACAGCATT-3′ (reverse); β-actin, 5′-ATCCG TAAAGACCTCTATGC-3′ (forward) and 5′-AACGCAG CTCAGTAACAGTC-3′ (reverse). The relative amplification was quantitated through comparison to the expression of β-actin as an internal standard. The results were compared with untreated cells using comparative Ct methods (2−ΔΔCt).
Statistical Analysis
The data were analyzed statistically by comparison of experimental samples of the same treatment conditions as a group with untreated cells and presented as mean standard error (SE). Data were subjected to Student's t-test for the determination of level of significance and results were considered significant, if *p < 0.05, **p < 0.01, ***p < 0.001.
Results and Discussion
Cell Cycle Analysis
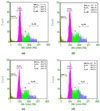
Cell cycle distributions were analyzed by flow cytometry technique. Treated cells with IC50 values of compounds 1 (13.8 µM) and 2 (27.5 µM) increased of the cell population at sub G1 (M4) phase. In this phase, apoptotic cells were quantified as proportion of cells that had a DNA content less than 2n due to the detection of fragmented DNA. Table 1 illustrates the changes in the cell cycle distribution of MCF-7 cells treated with compounds 1 and 2 as compared with doxorubicin and untreated cells.
From the results, both compounds induced a significant increase apoptosis at sub G1 phase in MCF-7 cells after 24 h of treatment. The number of MCF-7 cells population which undergoing apoptosis after the treatment with IC50 values of compound 1 (13.8 µM) and 2 (27.5 µM) were found to be 7.7 and 9.3%, respectively (Fig. 2(a) and 2(b)). Whereas, doxorubicin as positive control drug was 10.3% and 2.7% for untreated cells (Fig. 2(c) and 2(d)). At G0/G1 phase, both compounds, 1 and 2, influenced the number of cells to 46 and 41.1% respectively and with a concomitant decrease in the number of cells in S phase to 24.4 and 26.5% respectively. At G0/G1 phase, DNA content remained diploid (2n) and started to replicate at S phase to become 4n. Thus, DNA contents in this phase were in the range of 2n-4n. Distribution of cells at G2/M phase for 1 and 2 were 15.6 and 17.3% respectively where DNA content remained 4n due to the completion of DNA synthesis and started to decrease to 2n after cytokinesis.
mRNA expression studies in MCF-7 cells by quantitative RT-PCR
To elucidate cell death signaling pathway activated by compounds 1 and 2 in MCF-7 cells, RT-qPCR analysis was used to measure the mRNA expressions of pro-apoptotic genes PUMA, caspase-8 and caspase-9.
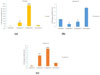
PUMA or p53 upregulated modulator of apoptosis is an essential mediator of p53-dependent and –independent apoptosis.6 Indeed, the exogenous expression of PUMA rapidly induced apoptosis in a variety of human cancer cells.78 From the results of this study, compound 2 showed the higher expression on PUMA gene as compared to compound 1 with the fold change of mRNA level of 168.9 and 28.6, respectively. Fig. 3(a) represents the fold changes of mRNA level of PUMA normalized to β-actin. Thus, with the results of PUMA expression, it is proved that both compounds may induce apoptosis.
Caspase-8 is one of the initiator caspases that is closely coupled to pro-apoptotic signals, activated via extrinsic pathway. This pathway activated by engagement of transmembrane receptors by its ligands. Upon ligand binding to death receptor, their cytoplasmic death domain attract adaptor molecule and initiate a caspase cascade. The existence of different receptor/ligand pairs lead to the activation of caspase-8. Once caspase-8 is activated, it cleaves and activates downstream effector caspase including caspase-3, -6 and -79 which shows the importance of caspase-8 in apoptosis pathway. The study also analyzed the mRNA expression level in caspase-8 on MCF-7 cell lines treated with compounds 1 and 2. The results showed the increased caspase-8 expression. Fig. 3(b) represents fold change of mRNA level of caspase-8 normalized to β-actin. Compound 2 showed the higher expression on caspase-8 gene as compared to compound 1 with the fold change of mRNA level of 0.67 and 0.36, respectively. However, both compounds showed lower expression compared to untreated and positive control.
Compound 1 and 2 increased ofcaspase-9expression towards MCF-7 cell lines. Fig. 3(c) represents fold change of mRNA level of caspase-9 normalized to β-actin. Compound 2 showed the higher expression on caspase-9 gene as compared to compound 1 with the fold change of mRNA level of 38.5 and 23.5, respectively. As mentioned before, caspase-9 also acts an as initiator caspase which appears to be the first caspase in activation of others. With activation of caspase-9 by procaspase-9, it triggers caspase cascade by activating the effector caspase-3, -6 and -7.8 Hence, it cause morphological and biochemical damages with eventual apoptosis cell death.
The evaluation of gene expression as an evident of apoptosis induction showed that both compounds exhibited high level of all genes including PUMA, caspase-8 and caspase-9 expression as normalized to β-actin via activation of those genes. Thus, both compounds may induce apoptosis in MCF-7 cells by increasing the PUMA and subsequently triggering apoptosis via intrinsic pathway involving caspase-8 and caspase-9 genes. However, the involvement of autophagy pathway must be highlighted due to the lack normal caspase-3 gene in this cell line.
The deficiency of caspase-3 gene due to a deletion mutation in exon 3 of MCF-7 cell line may not be appropriate to evaluate the effects of compounds on apoptotic induction. Thus, the involvement of autophagy may also constitute in the programmed forms of cells death. Autophagy involves in the etiology of many important human disease including cancer, neurodegenerative disease and metabolic disorders. ATP depletion due to the metabolic stress may cause increase of intracellular calcium and reactive oxygen species (ROS). Cells that do not adapt to these changes may undergo necrotic cell death. However, the activation of protective stress regulators such as adenosine monophosphate-activated protein kinase (AMPK), allow cells to survive these changes. AMPK-dependent phosphorylation activates p53 which leads to autophagy or apoptosis through the activation of Bax and Bak, the mitochondrial release cytochrome c and caspase activation. Stress-induced autophagy may promote cell survival or cell death.10
Regulation function of p53 is involved in apoptosis and autophagy pathways. Activation of p53 contributes to apoptosis induction mostly via transcription-dependent effects. On the other hand, the involvement of p53 in autophagy may either activate or repress autophagy depending on cellular energy status and the contextual activation of other signaling pathways. Several p53 target genes stimulate autophagy for instance damage-regulated autophagy modulator (DRAM), a p53 target gene encoding a lysosomal protein induces autophagy. The localization of p53 is a key regulator of p53-induced apoptosis and autophagy.11 With the realization of the lack of caspase-3 due to a deletion mutation in exon 3 of MCF-7 cell line may not be appropriate to evaluate the effects of compounds on apoptotic induction. Thus, the involvement of autophagy may also constitute in the programmed forms of cells death. Therefore, further researches must be done using these compounds in order to identify the cell death pathway either via apoptosis or autophagy.

 XML Download