Abstract
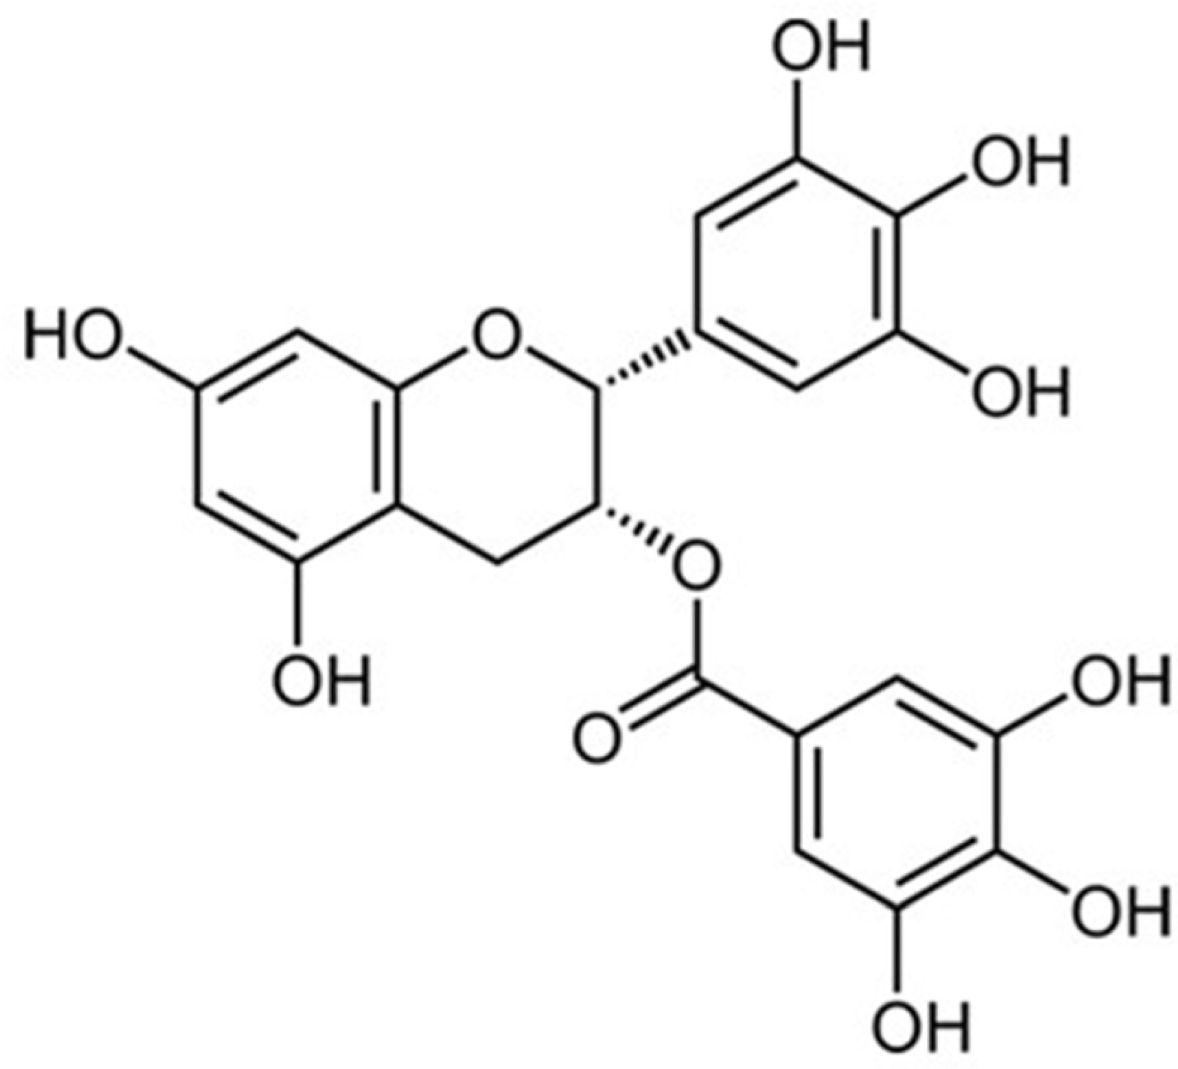
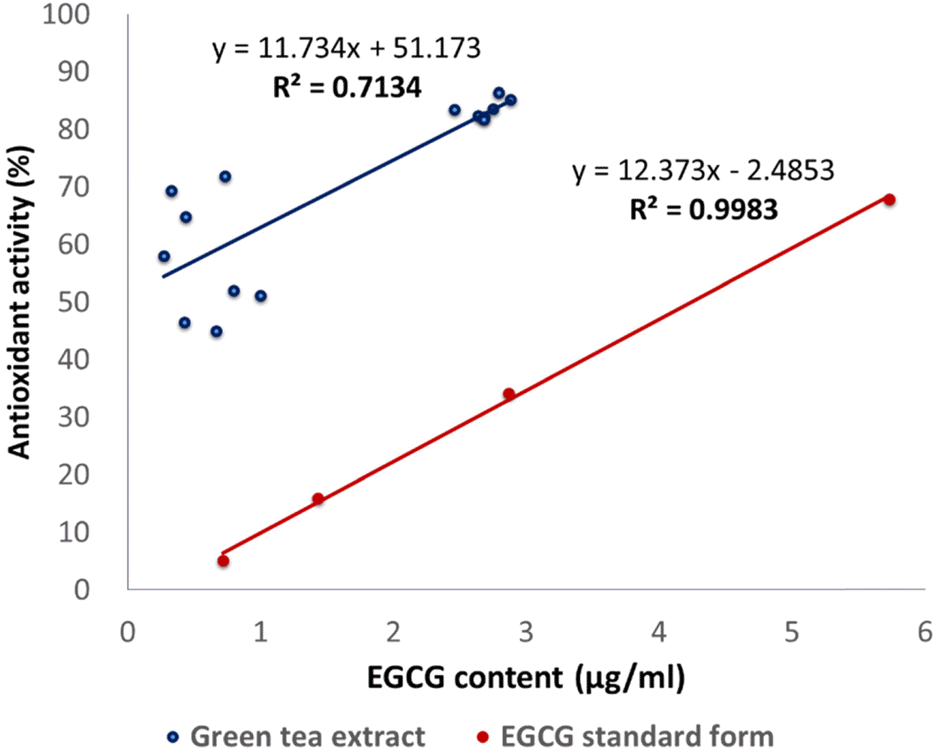
Green tea, the leaves of Camellia sinsneis (Theaceae), is generally acknowledged as the most consumed beverage with multiple pharmacological functions including antioxidant activity. This study was performed to analyze the effect of extraction conditions of green tea on its antioxidant effects using DPPH assay. Three extraction factors such as extraction solvent (EtOH, 0 – 100%), extraction time (3 – 15 min) and extraction temperature (10 – 70oC) were analyzed and optimized extraction condition for antioxidant activity of green tea extract (GTE) was determined using response surface methodology with three-level-three-factor Box-Behnken design (BBD). Regression analysis showed a good fit of data and the optimal conditions of extraction were found to be 57.7% EtOH, 15 min and 70oC. Under this condition, antioxidant activity of experimental data was 88.4% which was almost fit to the ideal value of 88.6%. As epigallocatechin gallate (EGCG) is known for the major ingredient for antioxidant activity of green tea, we investigated the effect of EGCG on antioxidant activity of GTE. EGCG showed antioxidant activity with the IC50 value of 4.2 µg/ml and a positive correlation was observed between EGCG content and the antioxidant activity of GTE with R² = 0.7134. Interestingly, however, GTE with 50 – 70% antioxidant activity contain less than 1.0 µg/ml of EGCG, which is much lower than IC50 value of EGCG. Therefore, we suppose that EGCG together with other constituents contribute to antioxidant activity of GTE. Taken together, these results suggest that green tea is more beneficial than EGCG alone for antioxidant ability and optimal extraction condition of green tea will be useful for the development of food and pharmaceutical applications
Go to : 
References
(1). Zhang L.., Pang E.., Loo R. R.., Rao J.., Go V. L.., Loo J. A.., Lu Q. Y.Proteomics. 2011. 11:4638–4647.
(2). Bornhoeft J.., Castaneda D.., Nemoseck T.., Wang P.., Henning S. M.., Hong M. Y. J.Med. Food. 2012. 15:726–732.
(3). Rickman C.., Lyer A.., Chan V.., Brown L.Cur. Pharm. Biotechnol. 2010. 11:881–886.
(4). Ramadan G.., El-Beih N. M.., Abd El-Ghffar E. A.Br. J. Nutr. 2009. 102:1611–1619.
(5). Du G. J.., Zhang Z.., Wen X.D.., Yu C.., Calway T.., Yuan C. S.., Wang C. Z.Nutrients. 2012. 4:1679–1691.
(6). Zhong Y.., Chiou Y. S.., Pan M. H.., Shahidi F.Food Chem. 2012. 134:742–748.
(7). Steinmann J.., Buer J.., Pietschmann T.., Steinmann E.Br. J. Pharmacol. 2013. 168:1059–1073.
(8). Betteridge D. J.Metabolism. 2000. 49:3–8.
(9). Yoshikawa T.., Naito Y. J.Japan Med. Ass. 2002. 45:271–276.
(10). Gostner J. M.., Becker K.., Ueberall F.., Fuchs D.Food Chem. Toxicol. 2015. 80:72–79.
(11). García-Niño W. R.., Zazueta C.Pharmacol. Res. 2015. 97:84–103.
(12). de Oliveira C. C.., de Araújo C. V. M.., Ares G.., Granato D.Crit. Rev. Food Sci. Nutr. 2015. 55:1456–1473.
(13). Legeay S.., Rodier M.., Fillon L.., Faure S.., Clere N.Nutrients. 2015. 7:5443–5468.
(14). Tsai C. F.., Hsu Y. W.., Ting H. C.., Huang C. F.., Yen C. C.Food Chem. 2013. 136:1337–1344.
(15). Zhang W. M.., Huang W.Y.., Chen W. X.., Han L.., Zhang H. D.Molecules. 2014. 19:16416–16427.
(16). Jeong J. Y.., Jo Y. H.., Kim S. B.., Liu Q.., Lee J. W.., Mo E. J.., Lee K. Y.., Hwang B. Y.., Lee M. K.Bioorg. Med. Chem. Lett. 2015. 25:2269–2274.
(17). Jeong J. Y.., Jo Y. H.., Lee K. Y.., Do S. G.., Hwang B. Y.., Lee M. K.Bioorg. Med. Chem. Lett. 2014. 24:2329–2333.
(18). Bezerra M. A.., Santelli R. E.., Oliveira E. P.., Villar L. S.., Escaleira L. A.Talanta. 2008. 76:965–977.
(19). Ferreira S. L. C.., Bruns R. E.., Ferreira H. S.., Matos G. D.., David J. M.., Brandão G. C.., Da Silva E. G. P.., Portugal L. A.., dos Reis P. S.., Souza A. S.., dos Santos W. N. L.Anal. Chim. Acta. 2007. 597:179–186.
(20). Kim S. B.., Jo Y. H.., Liu Q.., Ahn J. H.., Hong I. P.., Han S. M.., Hwang B. Y.., Lee M. K.Molecules. 2015. 20:19764–19774.
(21). Lambert J. D.., Elias R. J.Arch. Biochem. Biophys. 2010. 501:65–72.
(22). Senthil K. V.., Arulmathi K.., Srividhya R.., Kalaiselvi P.Exp. Gerontol. 2008. 43:176–18.
(23). Jovanovic S. V.., Hara Y.., Steenken S.., Simic M. G. J.Am. Chem. Soc. 1995. 117:9881–9888.
Go to : 
 | Fig. 3.Response surface plotanalysis of extraction solvent (X1), extraction temperature (X2) and extraction time (X3) on antioxidant activity. |
Table 1.
A Box-Behnken design for independent variables and their responses
Table 2.
Regression coefficients and their significances in the second-order polynomial regression equation forantioxidant activity of GTE


 PDF
PDF ePub
ePub Citation
 Print
Print


 XML Download