Journal List > Nat Prod Sci > v.22(1) > 1060627

Lee, Lee, Lee, Lee, and Lee: Yield Analysis of Flavonoids in Acanthopanax divaricatus and A. koreanum Grown using Different Cultivation Methods

Abstract

High-performance liquid chromatography was performed in order to analyze the changes in the flavonoid content (rutin, hyperin, afzelin, quercetin, and kaempferol) of Acanthopanax divaricatus and A. koreanum, in response to different cultivation methods (pinching height, planting time, and top dressing). The total flavonoid content of A. divaricatus and A. koreanum ranged from 0.201 to 0.690 mg/g with different pinching heights, 0.143 to 1.001 mg/g for different planting times, and 0.156 to 1.074 mg/g depending on the rate of fertilizer application. In both A. divaricatus and A. koreanum, the total flavonoid content in the upper section of the plant was greater than that in the lower section. These results demonstrate which cultivation methods maximize the flavonoid content of A. divaricatus and A. koreanum, and thus help to optimize flavonoid yields to improve production for nutraceutical, pharmaceutical, and cosmeceutical applications.

REFERENCES

(1). Boon H., Smith M.The botanical pharmacy. Quarry Press;Kingston: 1999. p. 194.
(2). Lee T. B.Coloured flora of Korea. Hyang Mun Sa;Seoul: 2003. p. 811–814.
(3). Hong C. E., Cho M. C., Jang H. A., Lyu S. Y. J.Toxicol. Sci. 2011; 36:661–668.
(4). Lyu S. Y., Park W. B.Food Sci. Biotechnol. 2008; 17:631–636.
(5). Cai X. F., Lee I. S., Dat N. T., Shen G., Kang J. S., Kim D. H., Kim Y. H.Arch. Pharm. Res. 2004; 27:738–741.
(6). Han S. B., Park S. K., Ahn H. J., Yoon Y. D., Kim Y. H., Lee J. J., Lee K. H., Moon J. S., Kim H. C., Kim H. M.Int. Immunopharmacol. 2003; 3:683–691.
(7). Perry L. M., Metzger J.Medicinal Plants of East and Southeast Asia. The MIT Press;Cambridge: 1980. p. 41.
(8). Chang S. Y., Yook C. S., Nohara T.Chem. Pharm. Bull. 1998; 46:163–165.
(9). Chang S.Y., Yook C. S., Nohara T.Phytochemistry. 1999; 50:1369–1374.
(10). Ishikura N.Phytochemistry. 1975; 14:1439.
(11). Miyakoshi M., Shirasuna K., Sawada H., Isoda S., Ida Y., Shoji J.Nat. Med. 1995; 49:218.
(12). Shirasuna K., Miyakoshi M., Mimoto S., Isoda S., Satoh Y., Hirai Y., Ida Y., Shoji J.Phytochemistry. 1997; 45:579–584.
(13). Lee S., Jung S. H., Lee Y. S., Shin K. H.Nat. Prod. Sci. 2003; 9:4–6.
(14). Kim H. Y., Lee J. M., Yokozawa T., Sakata K., Lee S.Food Chem. 2011; 126:892–895.
(15). Rho H. S., Ahn S. M., Lee B. C., Kim M. K., Ghimeray A. K., Jin C. W., Cho D. H.Bioorg. Med. Chem. Lett. 2010; 20:7534–7536.
(16). Park H. K., Park M. S., Kim T. S., Kim S., Choi K. G., Park K. H., Korean J.Crop Sci. 1997; 42:673–677.
(17). Lee J. J., Lee S. H., Park J. S., Ahn Y. S., Lee S. C., Korean J.Medicinal Crop Sci. 2013; 21:39–44.
(18). Mok S. Y., Lee J. M., Kim H. M., Lee D. G., Yoon Y. H., Cho E. J., Lee S.Nat. Prod. Sci. 2011; 17:230–233.
(19). Lee S., Park H. S., Notsu Y., Ban H. S., Kim Y. P., Ishihara K., Hirasawa N., Jung S. H., Lee Y. S., Lim S. S., Park E. H., Shin K. H., Seyama T., Hong J., Ohuchi K.Phytother. Res. 2008; 22:1552–1556.
(20). Mok S. Y., Lee S.Food Chem. 2013; 136:969–974.
(21). Kitajima J., Takamori Y., Tanaka Y.Yakugaku Zasshi. 1989; 109:188–191.
(22). Lee J. M., Lee D. G., Lee K. H., Cho S. H., Park C. G., Lee S.Nat. Prod. Sci. 2013; 19:15–19.
(23). Kim M. S., Kim S. Y., Lee D. S., Kor J.Intl. Agric. 2000; 12:298–302.
crossref
(24). Han J. S., Kim S. K., Kim S. W., Kim Y. J.Korean, J. Medicinal Crop Sci. 2001; 9:1–7.
(25). Kim P. G., Lee K. Y., Hur S. D., Kim S. H., Lee E. J.Korean J. Ecol. 2003; 26:321–326.

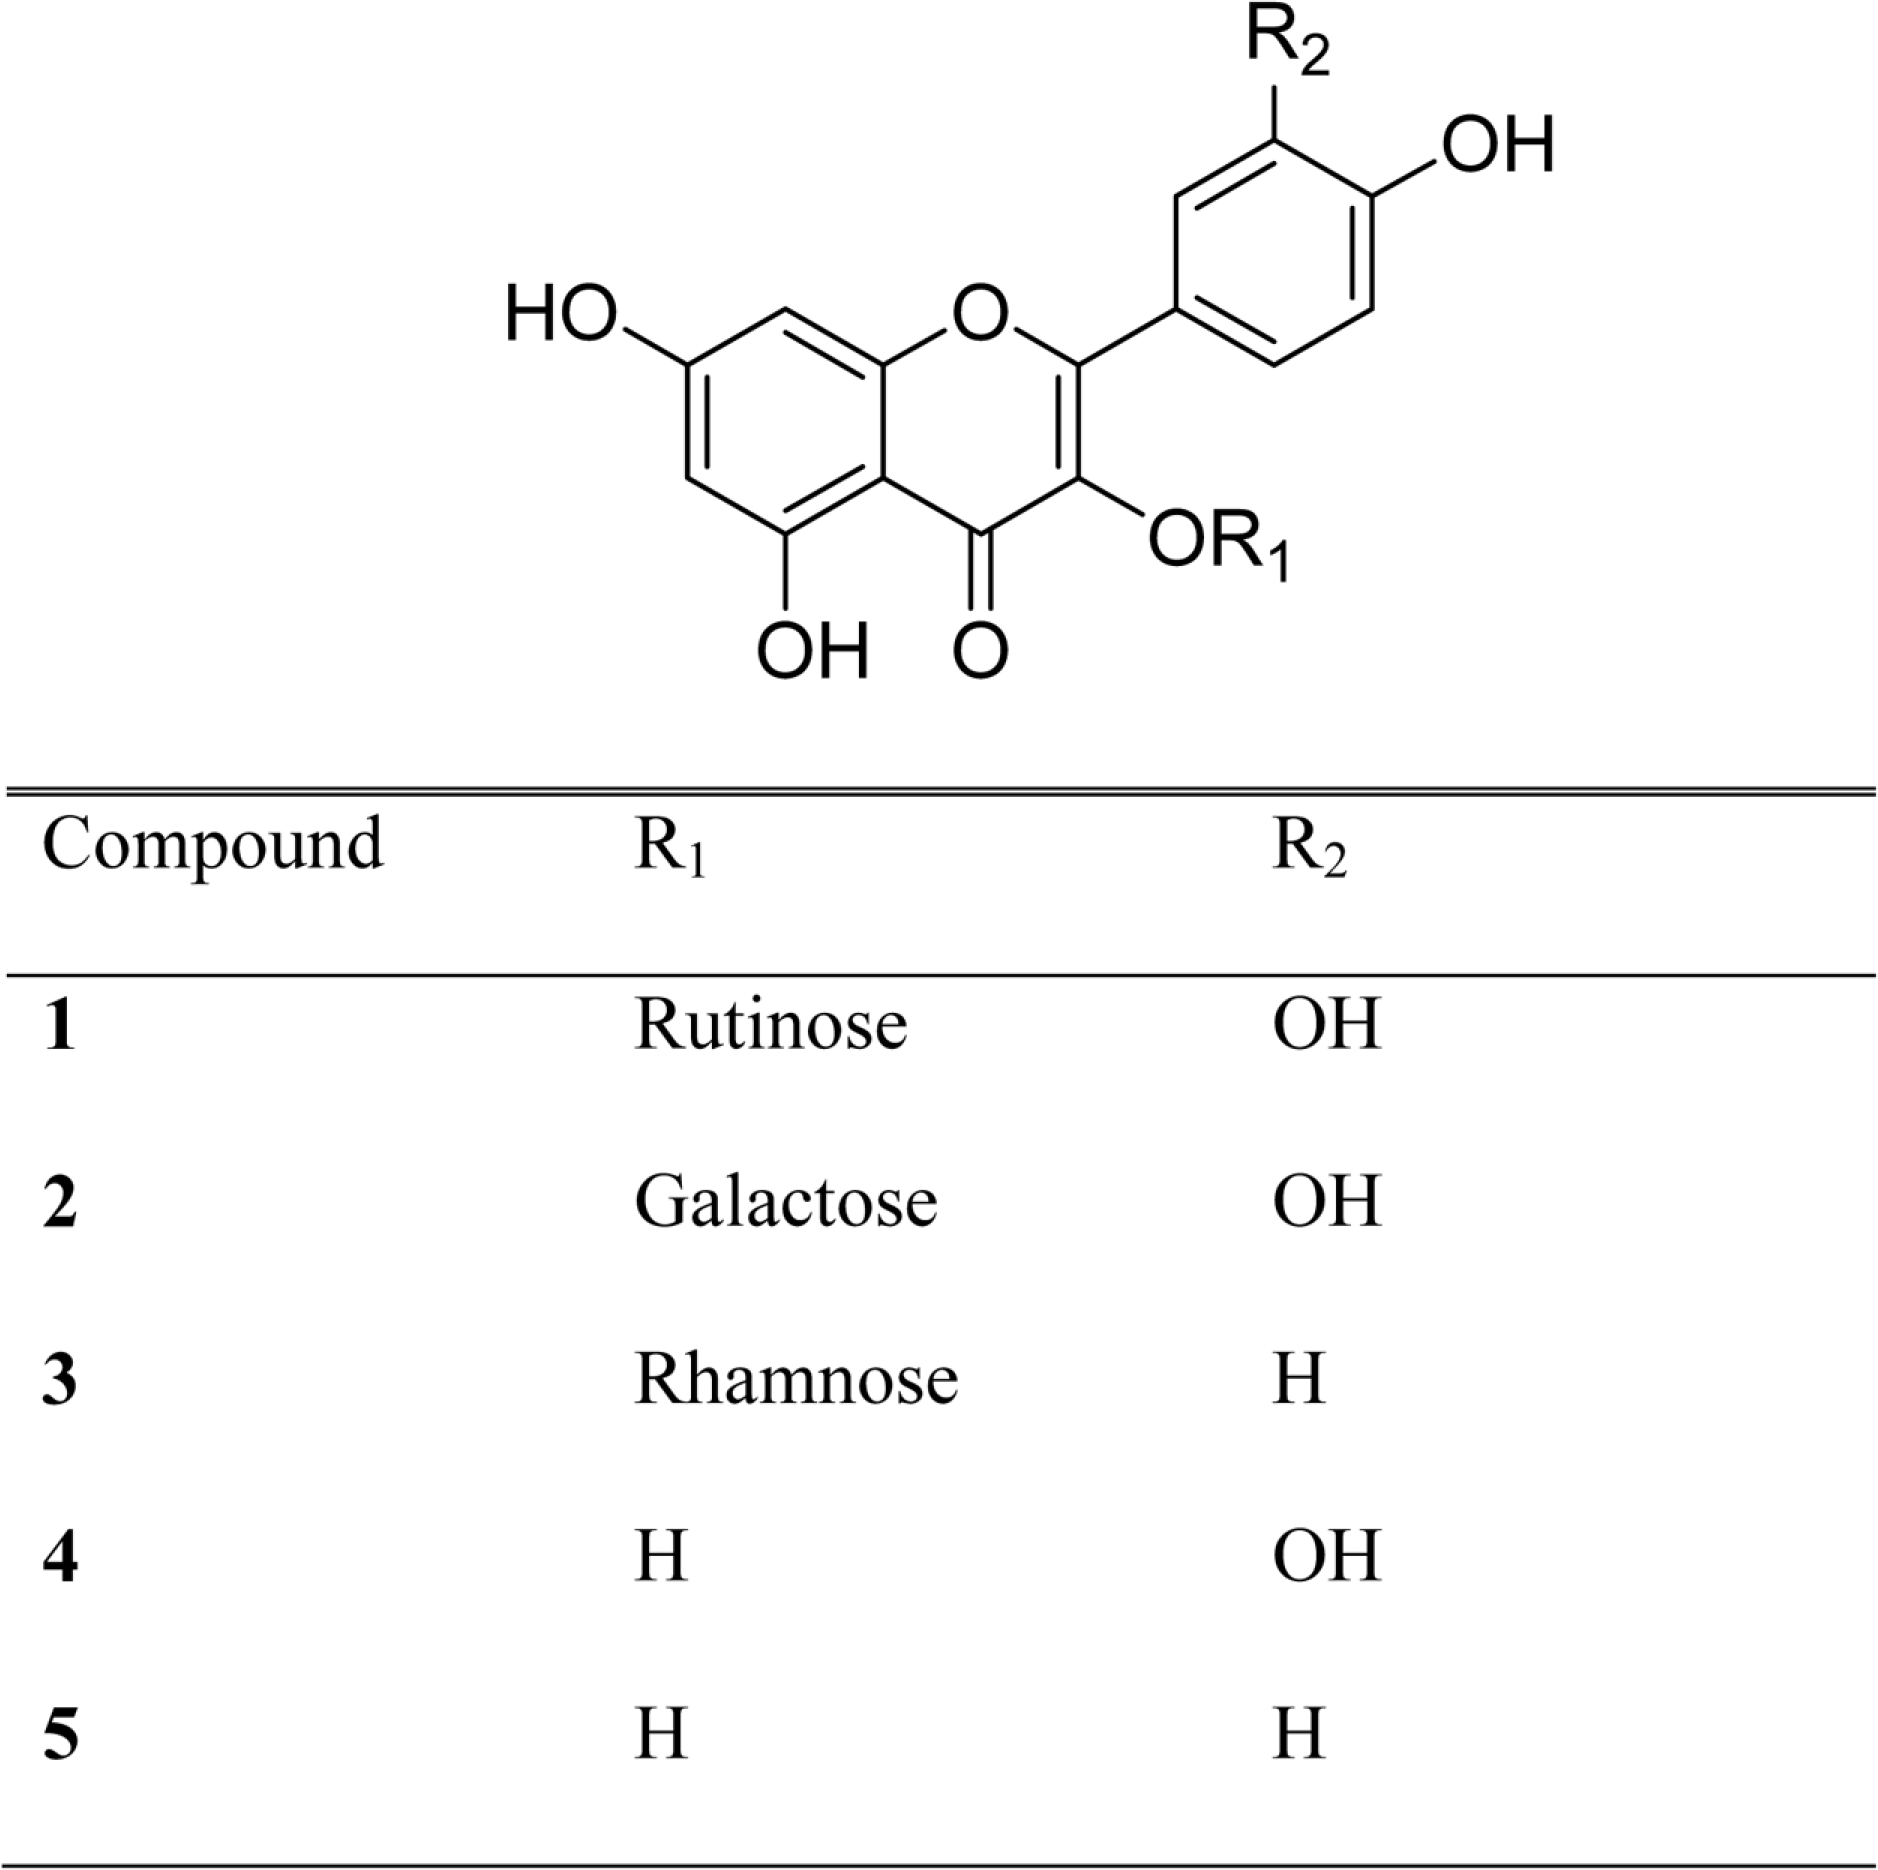
Fig. 1.
Chemical structures of compounds 1–5.
nps-22-25f1.tif
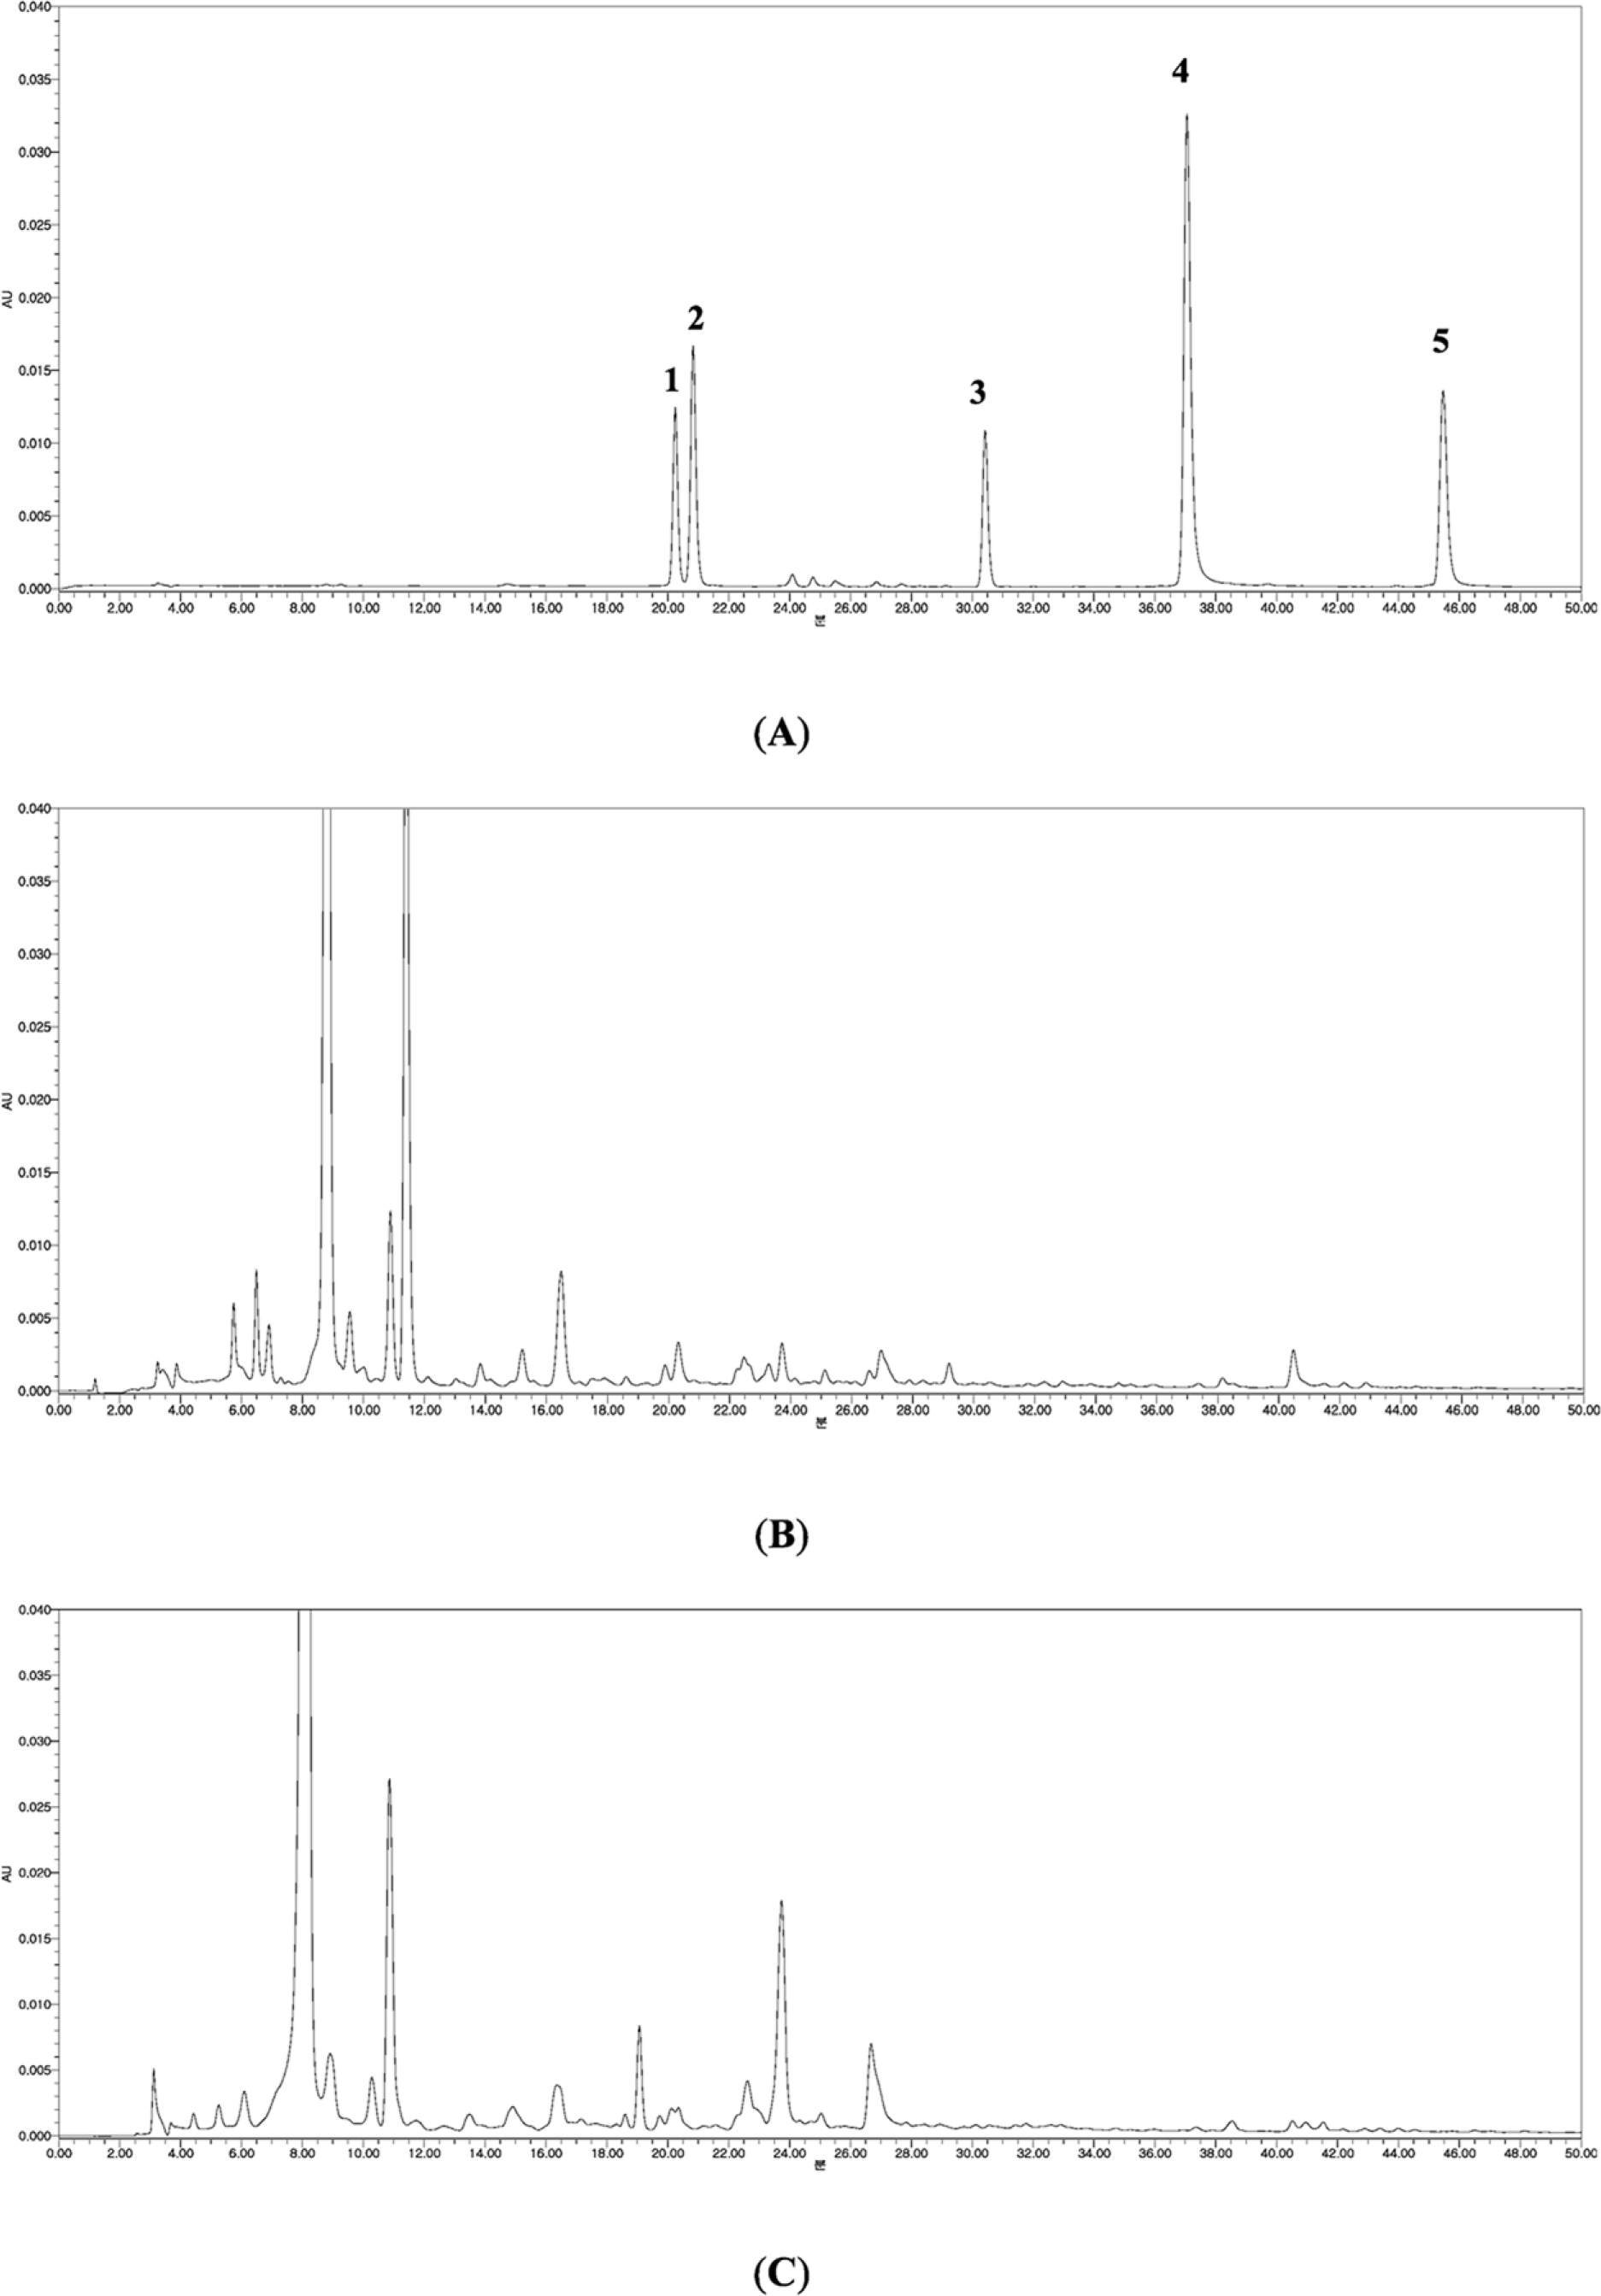
Fig. 2.
HPLC chromatograms of compounds 1–5 (A), the 50% MeOH extracts of the upper part of A. divaricatus cultivated with planting time at April 15 (B), and A. koreanum cultivated with top dressing at N-P-K (C).
nps-22-25f2.tif
Table 1.
Contents of compounds 1–5 in A. divaricatus and A. koreanum cultivated by pinching (mg/g)
Sample Pinching 1 2 3 4 5 Total
A. divaricatus 30 cm Upper part 0.008 ± 0.001 0.154 ± 0.008 0.127 ± 0.001 0.071 ± 0.001 0.035 ± 0.001 0.395 ± 0.012
Lower part 0.006 ± 0.001 0.092 ± 0.001 0.108 ± 0.001 0.071 ± 0.001 0.038 ± 0.001 0.315 ± 0.005
60 cm Upper part 0.004 ± 0.001 0.130 ± 0.002 0.110 ± 0.001 0.070 ± 0.001 0.035 ± 0.001 0.349 ± 0.006
Lower part 0.005 ± 0.001 0.073 ± 0.001 0.086 ± 0.001 0.055 ± 0.001 0.026 ± 0.001 0.245 ± 0.005
A. koreanum 30 cm Upper part 0.414 ± 0.001 0.090 ± 0.001 0.093 ± 0.001 0.062 ± 0.001 0.031 ± 0.001 0.690 ± 0.005
Lower part 0.045 ± 0.001 0.040 ± 0.001 0.059 ± 0.001 0.038 ± 0.001 0.019 ± 0.001 0.201 ± 0.005
60 cm Upper part 0.182 ± 0.001 0.046 ± 0.001 0.053 ± 0.001 0.034 ± 0.001 0.018 ± 0.001 0.333 ± 0.005
Lower part 0.078 ± 0.001 0.041 ± 0.001 0.060 ± 0.001 0.038 ± 0.001 0.020 ± 0.001 0.237 ± 0.005

Data are presented as the mean ± SD (n = 3) in mg/g of the dried samples.

Table 2.
Contents of compounds 1–5 in A. divaricatus and A. koreanum cultivated with different planting times (mg/g)
Sample Planting time 1 2 3 4 5 Total
  March Upper part 0.184 ± 0.005 0.107 ± 0.001 0.071± 0.001 0.035 ± 0.001 0.397 ± 0.008
  30 Lower part 0.006 ± 0.001 0.057 ± 0.001 0.065 ± 0.001 0.040± 0.001 0.020 ± 0.001 0.188 ± 0.005
A. divaricatus April Upper part 0.002 ± 0.001 0.098 ± 0.002 0.200 ± 0.001 0.063 ± 0.001 0.031 ± 0.001 0.394 ± 0.006
15 Lower part 0.001 ± 0.001 0.042 ± 0.001 0.053 ± 0.001 0.031 ± 0.001 0.016 ± 0.001 0.143 ± 0.005
  April Upper part 0.005 ± 0.001 0.101 ± 0.003 0.169 ± 0.004 0.055 ± 0.001 0.028 ± 0.001 0.358 ± 0.010
  30 Lower part 0.001 ± 0.001 0.078 ± 0.001 0.094 ± 0.001 0.061 ± 0.001 0.032 ± 0.001 0.266 ± 0.005
  March Upper part 0.353 ± 0.001 0.089 ± 0.001 0.096 ± 0.001 0.062 ± 0.001 0.031 ± 0.001 0.631 ± 0.005
  30 Lower part 0.158 ± 0.001 0.088 ± 0.001 0.105 ± 0.001 0.068 ± 0.001 0.035 ± 0.001 0.454 ± 0.005
A. koreanum April Upper part 0.673 ± 0.001 0.108 ± 0.001 0.115 ± 0.001 0.070 ± 0.001 0.035 ± 0.001 1.001 ± 0.005
15 Lower part 0.097 ± 0.001 0.049 ± 0.001 0.076 ± 0.001 0.046 ± 0.001 0.028 ± 0.001 0.296 ± 0.005
  April Upper part 0.610 ± 0.001 0.134 ± 0.001 0.105 ± 0.001 0.071 ± 0.001 0.035 ± 0.001 0.955 ± 0.005
  30 Lower part 0.139 ± 0.001 0.079 ± 0.001 0.108 ± 0.001 0.068 ± 0.001 0.039 ± 0.001 0.433 ± 0.005

Data are presented as the mean ± SD (n = 3) in mg/g of the dried samples.

Table 3.
Contents of compounds 1–5 in A. divaricatus and A. koreanum cultivated with top dressing (mg/g)
Sample Top dressing 1 2 3 4 5 Total
  N-P-K Upper part 0.001 ± 0.001 0.088 ± 0.002 0.109 ± 0.001 0.054 ± 0.001 0.026 ± 0.001 0.278 ± 0.006
  Lower part 0.003 ± 0.001 0.070 ± 0.001 0.099 ± 0.001 0.054 ± 0.001 0.026 ± 0.001 0.252 ± 0.005
  2N-P-K Upper part 0.003 ± 0.001 0.112 ± 0.002 0.095 ± 0.001 0.056 ± 0.001 0.026 ± 0.001 0.292 ± 0.006
  Lower part 0.015 ± 0.001 0.066 ± 0.001 0.074 ± 0.001 0.047 ± 0.001 0.027 ± 0.001 0.229 ± 0.005
A. divaricatus N-2P-K Upper part 0.085 ± 0.001 0.148 ± 0.001 0.070 ± 0.001 0.032 ± 0.001 0.335 ± 0.004
Lower part 0.040 ± 0.001 0.059 ± 0.001 0.039 ± 0.001 0.018 ± 0.001 0.156 ± 0.004
  N-P-2K Upper part 0.003 ± 0.001 0.135 ± 0.006 0.124 ± 0.001 0.055 ± 0.001 0.025 ± 0.001 0.342 ± 0.010
  Lower part 0.063 ± 0.001 0.078 ± 0.001 0.047 ± 0.001 0.022 ± 0.001 0.209 ± 0.004
  2N-2P-2K Upper part 0.082 ± 0.001 0.132 ± 0.001 0.061 ± 0.001 0.028 ± 0.001 0.303 ± 0.004
  Lower part 0.049 ± 0.001 0.071 ± 0.001 0.046 ± 0.001 0.023 ± 0.001 0.189 ± 0.004
  N-P-K Upper part 0.740 ± 0.001 0.116 ± 0.001 0.109 ± 0.001 0.071 ± 0.001 0.038 ± 0.001 1.074 ± 0.005
  Lower part 0.078 ± 0.001 0.053 ± 0.001 0.074 ± 0.001 0.046 ± 0.001 0.042 ± 0.001 0.293 ± 0.005
  2N-P-K Upper part 0.370 ± 0.001 0.113 ± 0.001 0.126 ± 0.001 0.084 ± 0.001 0.046 ± 0.001 0.739 ± 0.005
  Lower part 0.076 ± 0.001 0.057 ± 0.001 0.089 ± 0.001 0.053 ± 0.001 0.030 ± 0.001 0.305 ± 0.005
A. koreanum N-2P-K Upper part 0.569 ± 0.001 0.095 ± 0.001 0.086 ± 0.007 0.054 ± 0.001 0.028 ± 0.001 0.832 ± 0.005
Lower part 0.093 ± 0.001 0.049 ± 0.001 0.072 ± 0.001 0.046 ± 0.001 0.025 ± 0.001 0.285 ± 0.005
  N-P-2K Upper part 0.620 ± 0.00c 0.120 ± 0.001 0.094 ± 0.001 0.062 ± 0.001 0.032 ± 0.001 0.928 ± 0.005
  Lower part 0.067 ± 0.001 0.059 ± 0.001 0.082 ± 0.001 0.053 ± 0.001 0.034 ± 0.001 0.295 ± 0.005
  2N-2P-2K Upper part 0.668 ± 0.002 0.117 ± 0.001 0.120 ± 0.001 0.077 ± 0.001 0.037 ± 0.001 1.019 ± 0.006
  Lower part 0.161 ± 0.001 0.089 ± 0.001 0.134 ± 0.001 0.084 ± 0.001 0.056 ± 0.001 0.524 ± 0.005

Data are presented as the mean ± SD (n = 3) in mg/g of the dried samples.

TOOLS
Similar articles