Abstract
This research is to estimate the toxicity of Atractylodis Rhizoma Alba (ARA) in F344 rats and to find a dose level for the 13 weeks toxicity study. A hot water extract of ARA (ARWE) was administered orally to F344 rats at dose levels of 0 (vehicle control), 500, 1000, 2000, 3500, and 5000 mg/kg/day for 2 weeks. Each group was composed to five male and five female F344 rats. According to the result, there were no ARWE-related adverse changes in mortality, body weights, food consumption, urinalysis, hematology, clinical chemistry, gross finding at necropsy, and organ weight examination. Salivation was observed in 3500 and 5000 mg/kg/day in male and female rats but it could not have found any relationship with ARWE administration. Based on our findings, ARWE may not cause toxicity in rats under the experimental conditions. Therefore, dose level of 5000 mg/kg/day as a highest treatment group in 13-week exposure study is recommended for further toxicity assessment.
REFERENCES
(1). Jiang W. Y.Trends Pharmacol. Sci. 2005; 26:558–563.
(2). Liu S., Yi L. Z., Liang Y. Z. J.Sep. Sci. 2008; 31:2113–2137.
(3). Ernst E.Trends Pharmacol. Sci. 2002; 23:136–139.
(4). Stewart M. J., Moar J. J.Forensic Sci. Int. 1999; 101:177–183.
(5). Cheong B. S., Shin M. G.Iconographical Folk Medicine Encyclopedia; Younglim Co., Ltd: Seoul. 1999; 1026.
(6). Kim S. H., Park Y. K. Kor. J.Herbology. 2012; 27:1–6.
(7). Han Y. K., Jung H. W., Park Y. K.BMC Complement. Alternat. Med. 2012; 12:154.
(8). Nishikawa Y., Seto T., Watanabe Y., Yasuda I.Yakugaku Zasshi. 1977; 97:515–518.
(9). Kitajima J., Kamoshita A., Ishikawa T., Takano A., Fukuda T., Isoda S., Ida Y.Chem. Pharm. Bull. 2003; 51:152–157.
(10). Keum J. H., Han H. Y., Roh H. S., Seok J. H., Roh H. S., Lee J. K., Jeong J. Y., Kim J. A., Woo M. H., Choi J. S., Min B. S.Korean Journal of Pharmacognosy. 2014; 45:135–140.
(11). Boorman G. A.Pathology of the Fischer Rat - Reference and Atlas. Academic Press, Inc.;1990.
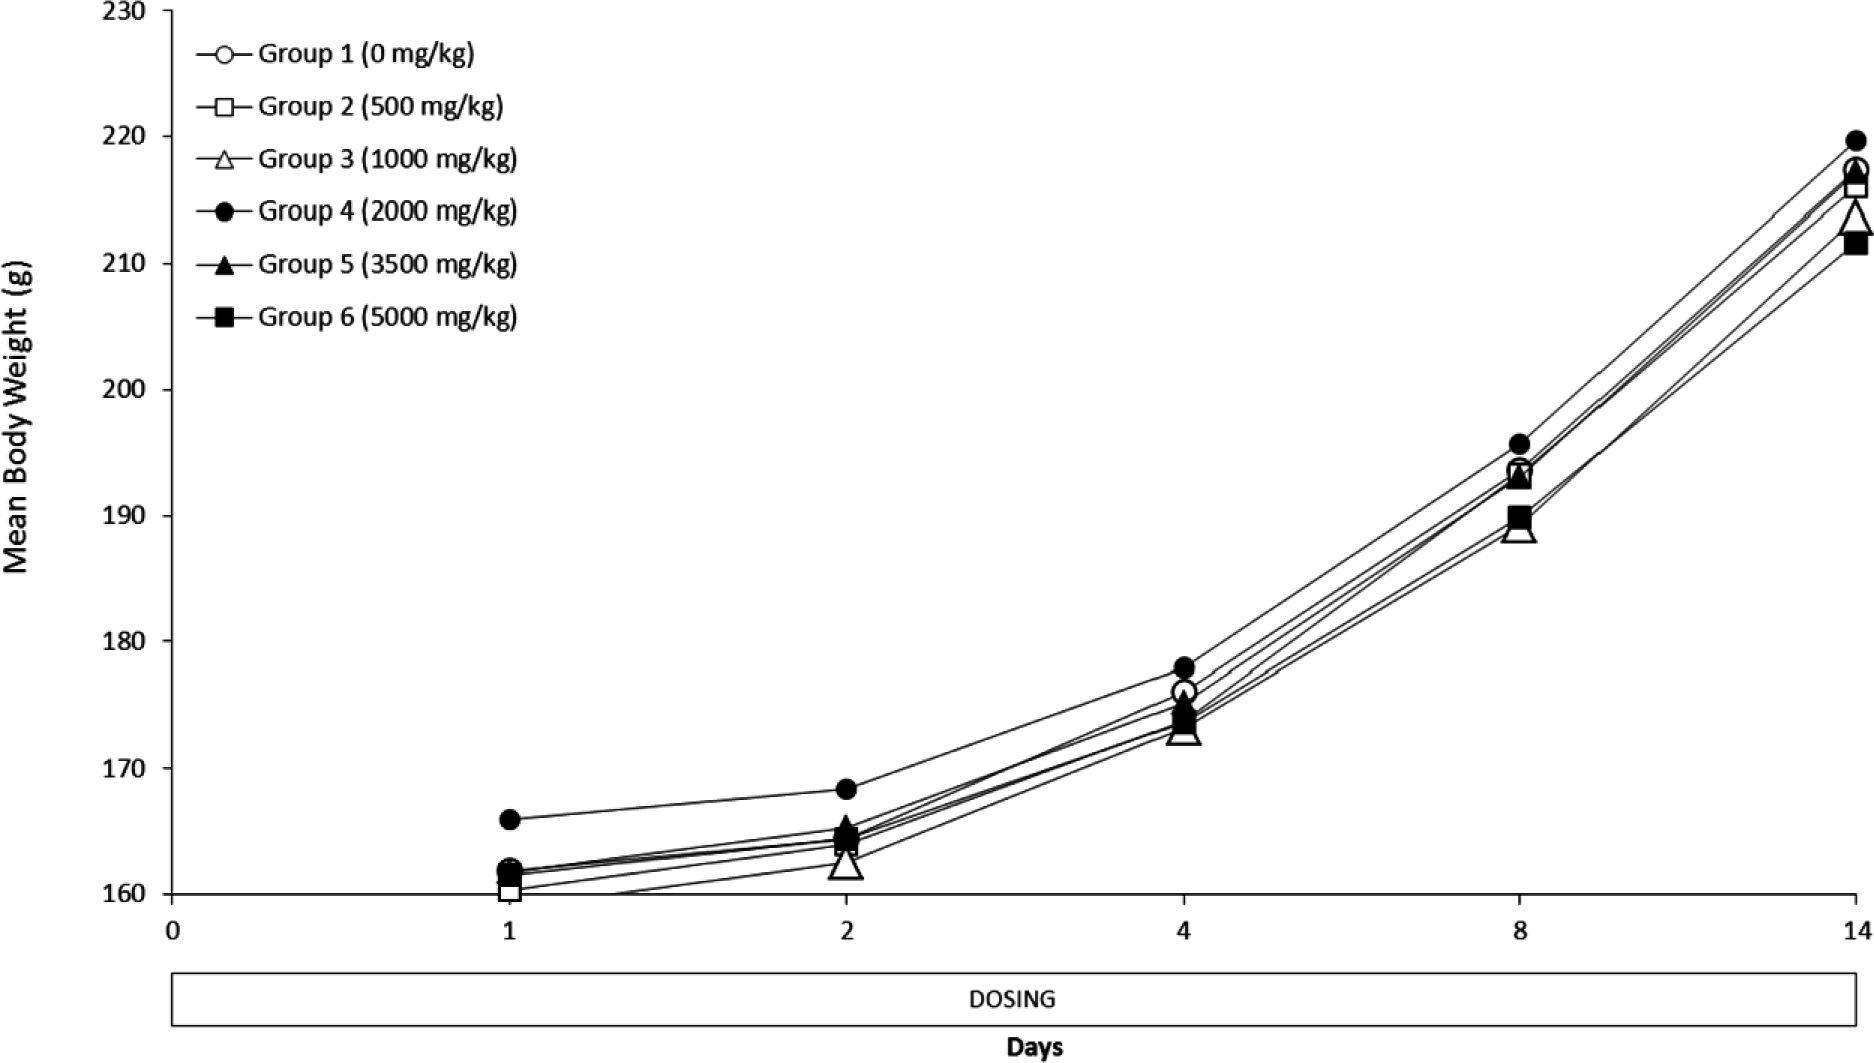
Fig. 1.
Changes of body weights after treatment with 500, 1000,2000, 3500 and 5000 mg/kg/day ARWE in male rats.

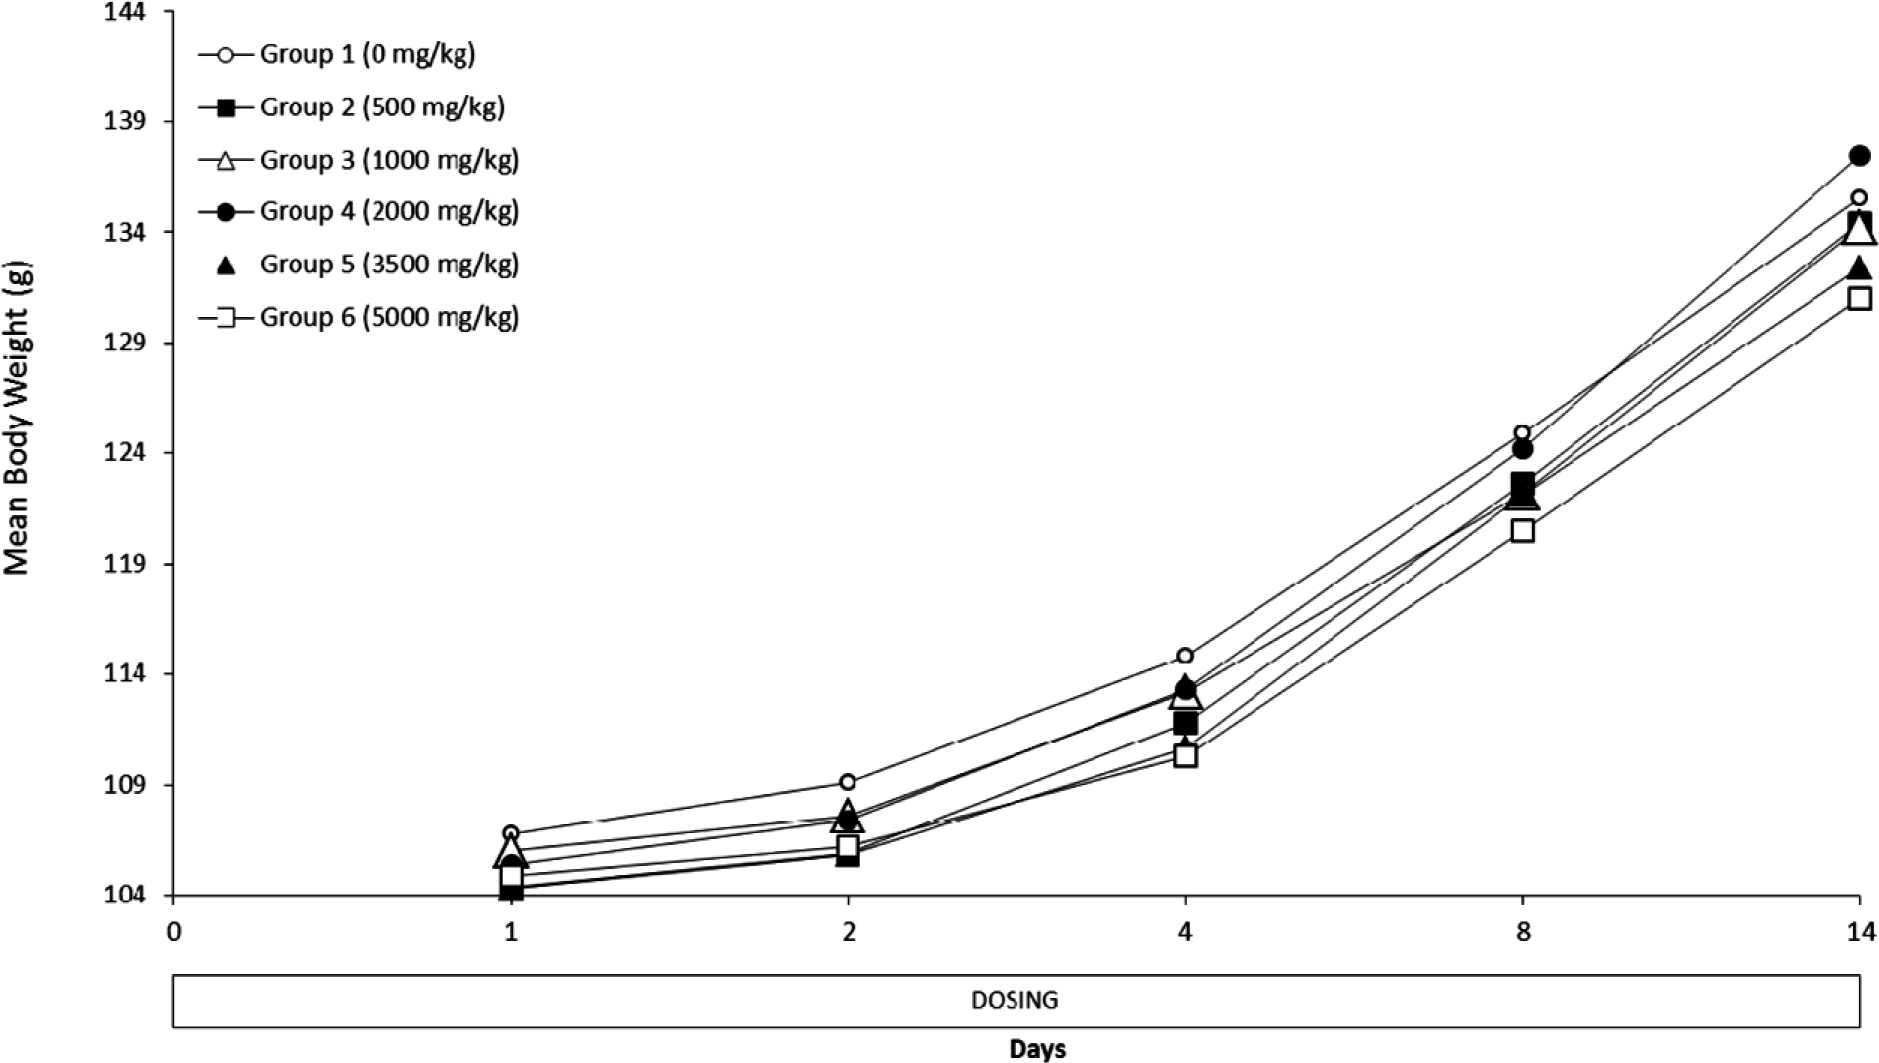
Fig. 2.
Changes of body weights after treatment with 500, 1000,2000, 3500 and 5000 mg/kg/day ARWE in female rats.

Table 1.
Comparison of food intake after treatment with 500, 1000, 2000, 3500 and 5000 mg/kg/day ARWE between the treatment groups (Unit : g)
Table 2.
Hematological values observed after treatment with 500, 1000, 2000, 3500 and 5000 mg/kg/day ARWE
Table 3.
Clinical chemical values observed after treatment with 500, 1000, 2000, 3500 and 5000 mg/kg/day ARWE
Table 4.
Absolute organ weights after treatment with 500, 1000, 2000, 3500 and 5000 mg/kg/day ARWE (Unit : g)
Table 5.
Relative organ weights after treatment with 500, 1000, 2000, 3500 and 5000 mg/kg/day ARWE (Unit:%)
| Group Dose (mg/kg/day) | G1 0 | G2 500 | G3 1000 | G4 2000 | G5 3500 | G6 5000 |
|---|---|---|---|---|---|---|
| Male | ||||||
| Brain | 0.902 | 0.903 | 0.94 | 0.912 | 0.898 | 0.914 |
| Pituitary gland | 0.003 | 0.003 | 0.003 | 0.003 | 0.003 | 0.003 |
| Liver | 3.323 | 3.535 | 3.481 | 3.379 | 3.466 | 3.410 |
| Spleen | 0.252 | 0.246 | 0.262 | 0.255 | 0.260 | 0.250 |
| Heart | 0.369 | 0.366 | 0.371 | 0.367 | 0.373 | 0.373 |
| Thymus | 0.167 | 0.161 | 0.178 | 0.176 | 0.163 | 0.189 |
| Salivary glands | 0.180 | 0.182 | 0.182 | 0.178 | 0.183 | 0.182 |
| Seminal vesicle | 0.274 | 0.251 | 0.284 | 0.27 | 0.303 | 0.289 |
| Prostate | 0.063 | 0.054 | 0.066 | 0.051 | 0.050 | 0.054 |
| Kidneys | 0.782 | 0.824 | 0.828 | 0.839 | 0.820 | 0.819 |
| Adrenal glands | 0.019 | 0.020 | 0.020 | 0.021 | 0.022 | 0.021 |
| Testes | 1.359 | 1.367 | 1.419 | 1.304 | 1.350 | 1.383 |
| Epididymides | 0.248 | 0.237 | 0.264 | 0.242 | 0.245 | 0.266 |
| Lung | 0.483 | 0.450 | 0.487 | 0.487 | 0.502 | 0.472 |
| Thyroid/Parathyroid | 0.006 | 0.006 | 0.007 | 0.006 | 0.006 | 0.006 |
| Female | ||||||
| Brain | 1.365 | 1.339 | 1.376 | 1.358 | 1.382 | 1.396 |
| Pituitary gland | 0.006 | 0.006 | 0.006 | 0.006 | 0.006 | 0.006 |
| Liver | 3.526 | 3.638 | 3.624 | 3.696 | 3.748 | 3.736 |
| Speen | 0.272 | 0.288 | 0.273 | 0.295 | 0.276 | 0.289 |
| Heart | 0.437 | 0.441 | 0.414 | 0.426 | 0.445 | 0.424 |
| Thymus | 0.259 | 0.255 | 0.251 | 0.257 | 0.254 | 0.248 |
| Salivary glands | 0.219 | 0.212 | 0.222 | 0.229 | 0.229 | 0.232 |
| Kidneys | 0.882 | 0.914 | 0.917 | 0.900 | 0.916 | 0.925 |
| Adrenal glands | 0.037 | 0.038 | 0.035 | 0.037 | 0.038 | 0.041 |
| Ovaries | 0.057 | 0.059 | 0.053 | 0.057 | 0.063 | 0.069∗ |
| Lung | 0.617 | 0.626 | 0.572 | 0.612 | 0.605 | 0.637 |
| Thyroid/Parathyroid | 0.008 | 0.007 | 0.008 | 0.009 | 0.007 | 0.008 |
| Uterus/Cervix | 0.233 | 0.267 | 0.206 | 0.174 | 0.255 | 0.226 |


 PDF
PDF ePub
ePub Citation
 Print
Print


 XML Download