

 PDF
PDF ePub
ePub Citation
 Print
Print


Introduction
Peucedani Radix, a perennial herb (Umbelliferae), is mostly used as a medicinal plant in Asia. It has been distributed as the herbal medicine, called "Jeonho or Angelica decursiva Franchet et Savatier" in Korea and Japan and "Qianhu or Peucedanum praeruptorum Dunn" in China. It was reported that A. decursiva is used in the treatment of coughs, phlegm, fever, and pains, while P. praeruptorum has medicinal effects on respiratory diseases and ischemic chest pain.12
In the Korean Herbal Pharmacopoeia (KHP) and Japanese Pharmacopoeia (JP), it is officially stated that Peucedani Radix is the root of Peucedanum praeruptorum Dunn or Angelica decursiva Franchet et Savatier (=Peucedanum decursivum Maximowicz), and has a characteristic odor and slightly bittersweet taste as its medicinal properties.34 In the Chinese Pharmacopoeia (ChP), however, P. praeruptorum and A. decursiva were separately listed since 2010.5
The major constituents of Peucedani Radix are mostly coumarin-related compounds. According to the relevant studies, it has been reported that the major constituents of P. praeruptorum are praeruptorin A, praeruptorin B, praeruptorin E, praeruptorin I, qianhucoumarin D, qianhucoumarin H, qianhucoumarin I, qianhucoumarin J, isoscopoletin, umbelliferone, etc., while those of A. decursiva are decursin, decursidin, decursitin C, nodakenin, and so on.678910
Although P. praeruptorum and A. decursiva have not only different scientific names but also different major constituents, they have been distributed with the same herbal medicinal name as Peucedani Radix because of similarities in shapes and name. Therefore, it is needed to determine the origin species of P. praeruptorum and A. decursiva using chemical profiling in order to ensure the prevention of misuse in a distribution process.
Especially, as Peucedani Radix is dispersed in mountain slopes or grasslands mainly in the whole Asian regions, it has been actively distributed among countries.11 Therefore, it is needed to contribute to the correct determination of P. praeruptorum and A. decursiva to prevent their mixed use in the distribution process, and to clearly discriminate origin species for the quality control in the distribution of medicinal herbs as it is highly likely that herbal medicinal materials derived from similar plants belonging to the same genus or their adulterations are distributed together. Currently, the methods of identifying Peucedani Radix are reported as molecular genetic identification, external morphological classification through organoleptic test, and internal morphological identification using a microscope.1213 In addition, the studies on the identification of chemical constituents to compare A. decursiva and P. praeruptorum have been reported.1415 But the physicochemical simultaneous analysis using the chemical profiling of A. decursiva and P. praeruptorum is still insufficient.
In this study, we developed a physicochemical determination method using the chemical profiling of two origin species through HPLC-DAD in order to ensure the quality control and prevent the mixed use in the distribution process of Peucedani Radix.
Experimental
Plant material
Twenty three samples corresponding to nine A. decursiva (A01–A09) and fourteen P. praeruptorum (P01–P14) cultivated in the different regions of China were provided by the National Center for Herbal Medicine Resources and were supplied from Prof. Ho-Young Choi of Kyung Hee University, Korea.
Chemicals and reagents
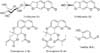
Nodakenin (1), nodakenetin (2), praeruptorin A (3), and praeruptorin B (4) were purchased from the Institute for Korea Traditional Medical Industry and ChromaDex. Vanillin (I.S.), and phosphoric acid were purchased from Sigma-Aldrich Co. Their structures used as marker compounds are shown in Fig. 1.
Sample preparation
Dried root powder was used to determine the content of the four marker compounds in each extract of A. decursiva and P. praeruptorum. Powdered root sample was sieved through 100-mesh, and about 1.0 g of the powder was accurately weighed; 10 ml of 70% ethanol and 300 µg/ml vanillin (I.S.) were then added, the weight was accurately measured, and the sample was sonicated for 45 min at room temperature. The solution was weighed again, and the loss in weight was made up with 70% ethanol. The solution was filtered through a 0.45 µm membrane filter, and the filtrated was used as the test solution. Sample solution of 10 µl was injected into the HPLC system.
HPLC-DAD conditions
The HPLC equipment was an Agilent 1260 HPLC system (Agilent, Santa Clara, CA, USA) with an Agilent binary pump, an auto-sampler, a column oven, and an Agilent 1260 photodiode array detector. The Phenomenex Luna C18 analytical column (5 µm, 4.6 × 250 mm, Phenomenex) was tested with a guard column that was filled with the same stationary phase. Mobile phase A(hereinafter referred as A)[0.1% phosphoric acid (PA) in distilled water (DW)] and Mobile phase B (hereinafter referred as B)[0.1% PA in acetonitrile (AcN)] were used as the mobile phase under gradient conditions (0 min, 85% A; 5 min, 85% A; 25 min, 75% A; 30 min, 30% A; and 60 min, 30% A) to analyze the samples. The mobile phase was filtered under vacuum through a 0.45 µm membrane filter and degassed prior to use. The analysis was carried out at a flow rate of 1.0 ml/min with the detection wavelength set at 330 nm; the total run time was 55 min; and the analytical temperature was 25 ℃. All compounds could be resolved with baseline separation at 330 nm with maximum absorption. Hence, characteristic chromatographic patterns were obtained at 330 nm. The chromatograms were processed using Agilent chemstation software (Version B.03.01, Agilent, USA).
Analytical method validation
The developed chromatographic method was validated according to the Ministry of Food and Drug Safety (MFDS) guidelines for the following parameters: linearity, limits of detection (LOD), limits of quantification (LOQ), recovery, accuracy, and precision.
The standards were accurately weighed and then dissolved with 70% ethanol to produce stock standard solutions [nodakenin (1) and praeruptorin B (4), 400 µg/ml; nodakenetin (2), 100 µg/ml; and praeruptorin A (3), 1200 µg/ml]. The vanillin as internal standard of 3 mg was accurately weighed and then dissolved with 10 ml of 70% ethanol to produce a stock solution of 300 µg/ml. The calibration curves were made by diluting the stock solutions with 70% ethanol. The reference solution of the four marker compounds at concentrations of 0.1 - 1200 µg/ml was analyzed by HPLC-DAD. The regression equations were calculated in the form of y = ax + b, where y and x correspond to peak area ratio for an internal standard and compound concentration, respectively.
The lowest concentration of working solution was diluted with appropriate concentrations, and LOD and LOQ under the chromatographic conditions were separately determined at signal-to-noise ratios (S/N) of about 3 and 10, respectively. Recovery was determined by spiking three concentration levels for the four compounds nodakenin (1), nodakenetin (2), praeruptorin A (3) and praeruptorin B (4), which were mixed with the Peucedani Radix samples for subsequent extraction and filtration. The HPLC-DAD analytical experiments were performed in triplicate for each control level. The data from the standard solutions and the extracted samples were compared.
Precision and accuracy in HPLC-DAD were determined in the same way, except that three concentrations of 50.0, 100.0, and 200.0 µg/ml were used in nodakenin (1) and praeruptorin B (4); 12.5, 25.0, and 50.0 µg/ml were used in nodakenetin (2); and 150.0, 300.0, and 600.0 µg/ml were used in praeruptorin A (3). Precision and accuracy were determined by multiple analysis (n=5) of quality control samples prepared at low, medium, and high concentrations spanning the calibration range.
The robustness of the method was studied by introducing changes in the column type (i.e., Phenomenex, Shiseido, and Waters), column temperature (i.e., 25, 30, and 35 ℃2016-10-29), and flow rates (i.e., 0.8, 1.0, and 1.2 ml/min).
Pattern recognition analysis
To evaluate the phytochemical equivalency among nine A. decursiva, and fourteen P. praeruptorum samples, pattern recognition analysis was conducted. We used ten marker compound peaks [nodakenin (1), nodakenetin (2), praeruptorin A (3), and praeruptorin B (4)] for the pattern recognition analysis. Pattern recognition analysis was conducted using software package R-3.2.0.
Result and Discussion
Optimization of chromatographic conditions
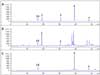
To establish the simultaneous quantitative analysis of the marker compounds of Peucedani Radix – nodakenin (1), nodakenetin (2), praeruptorin A (3), and praeruptorin B (4) – analytical conditions were evaluated with regard to various solvents and wavelengths. As a result, a detection wavelength of UV 330 nm was set under the solvent conditions using DW with 0.1% PA and AcN with 0.1% PA, with a Phenomenex Luna C18 column (5 µm, 4.6 × 250 mm). According to the analysis of Peucedani Radix using this method, it was possible to assess nodakenin (1), nodakenetin (2), praeruptorin A (3), and praeruptorin B (4) (Fig. 2). Based on literatures, analytical conditions are evaluated using the addition of 0.1%, 1%, and 10% acids (acetic acid, formic acid, and phosphoric acid) to DW, AcN, and methanol, and the solvent conditions of DW–AcN including 0.1% phosphoric acid were selected as the mobile phase. In this article, analytical conditions were established to ensure that four marker compounds are detected within 55 min, and vanillin was selected as an internal standard to compare the retention times of reference compounds. It was allowed to compare the origin species of Peucedani Radix, on the conditions that four major compounds – nodakenin (1), nodakenetin (2), praeruptorin A (3), and praeruptorin B (4) – are completely separated.
Optimization of sample preparation conditions
Before conducting this study, different extracting solvents, methods, and times were evaluated to establish a method of compounding the suitable test solution. First of all, samples were extracted using extracting solvents – 25%, 50%, 70% and 100% ethanol and methanol – for 45 min. As a result, when 70% ethanol was employed, the content of compounds was higher than in other extracting solvents. Therefore, 70% ethanol was selected as the extracting solvent throughout this work. Moreover, when 70% ethanol was employed, the content of compounds was higher in the sonication extraction method than in the reflux method. Lastly, to determine the time needed for complete extraction, samples were extracted five different lengths of time (15, 45, 60, 90, and 120 min) using a 70% ethanol solvent and the sonication extraction method. As a result, when the extraction time was 45 min, the highest content of compounds was similar to that at 60 min. Hence, the sonication extraction method using a 70% ethanol solvent for 45 min was selected as the most optimized condition.
Validation of the method
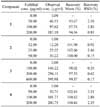
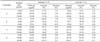
The calibration curve showed good correlation coefficient (R2) > 0.999 within the test ranges, as shown in Table 1. The LOD and LOQ were evaluated based on the lowest detectable peak in the chromatogram having a signal-to-noise (S/N) ratio of 3 and 10, respectively. The standard solutions were diluted with a solvent to obtain apposite concentrations. The LOD and LOQ under our experimental conditions are listed in Table 1. The obtained values of both LOD and LOQ for these four marker compounds were low enough to detect the traces of these compounds in either crude extract or its preparation.
The recovery test was performed by extracting a known amount of the four marker compounds from the Peucedani Radix powder samples. The test was carried out as follows: the known amount of each compound at three different levels (low, medium, and high) was mixed with the sample powder and extracted with 70% ethanol, as described in the experimental section. The recovery rate of each standard ranged from 93.67 to 102.66%, and the relative standard deviation (RSD) was less than 3.80% (Table 2). The average recovery was represented by the formula: R (%) = [(amount from the sample spiked standard – amount from the sample)/amount from the spiked standard] × 100.
recision and accuracy tests were carried out by the intra-day and inter-day variability. Intra-day precision and accuracy were determined from the variability of multiple analysis (n=5) of quality control samples analyzed in the same analytical run. The quality control samples had an intra-day precision below 3.93% and accuracy in the range of 96.87 to 102.49%. Inter-day precision and accuracy were evaluated from the variability of multiple analysis (n=5) of quality control samples analyzed on a single analytical run for consecutive 5 days. The quality control samples had an inter-day precision less than 2.95% and accuracy in the range of 96.18 to 103.35%. From the results of recovery, precision, and accuracy tests, the developed method can be said to be highly reproducible. Precision and accuracy data are presented in Table 3.
The robustness was determined in order to evaluate the reliability of the established HPLC method. The experimental conditions, such as column temperature, column type, and flow rate, were purposely altered, and the theoretical plate (N), capacity factor (k´), separation factor (α), and resolution (Rs) were evaluated. The four analytical factors showed that the experimental conditions were sufficiently robust (data not shown).
Sample analysis
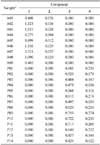
The established HPLC-DAD method was applied to the simultaneous determination of the four marker compounds [nodakenin (1), nodakenetin (2), praeruptorin A (3), and praeruptorin B (4)] of Peucedani Radix. The results of the content of each marker compound in samples were summarized in Table 4. Each sample was analyzed in triplicate to ensure the reproducibility of the quantitative results. As shown in Fig. 2, the retention time of praeruptorin B (4) in chromatogram C is similar to the peak at near 48 - 49 min in chromatogram B. It is not same constituents because the UV absorption spectrum of praeruptorin B (4) [204, 219, and 322 nm] is different from the peak [205, 231, and 322 nm] in chromatogram B. The quantitative results showed nodakenin (1, 0.275–1.557%), nodakenetin (2, 0.004–0.038%) in A. decursiva; and praeruptorin A (3, 0.288–0.759%), praeruptorin B (4, 0.038–0.274%) in P. praeruptorum. In comparing A. decursiva (A01–A09) and P. praeruptorum (P01–P14), the major constituents of A. decursiva are nodakenin (1) and nodakenetin (2), while those of P. praeruptorum are praeruptorin A (3) and praeruptorin B (4) (Table 4).
Pattern recognition analysis
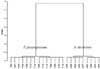
To evaluate the phytochemical equivalency between nine A. decursiva, and fourteen P. praeruptorum samples, pattern recognition analysis was conducted. In this study, we used four marker compound peaks [nodakenin (1), nodakenetin (2), praeruptorin A (3), and praeruptorin B (4)] for the pattern recognition analysis. And these constituents in Peucedani Radix were selected as major marker compounds because of difficulties in the existence. In the pattern analysis of HClust (Hierarchical Cluster analysis), all of the samples were clustered into two groups: A (A01-A09, A. decursiva) and B (P01-P14, P. praeruptorum) (Fig. 3). Hence, this pattern analysis results could be used for the quality control of Peucedani Radix.

 XML Download