

 PDF
PDF ePub
ePub Citation
 Print
Print


Abstract
Comprehensive chemical analysis of extracts and fractions of marine actinomycete strains led to the discovery of a new minor secondary metabolite, salternamide E (1), from a saltern-derived halophilic Streptomyces strain. The planar structure of salternamide E (1) was elucidated by a combinational analysis of spectroscopic data including NMR, MS, UV, and IR. The absolute configuration of salternamide E (1) was determined by circular dichroism spectroscopic analysis. Salternamide E displayed weak cytotoxicity against various human carcinoma cell lines.
Go to : 
REFERENCES
(1). Fenical W., Jensen P. R.Nat. Chem. Biol. 2006; 2:666–673.
(2). Moon K., Chung B., Shin Y., Rheingold A. L., Moore C. E., Park S. J., Park S., Lee S. K., Oh K.-B., Shin J., Oh D.-C. J.Nat. Prod. 2015; 78:524–529.
(3). Hou Y., Braun D. R., Michel C. R., Klassen J. L., Adnani N., Wyche T. P., Bugni T. S.Anal. Chem. 2012; 84:4277–4283.
(4). Forner D., Berrué F., Correa H., Duncan K., Kerr R. G.Anal. Chim. Acta. 2013; 805:70–79.
(5). Yang J. Y., Sanchez L. M., Rath C. M., Liu X., Boudreau P. D., Bruns N., Glukhov E., Wodtke A., de Felicio R., Fenner A., Wong W. R., Linington R. G., Zhang L., Debonsi H. M., Gerwick W. H., Dorrestein P. C. J.Nat. Prod. 2013; 76:1686–1699.
(6). Um S., Kim Y.-J., Kwon H., Wen H., Kim S.-H., Kwon H. C., Park S., Shin J., Oh D.-C. J.Nat. Prod. 2013; 76:873–879.
(7). Um S., Choi T. J., Kim H., Kim B. Y., Kim S.-H., Lee S. K., Oh K.-B., Shin J., Oh D.-C. J.Org. Chem. 2013; 78:12321–12329.
(8). Kwon Y., Kim S.-H., Shin Y., Bae M., Kim B.-Y., Lee S.K.; Oh, K.-B.; Shin, J.; Oh, D.-C. Mar. Drugs. 2014; 12:2326–2340.
(9). Bae M., Kim H., Moon K., Nam S.-J., Shin J., Oh K.-B., Oh D.-C.Org. Lett. 2015; 17:712–715.
(10). Kim S.-H., Shin Y., Lee S.-H., Oh K.-B., Lee S. K., Shin J., Oh D.-C. J.Nat. Prod. 2015; 78:836–843.
Go to :
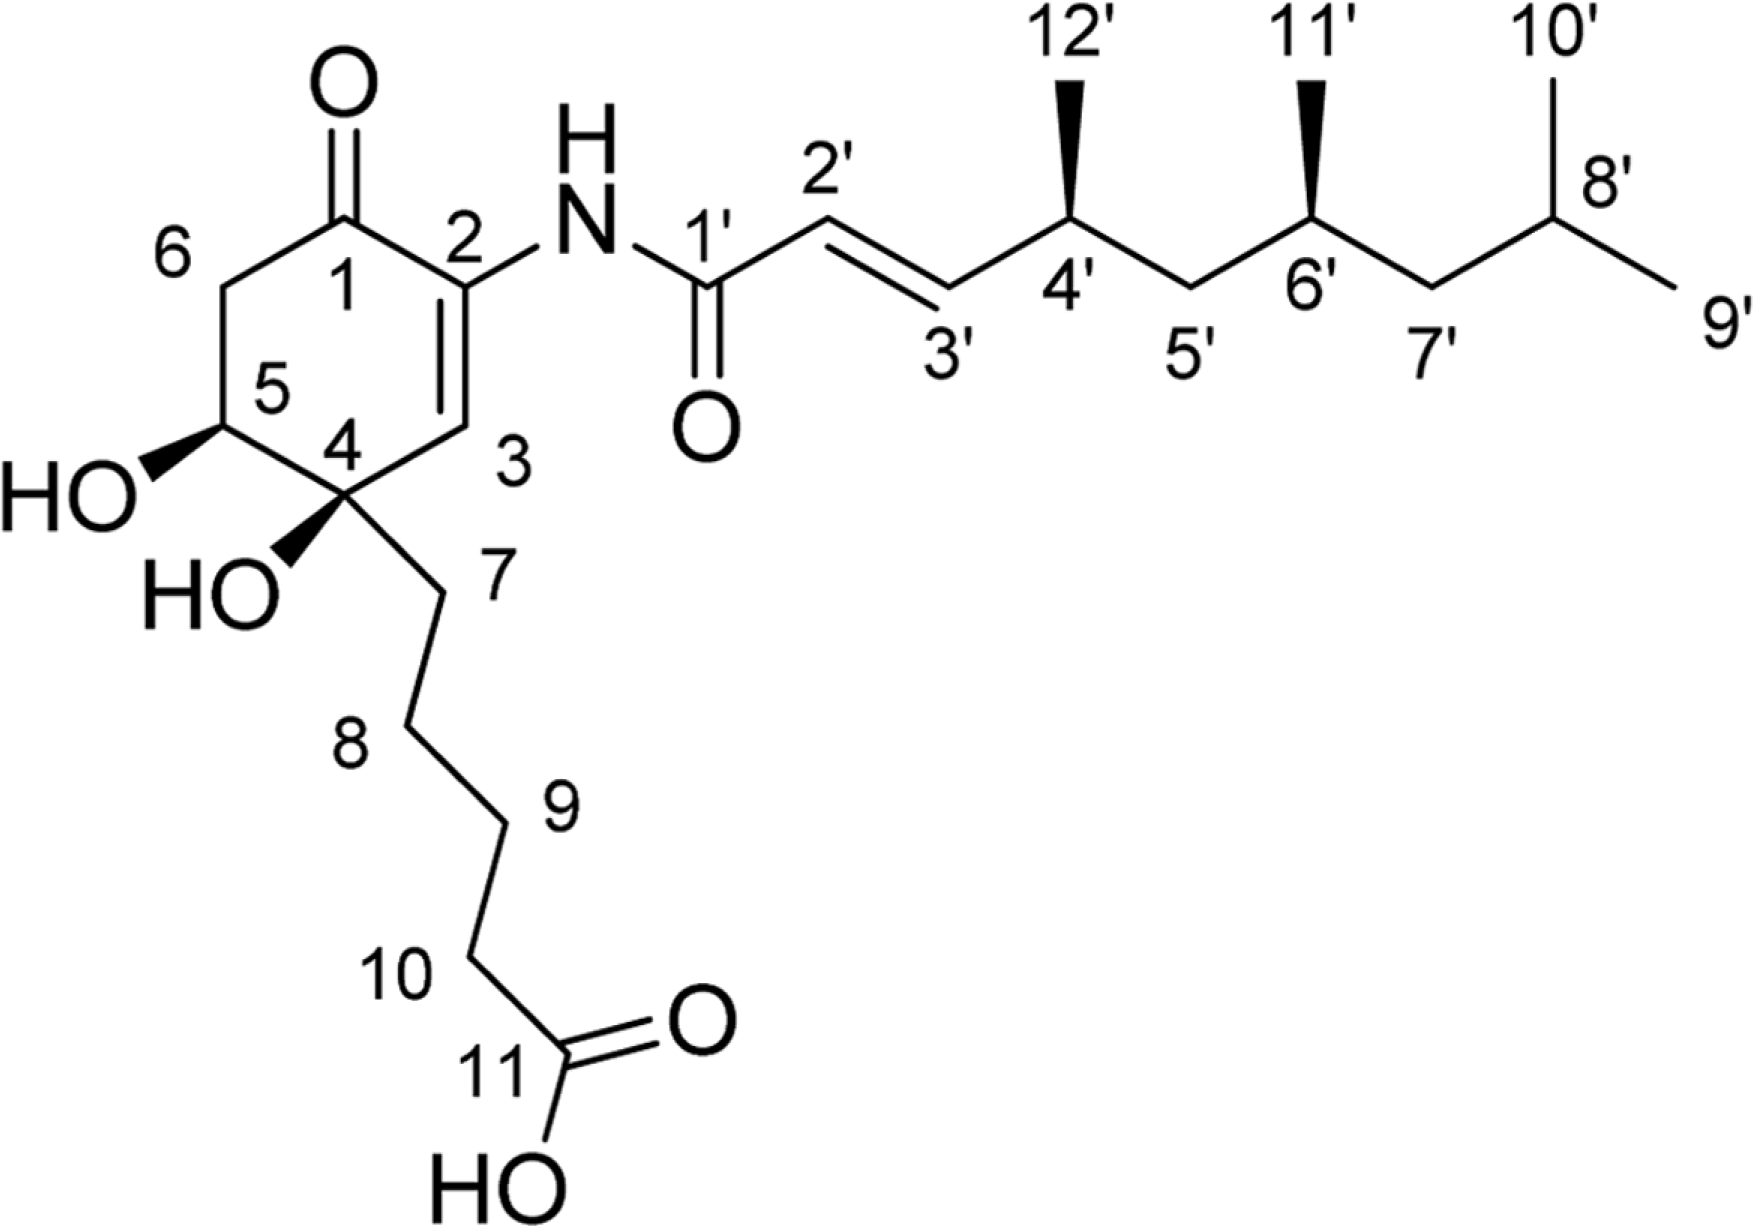
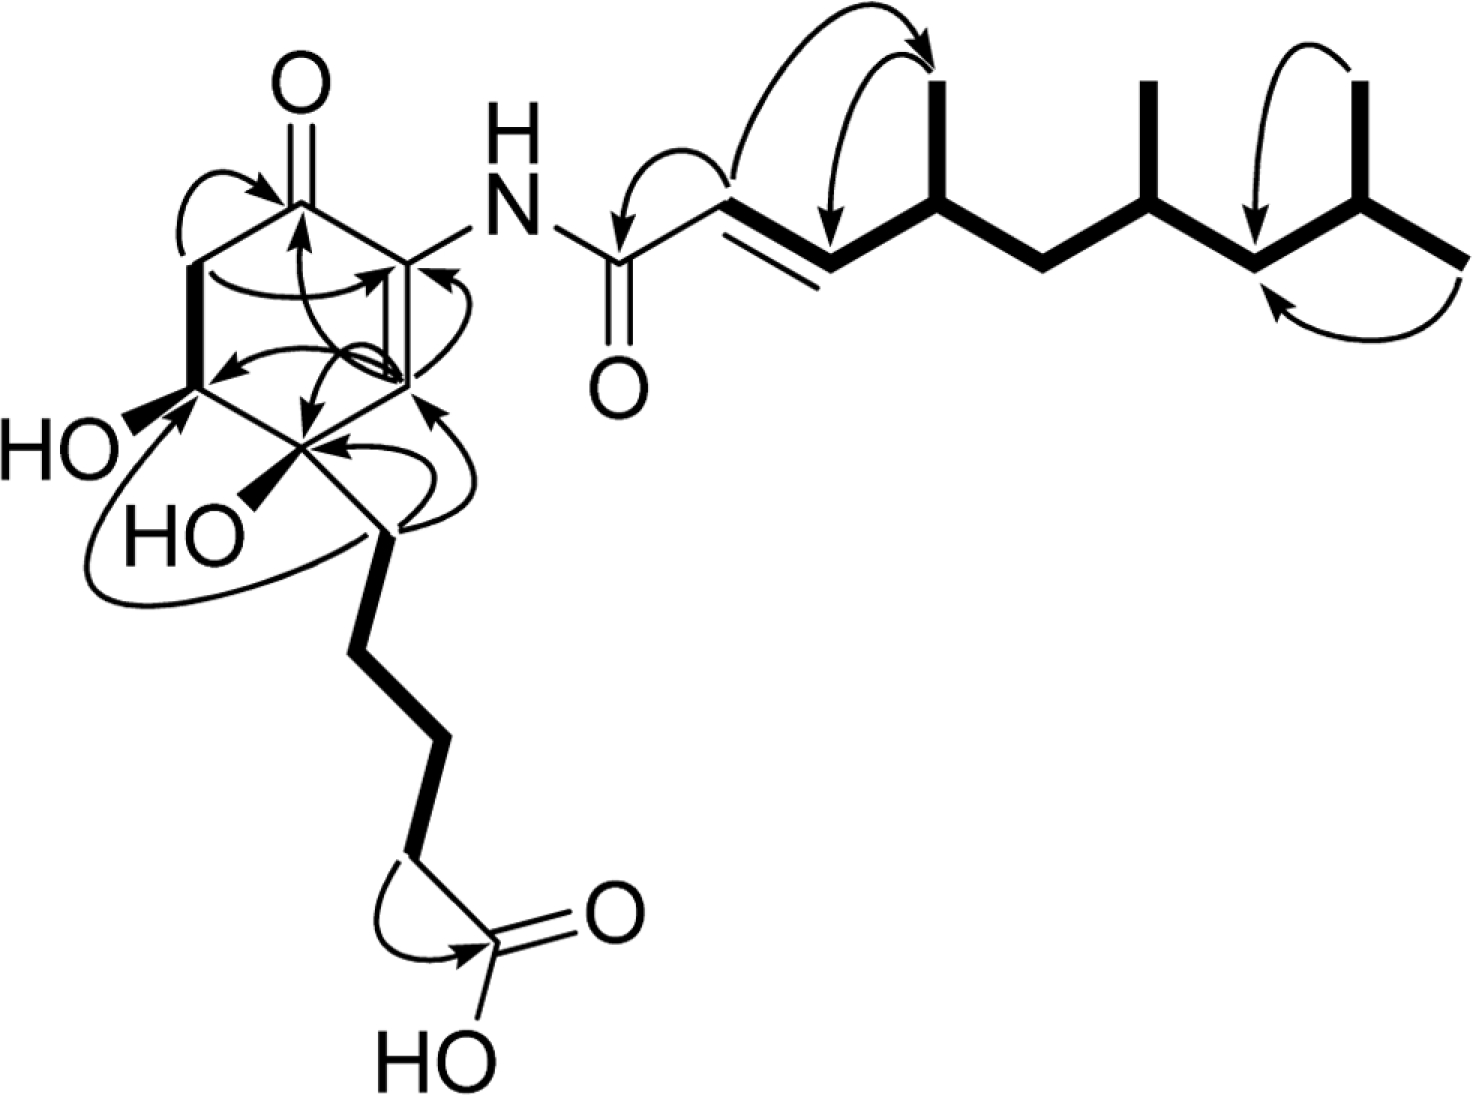
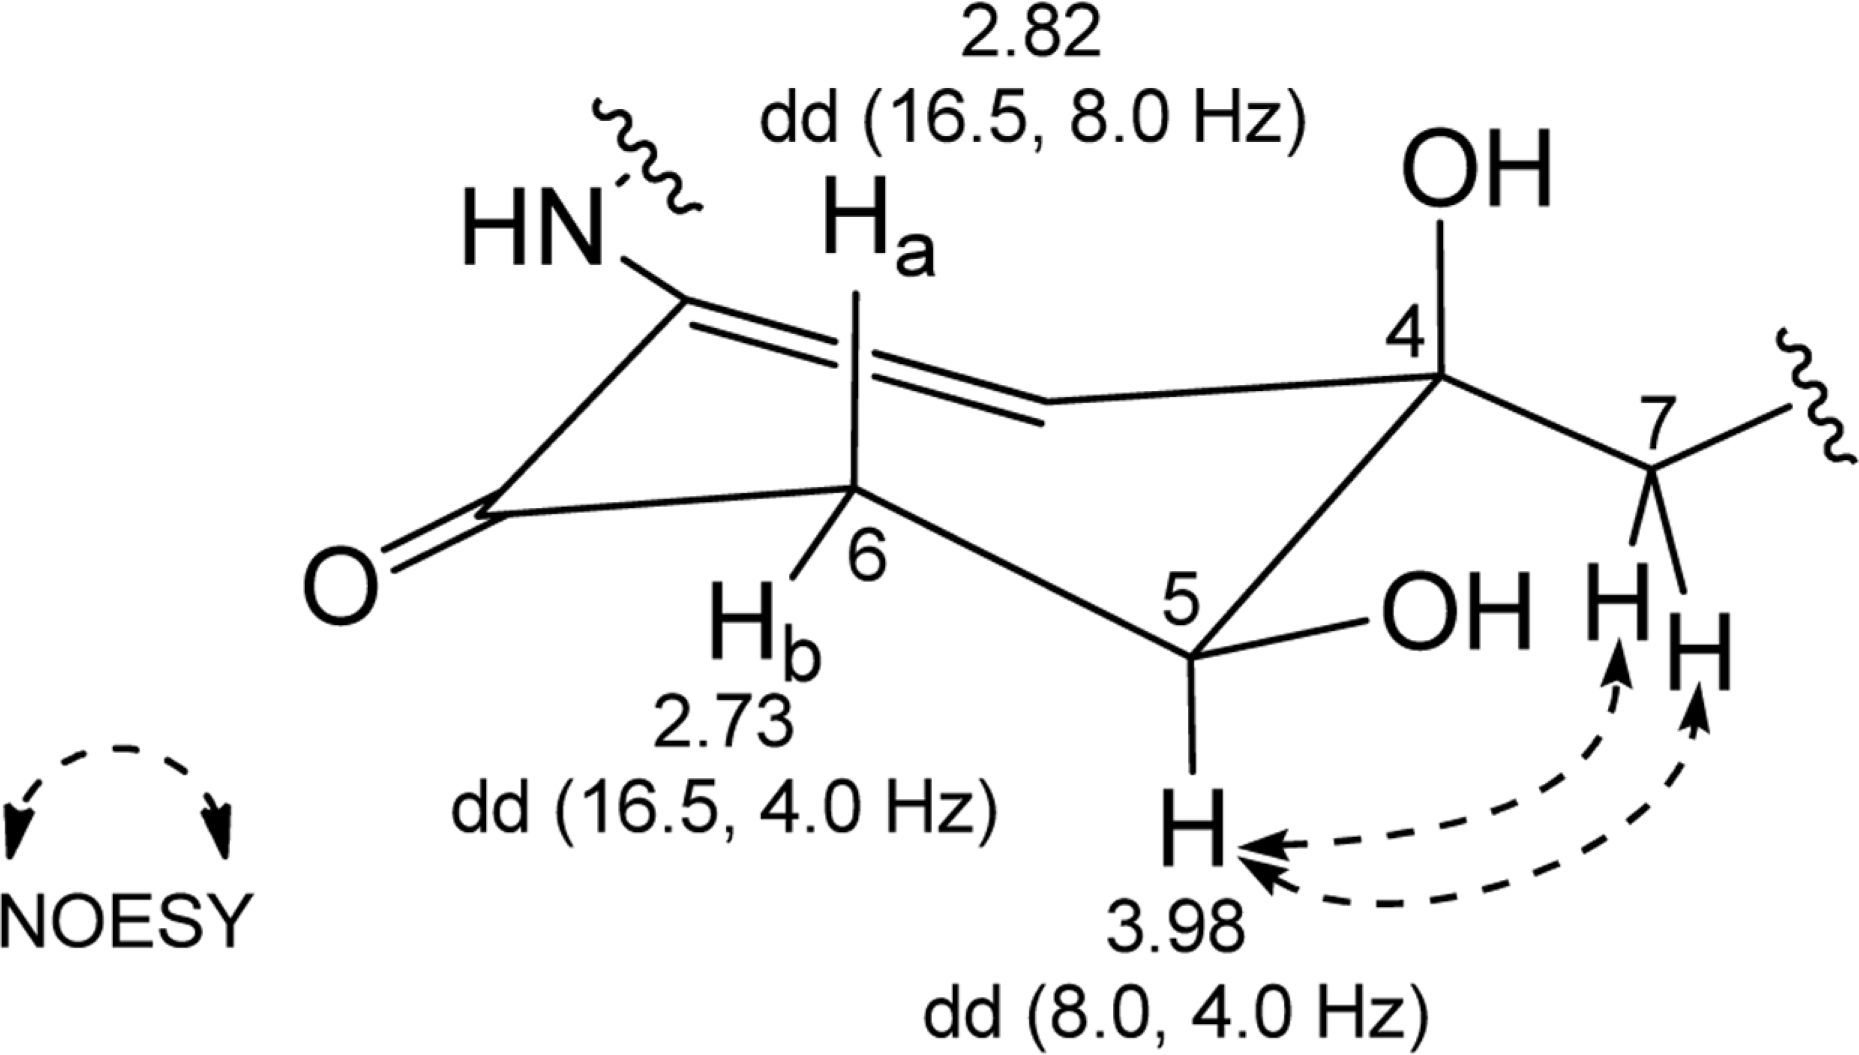
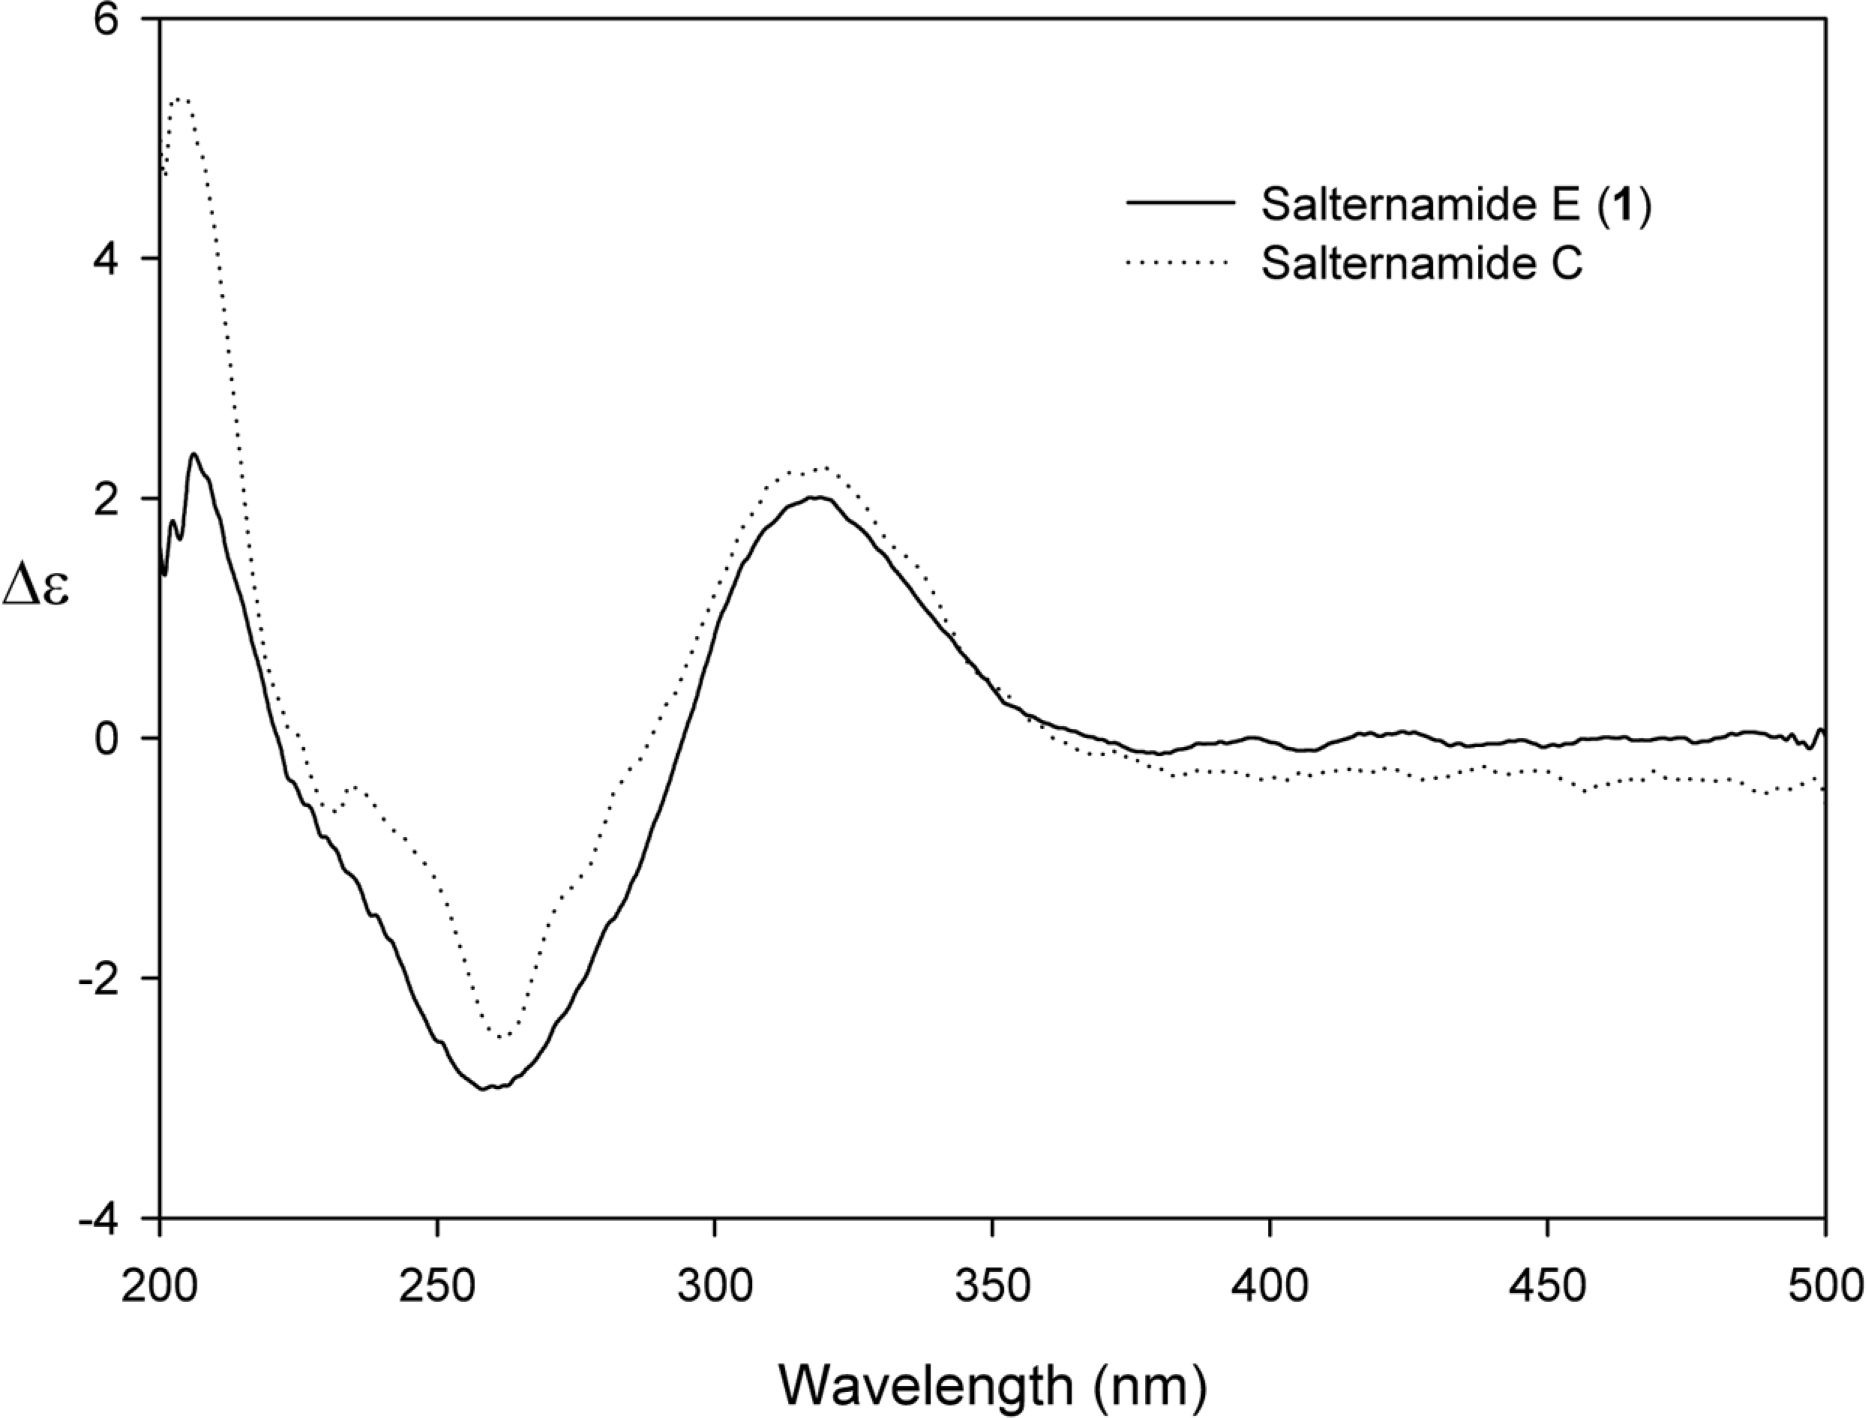
Table 1.
1H and 13C NMR data of 1 in CD3 OD. (δ in ppm, 500 MHz for 1H and 125 MHz for 13C)a
 XML Download