Abstract
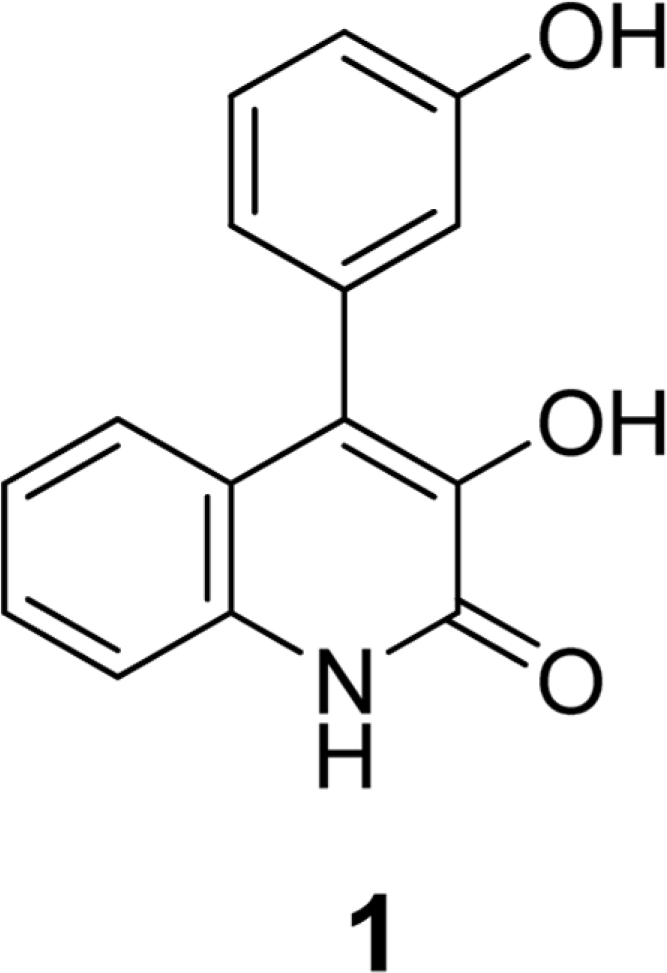
Viridicatol (1) has previously been isolated from the extract of the marine-derived fungus Penicillium sp. SF-5295. In the course of further biological evaluation of this quinolone alkaloid, anti-inflammatory effect of 1 in RAW264.7 and BV2 cells stimulated with lipopolysaccharide (LPS) was observed. In this study, our data indicated that 1 suppressed the expression of well-known proinflammatory mediators such as inducible nitric oxide synthase (iNOS) and cyclooxygenase (COX)-2, and consequently inhibited the production of iNOS-derived nitric oxide (NO) and COX-2-derived prostaglandin E2 (PGE2) in LPS stimulated RAW264.7 and BV2 cells. Compound 1 also reduced mRNA expression of proinflammatory cytokines such as interleukin-1β (IL-1β), interleukin-6 (IL-6), and tumor necrosis factor-α (TNF-α). In the further evaluation of the mechanisms of these anti-inflammatory effects, 1 was shown to inhibit nuclear factor-kappa B (NF-κB) pathway in LPS-stimulated RAW264.7 and BV2 cells. Compound 1 blocked the phosphorylation and degradation of inhibitor kappa B (IκB)-α in the cytoplasm, and suppressed the translocation of NF-κ B p65 and p50 heterodimer in nucleus. In addition, viridicatol (1) attenuated the DNA-binding activity of NF-κ B in LPS-stimulated RAW264.7 and BV2 cells.
Go to : 
REFERENCES
(1). Ingersoll M. A., Platt A. M., Potteaux S., Randolph G. J.Trends Immunol. 2011; 32:470–477.
(2). Sosroseno W., Barid I., Herminajeng E., Susilowati H.Oral Microbiol. Immunol. 2002; 17:72–78.
(3). Block M. L., Zecca L., Hong J. S.Nat. Rev. Neurosci. 2007; 8:57–69.
(4). Jiang F., Ramanathan A., Miller M. T., Tang G. Q., Gale M. Jr., Patel S. S., Marcotrigiano J.Nature. 2011; 479:423–427.
(5). Tsan M. F., Gao B. J.Endotoxin Res. 2007; 13:6–14.
(6). Yang Y. Z., Tang Y. Z., Liu Y. H. J.Ethnopharmacol. 2013; 148:271–276.
(7). Mizuno T., Kurotani T., Komatsu Y., Kawanokuchi J., Kato H., Mitsuma N., Suzumura A.Neuropharmacology. 2004; 46:404–411.
(8). Ivashkiv L. B.Eur. J. Immunol. 2011; 41:2477–2481.
(10). Mancino A., Lawrence T.Clin. Cancer Res. 2010; 16:784–789.
(11). Bremner P., Heinrich M. J.Pharm. Pharmacol. 2002; 54:453–472.
(12). Rateb M. E., Ebel R.Nat. Prod. Rep. 2011; 28:290–334.
(13). Bugni T. S., Ireland C. M.Nat. Prod. Rep. 2004; 21:143–163.
(14). Fremlin L. J., Piggott A. M., Lacey E., Capon R. J. J.Nat. Prod. 2009; 72:666–670.
(15). Sohn J. H., Lee Y. R., Lee D. S., Kim Y. C., Oh H. J.Microbiol. Biotechnol. 2013; 23:1206–1211.
(16). Berridge M. V., Tan A. S.Arch. Biochem. Biophys. 1993; 303:474–482.
(17). Titheradge M. A.Methods Mol. Biol. 1998; 100:83–91.
(18). Karin M., Ben-Neriah Y.Annu. Rev. Immunol. 2000; 18:621–663.
(19). Grilli M., Chiu J. J., Lenardo M. J.Int. Rev. Cytol. 1993; 143:1–62.
(20). Chen F., Sun S. C., Kuh D. C., Gaydos L. J., Demers L. M.Biochem. Biophys. Res. Commun. 1995; 214:985–992.
(21). Saleem M., Ali M. S., Hussain S., Jabbar A., Ashraf M., Lee Y. S.Nat. Prod. Rep. 2007; 24:1142–1152.
(22). Fenical W., Jensen P. R.Nat. Chem. Biol. 2006; 2:666–673.
(23). Lee D. S., Ko W., Quang T. H., Kim K. S., Sohn J. H., Jang J. H., Ahn J. S., Kim Y. C., Oh H.Mar. Drugs. 2013; 11:4510–4526.
(24). Su X., Chen Q., Chen W., Chen T., Li W., Li Y., Dou X., Zhang Y., Shen Y., Wu H., Yu C.Int. Immunopharmacol. 2014; 19:88–93.
(25). Wei M. Y., Yang R. Y., Shao C. L., Wang C. Y., Deng D. S., She Z. G., Lin Y. C.Chem. Nat. Compd. 2011; 47:322–325.
Go to : 
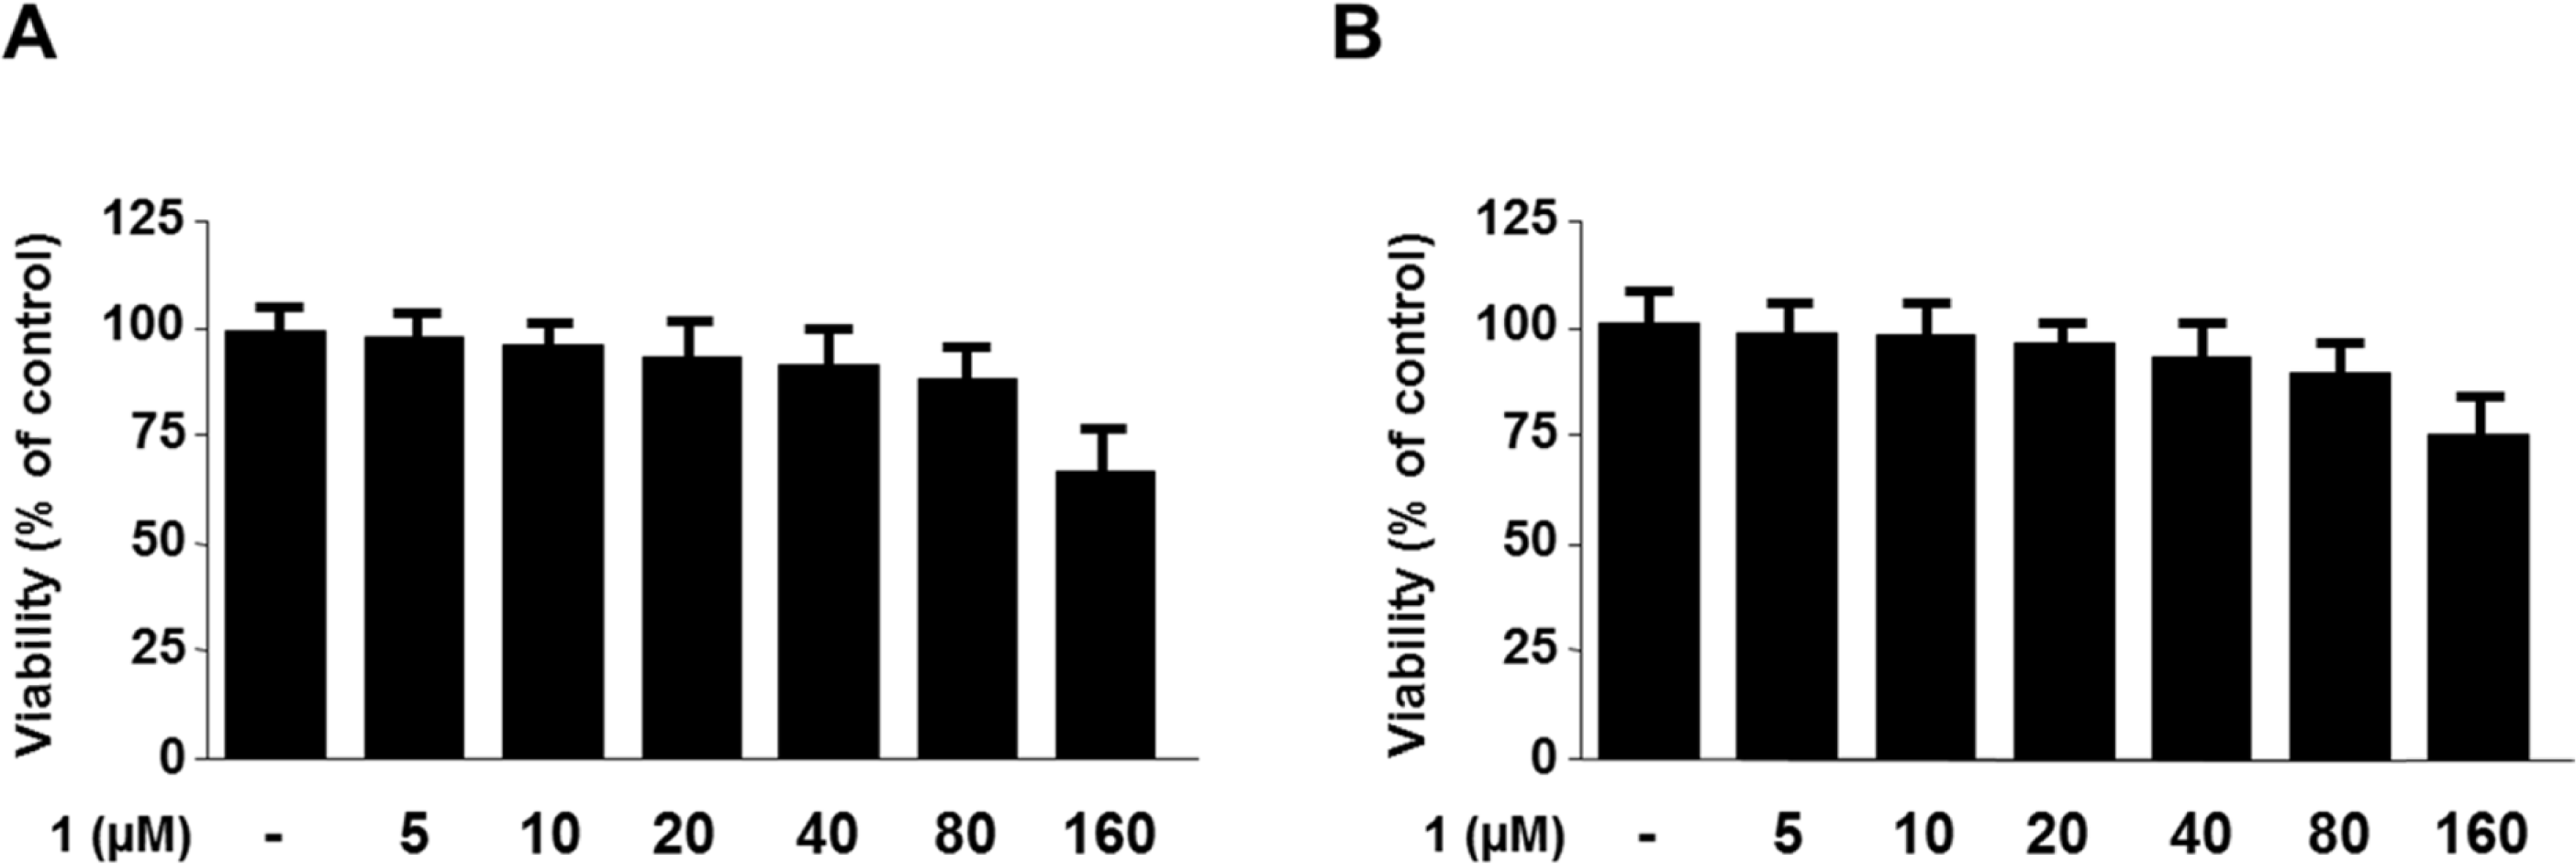 | Fig. 2.Effects of 1 on cell viability. RAW264.7 (A) and BV2 cells (B) were incubated for 24 h with various concentrations of 1 (1 - 160μ M). Cell viability was determined by MTT assay. Each bar represents the mean ± S.D. of three independent experiments. |
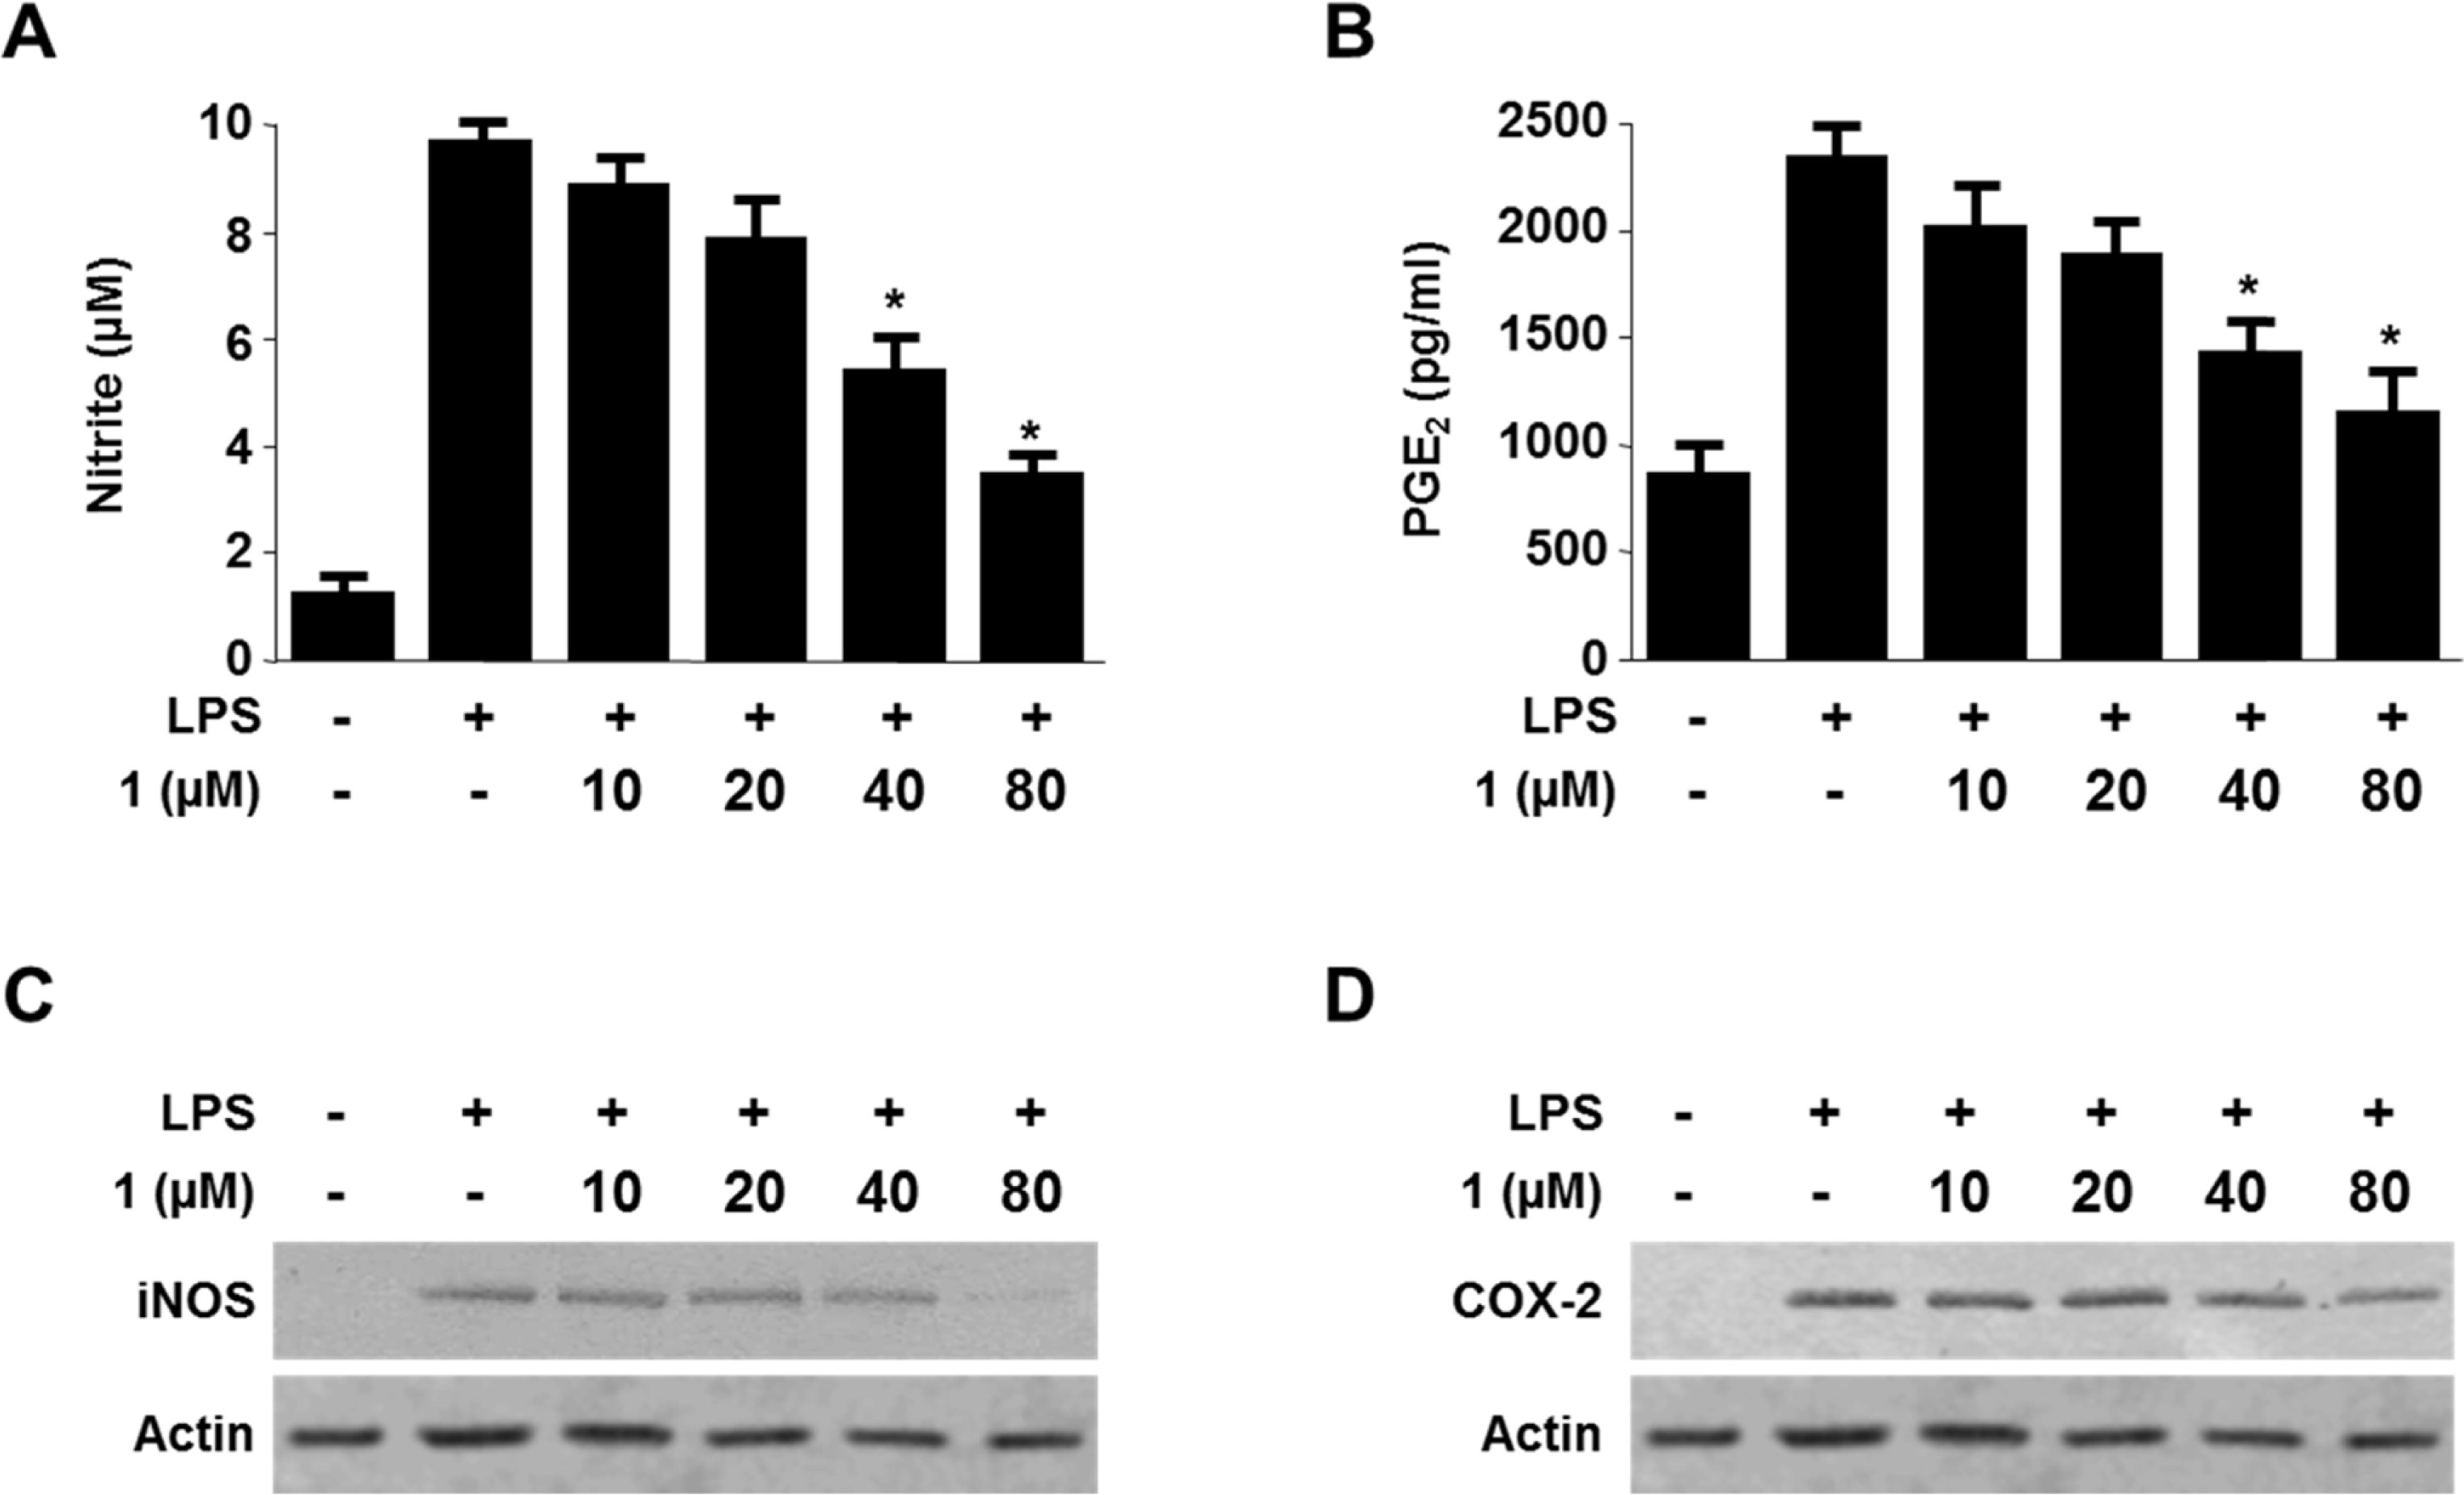 | Fig. 3.Effects of 1 on the protein expression of nitrite (A), PGE2 (B) iNOS (C) and COX-2 (D) in RAW 264.7 cells stimulated with LPS. The cells were pre-treated for 3 h with indicated concentrations of 1, and then stimulated for 24 h with LPS (1 μ g/mL). The concentrations of nitrite, PGE2 and Western blot analysis were performed as described in the experimental section, and representative data of three independent experiments are shown. ∗p < 0.05 compared with the LPS. |
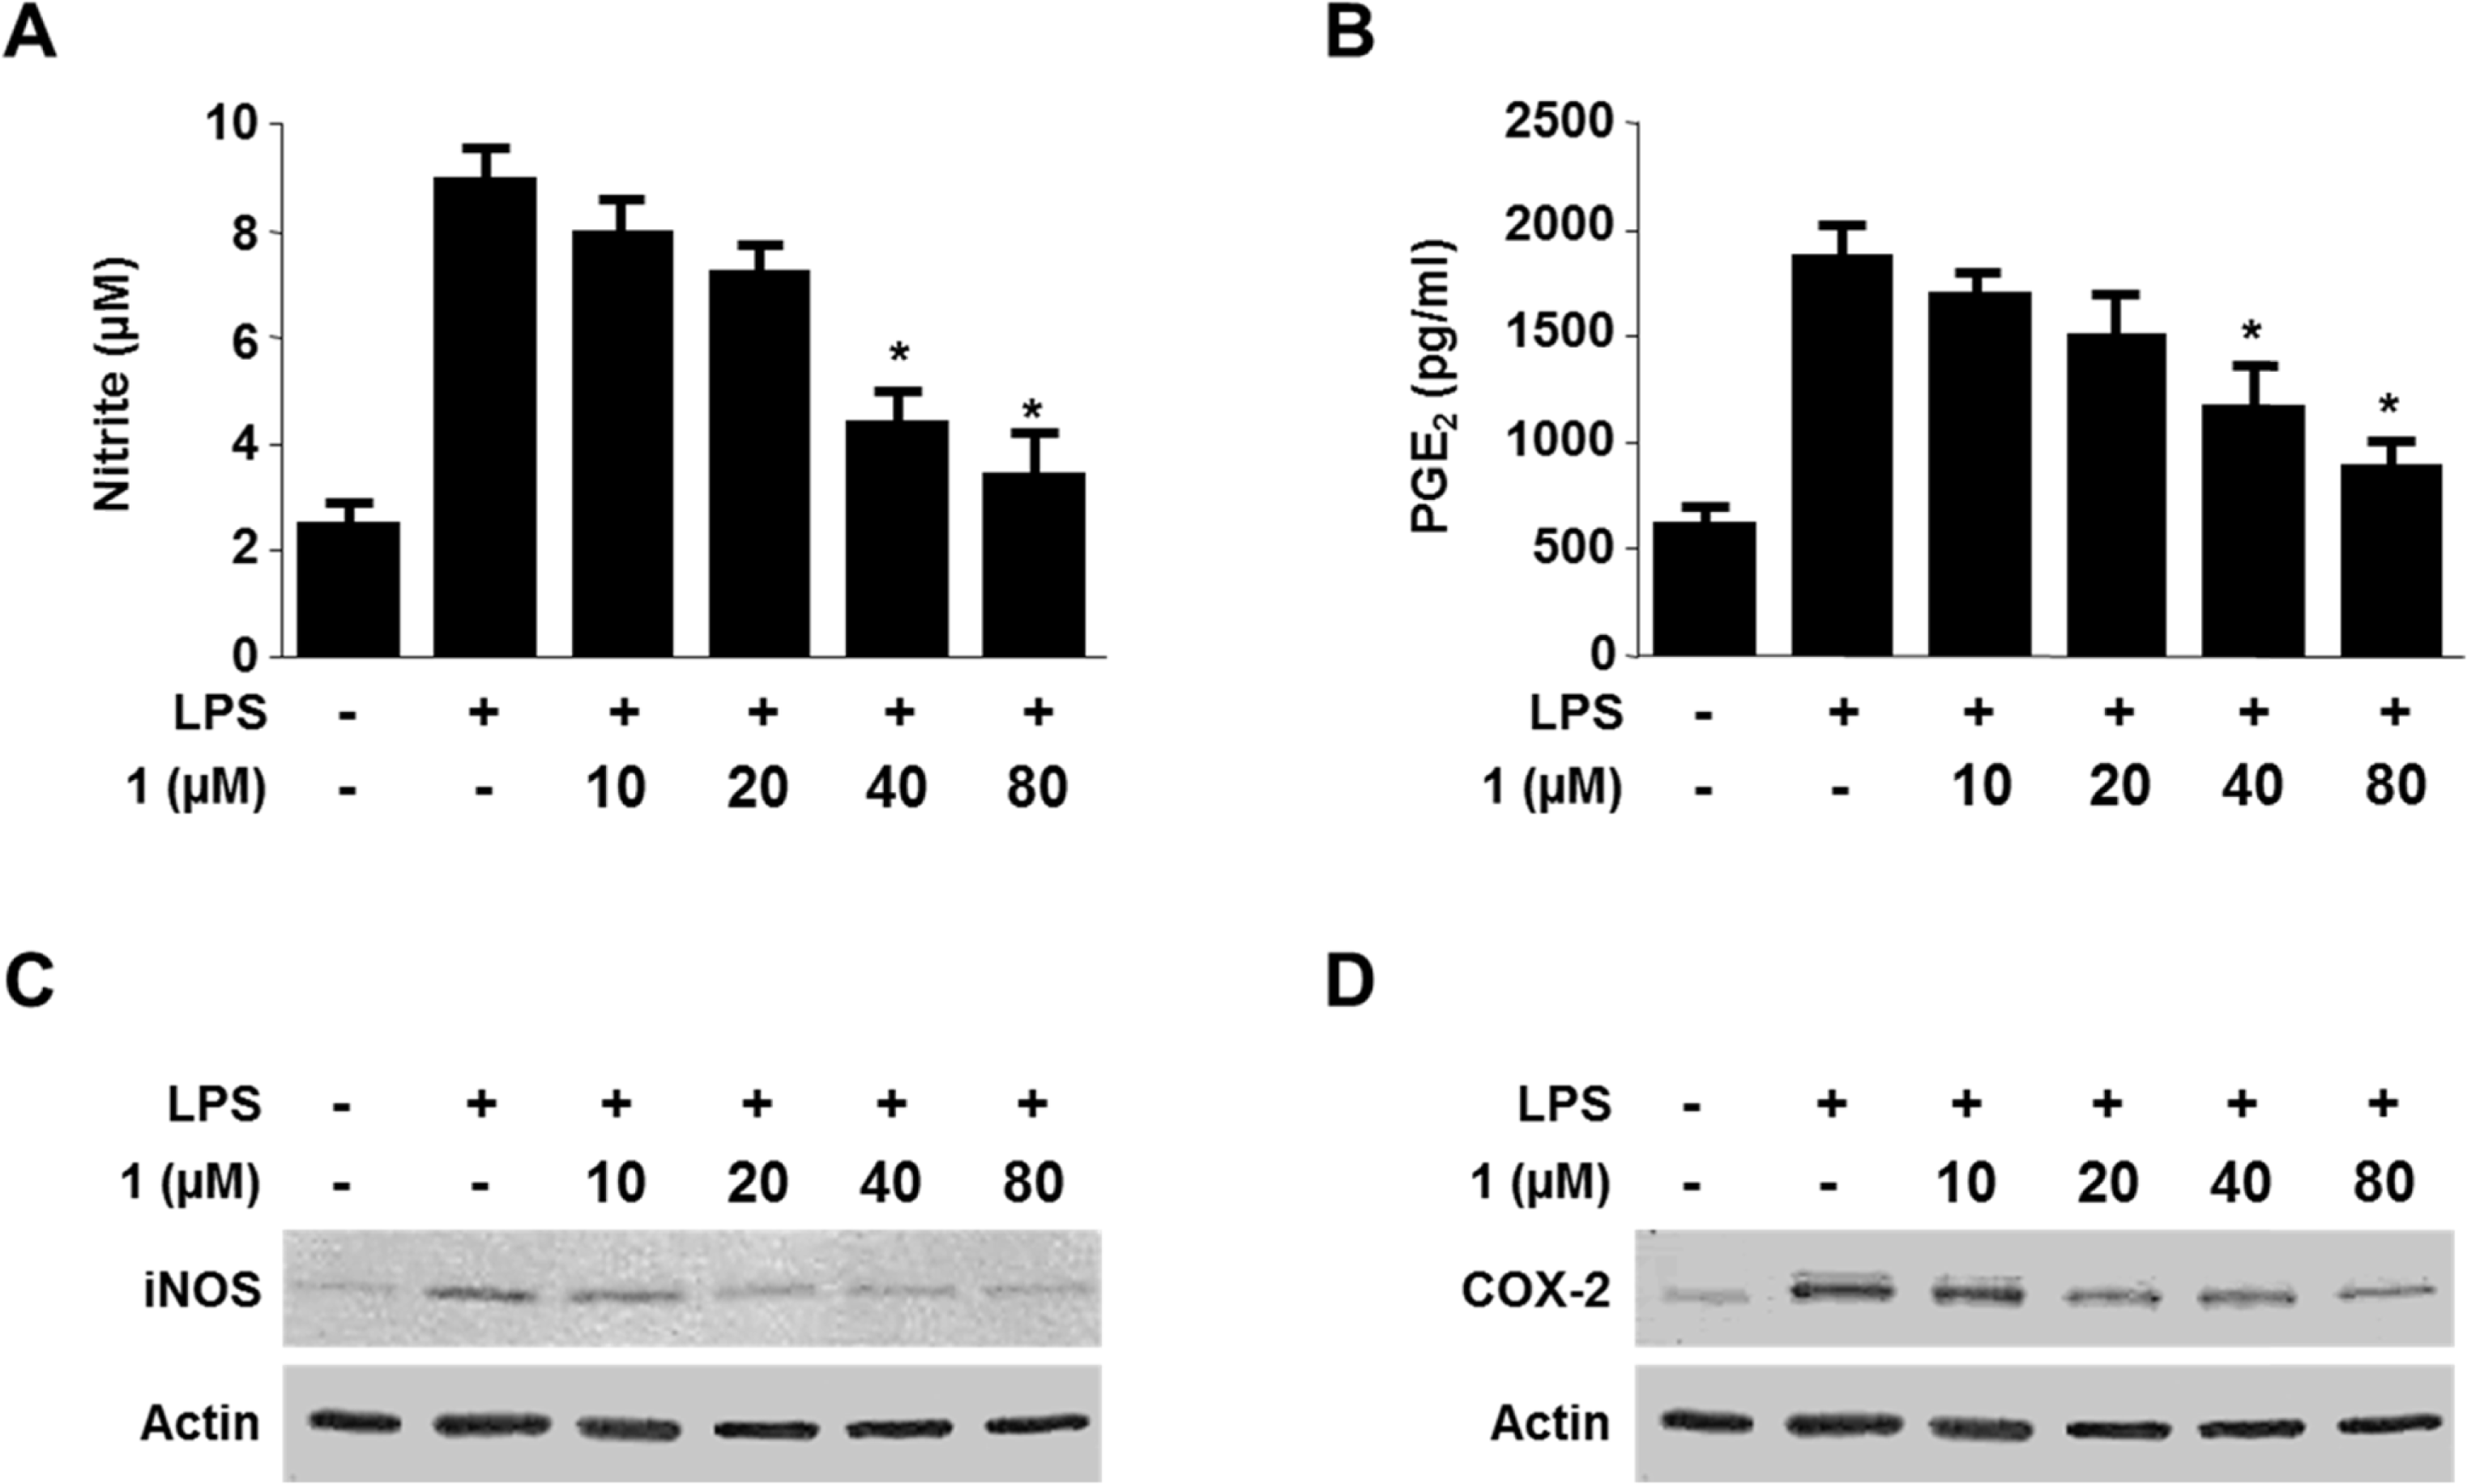 | Fig. 4.Effects of 1 on the protein expression of nitrite (A), PGE2 (B) iNOS (C) and COX-2 (D) in BV2 cells stimulated with LPS. The cells were pre-treated for 3 h with indicated concentrations of 1, and then stimulated for 24 h with LPS (1 μg/mL). The concentrations of nitrite, PGE2 and Western blot analysis were performed as described in the experimental section, and representative data of three independent experiments are shown. ∗p < 0.05 compared with the LPS. |
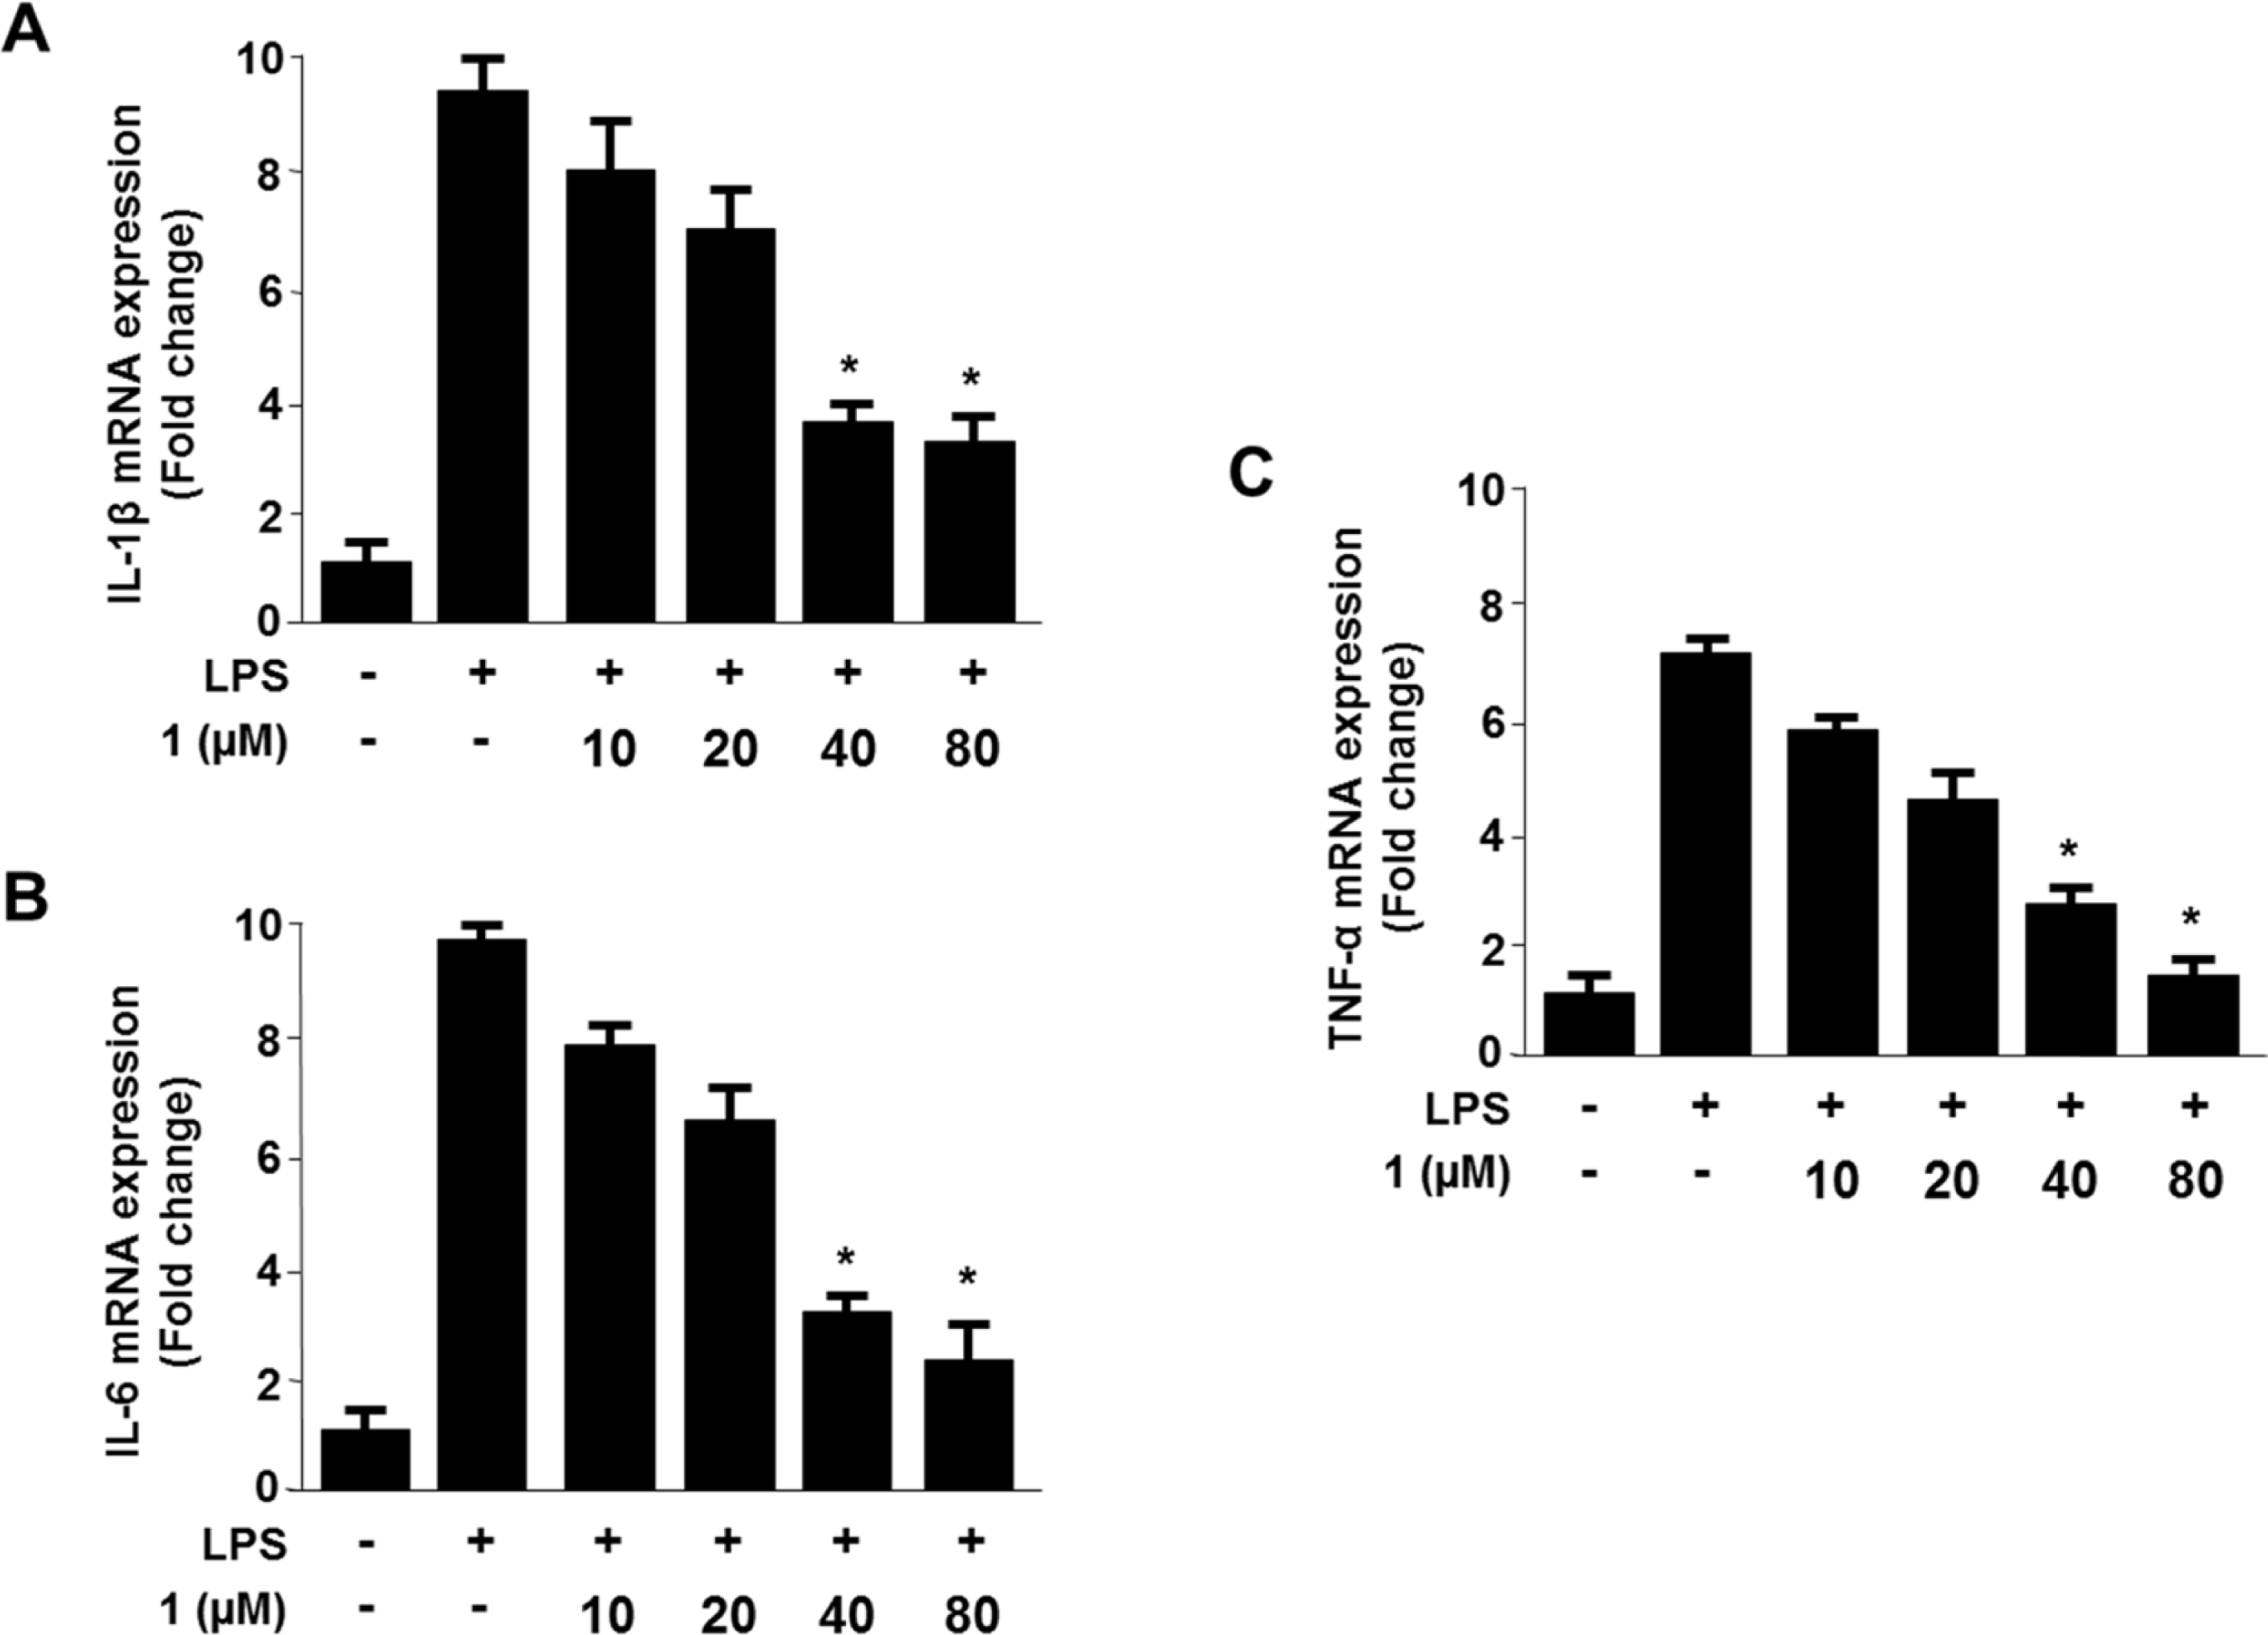 | Fig. 5.Effects of 1 on IL-1β mRNA (A), IL-6 mRNA (B), and TNF-α mRNA (C) expression in RAW264.7 cells. Cells were incubated with the indicated concentrations of 1 for 3 h, and then treated for 6 h with LPS (1 μg/mL). RNA quantification for IL-1β, IL-6 and TNF-α expression were performed as described in the experimental section. Data shown represent the mean values of three independent experiments. ∗p < 0.05 compared with the LPS. |
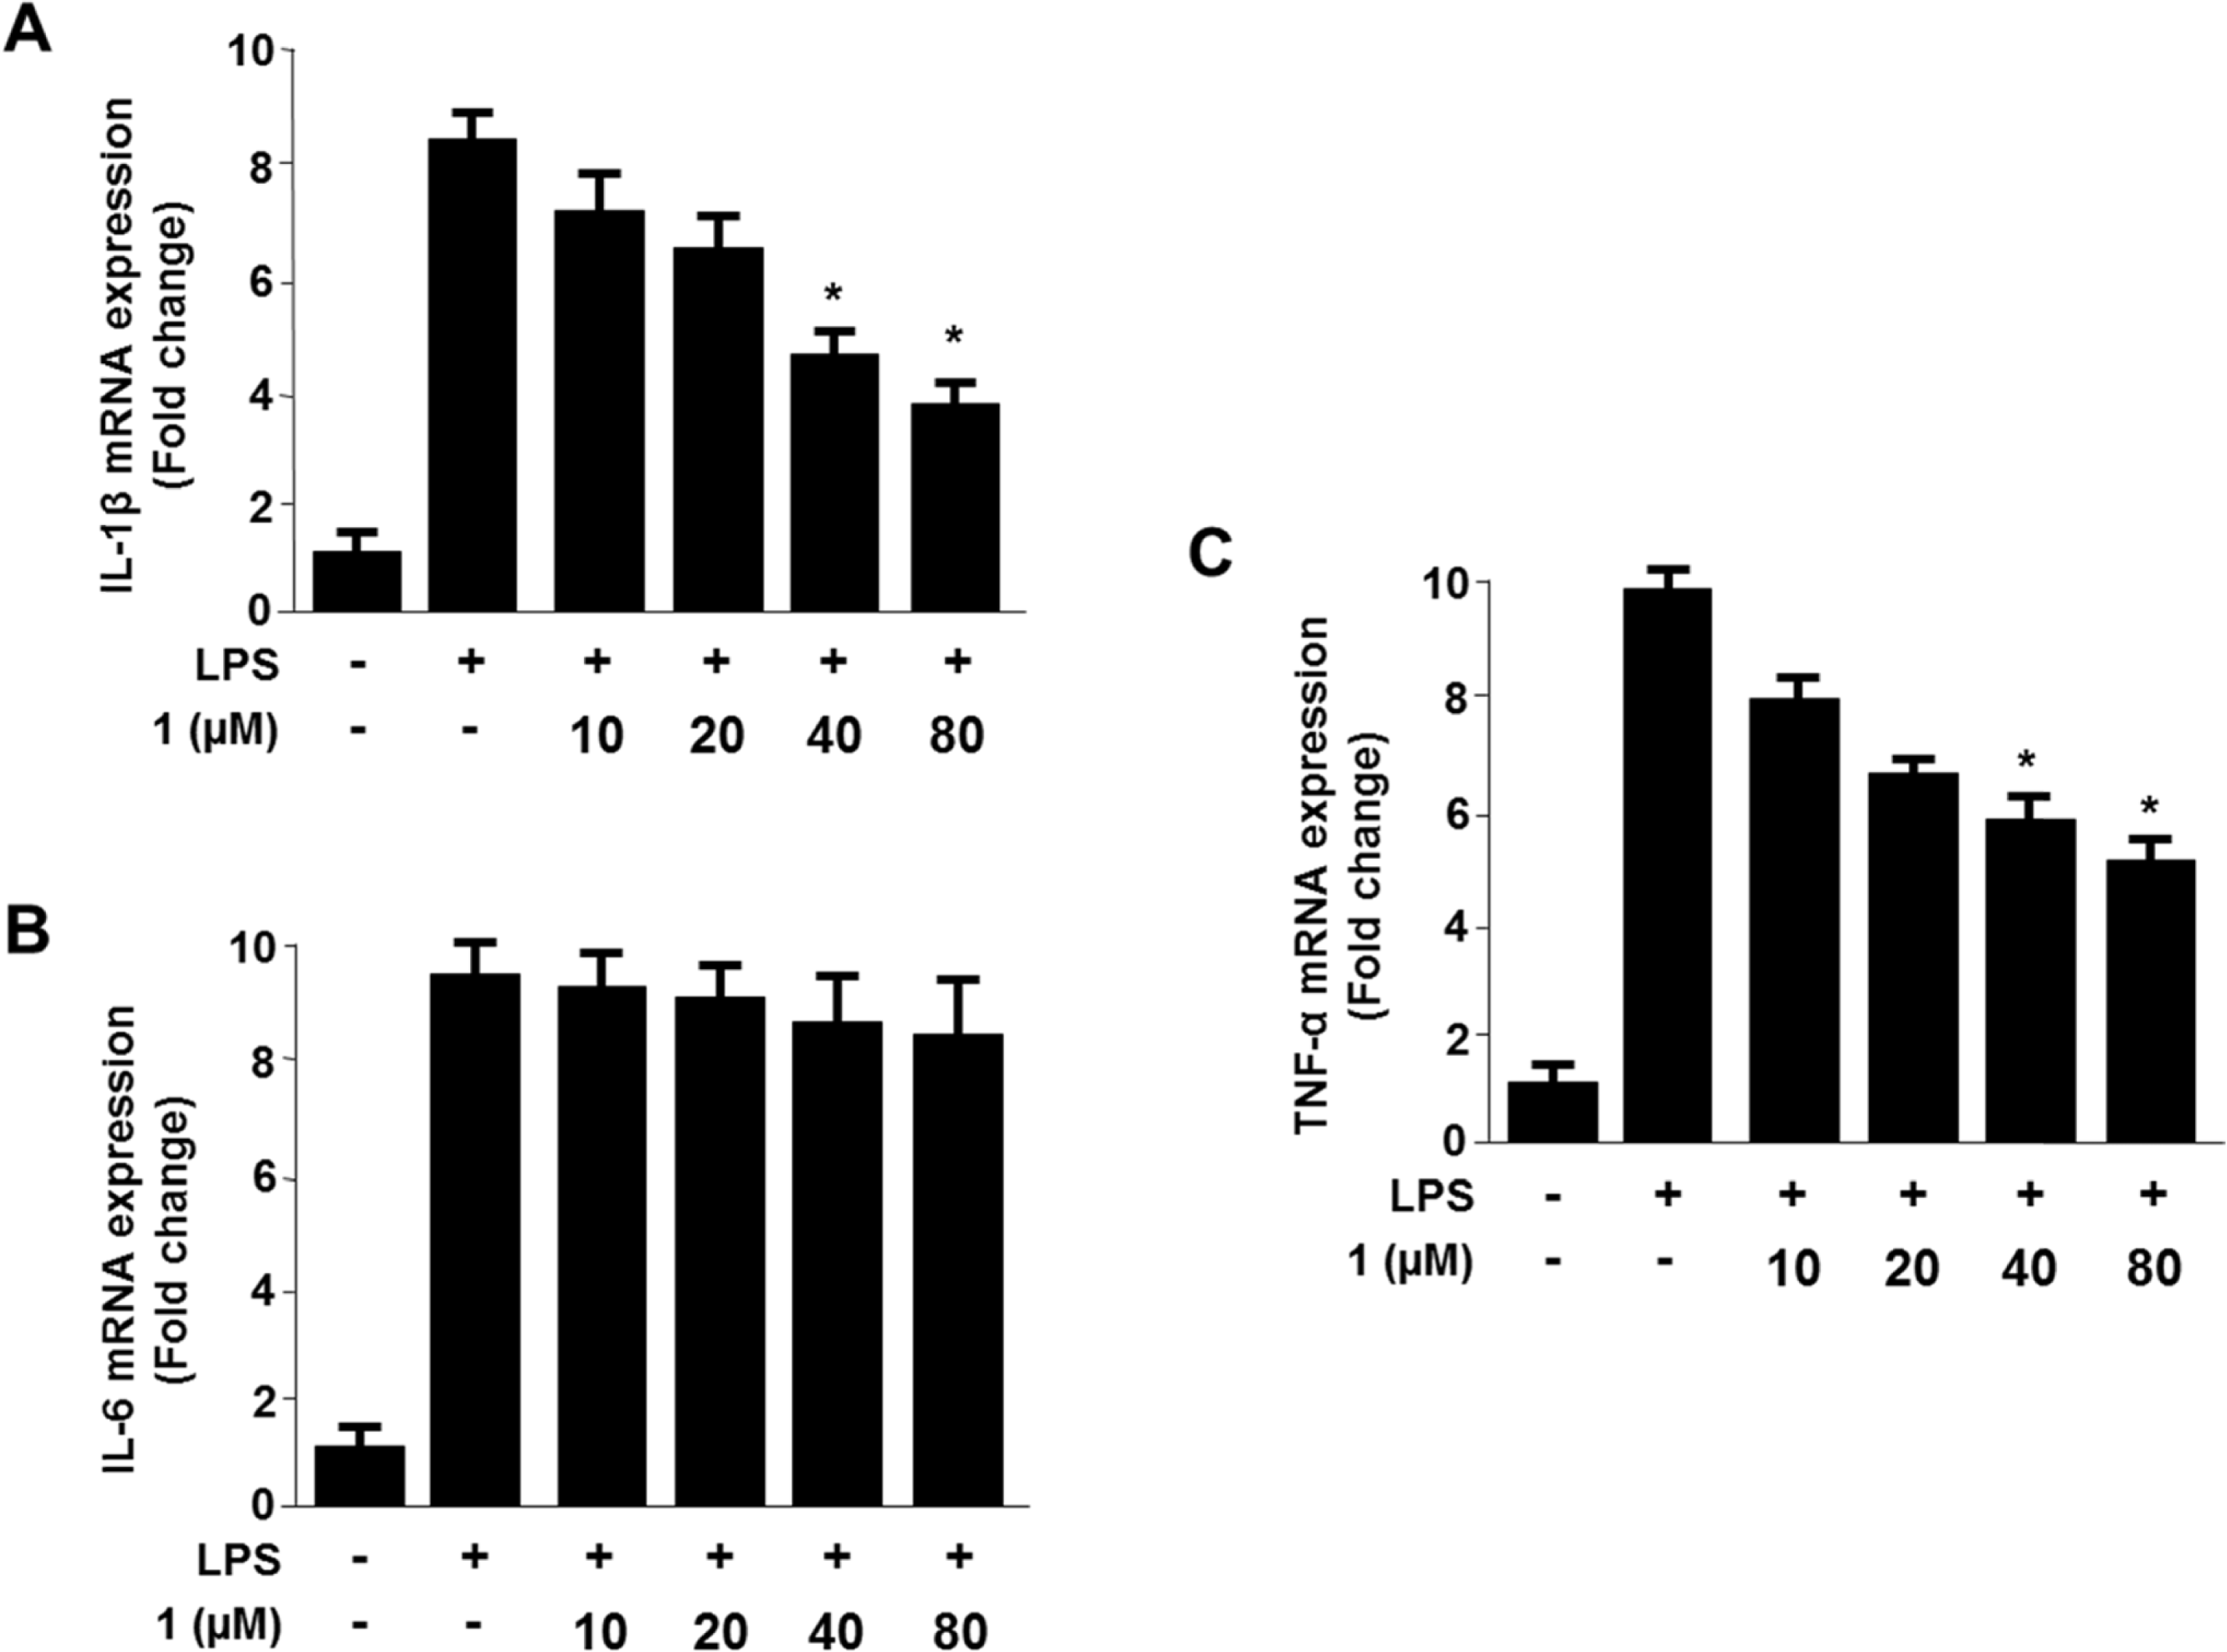 | Fig. 6.Effects of 1 on IL-1β mRNA (A), IL-6 mRNA (B), and TNF-α mRNA (C) expression in BV2 cells. Cells were incubated with the indicated concentrations of 1 for 3 h, and then treated for 6 h with LPS (1 μg/mL). RNA quantification for IL-1β, IL-6 and TNF-α expression were performed, as described in the experimental section. Data shown represent the mean values of three independent experiments. ∗p < 0.05 compared with the LPS. |
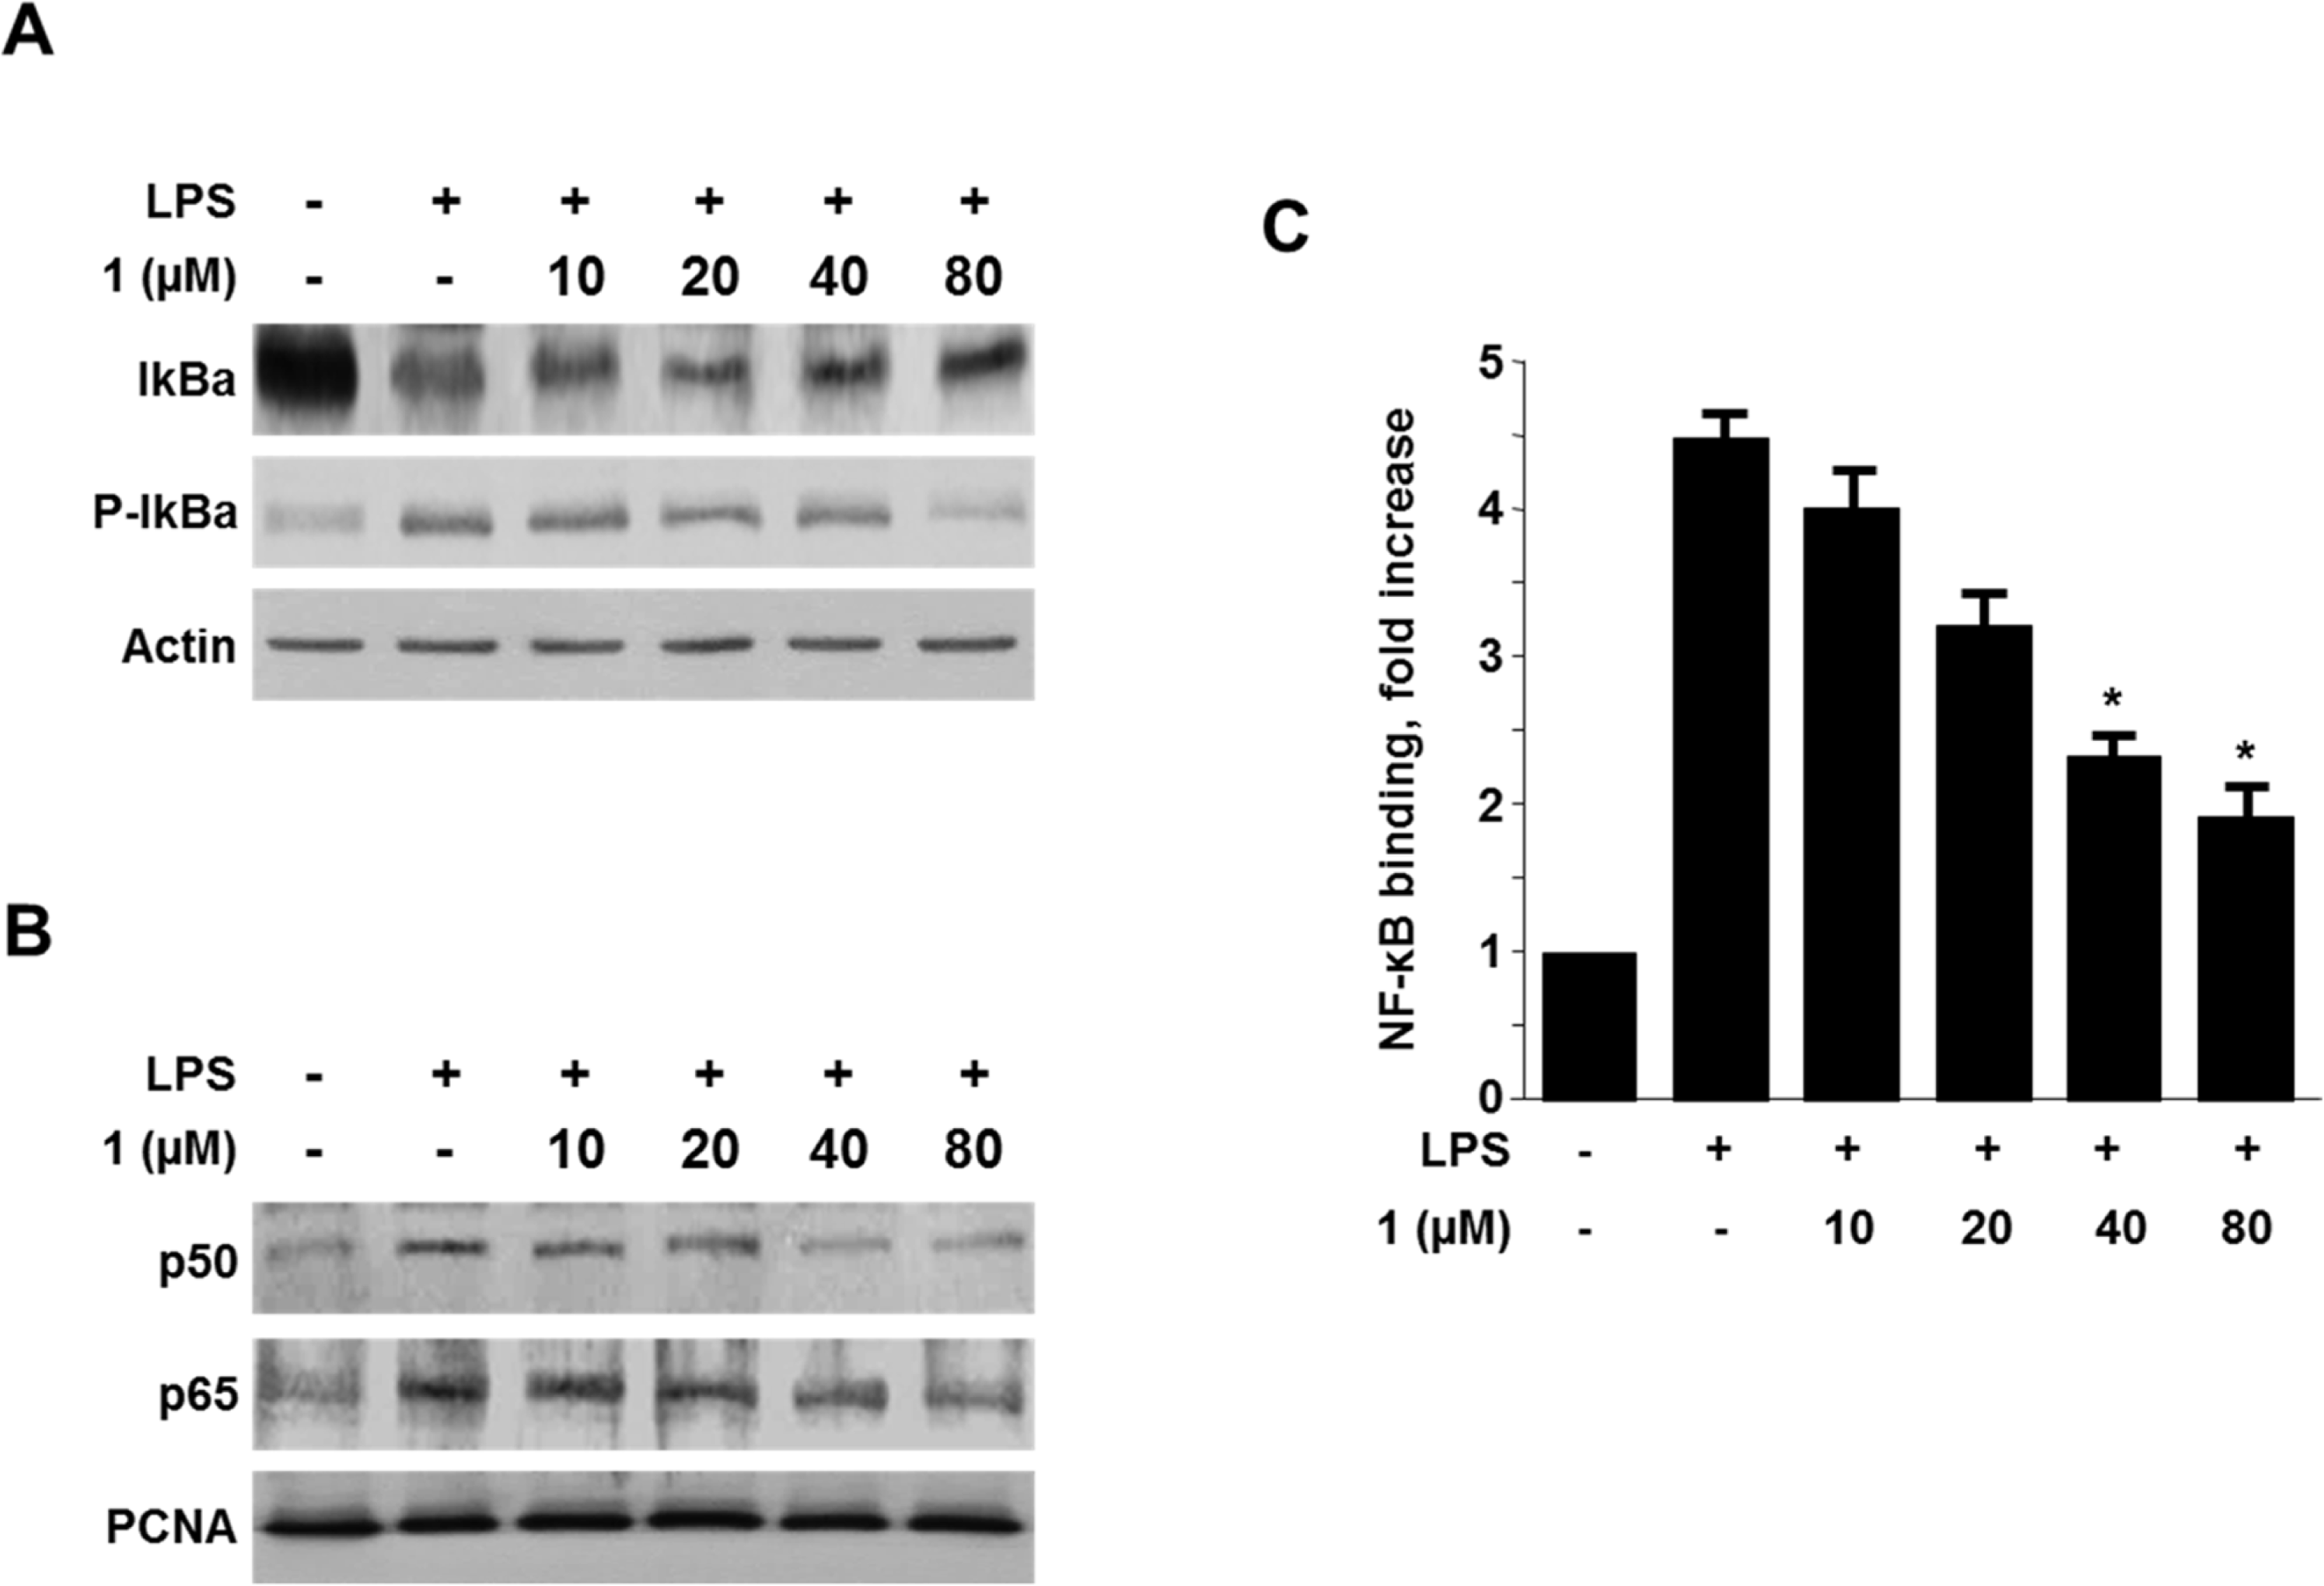 | Fig. 7.Effects of 1 on the Iκ B-α phosphorylation and degradation (A), NF-κ B activation (p65 and p50), and NF-κ B DNA-binding activity (C). RAW264.7 cells were pre-treated with the indicated concentrations of 1 for 3 h, and then stimulated with LPS (1 μg/mL) for 1 h. The western blot analysis of IκBα and p-IκBα in the cytoplasm and NF-κB in the nucleus was performed as described in the experimental section. The representative blots of three independent experiments are shown. A commercially available NF-κB ELISA (Active Motif) was then used to test nuclear extracts and to determine the degree of NF-κB binding. The data represent the mean values of 3 experiments ± SD. ∗P < 0.05 compared with the group treated with LPS. |
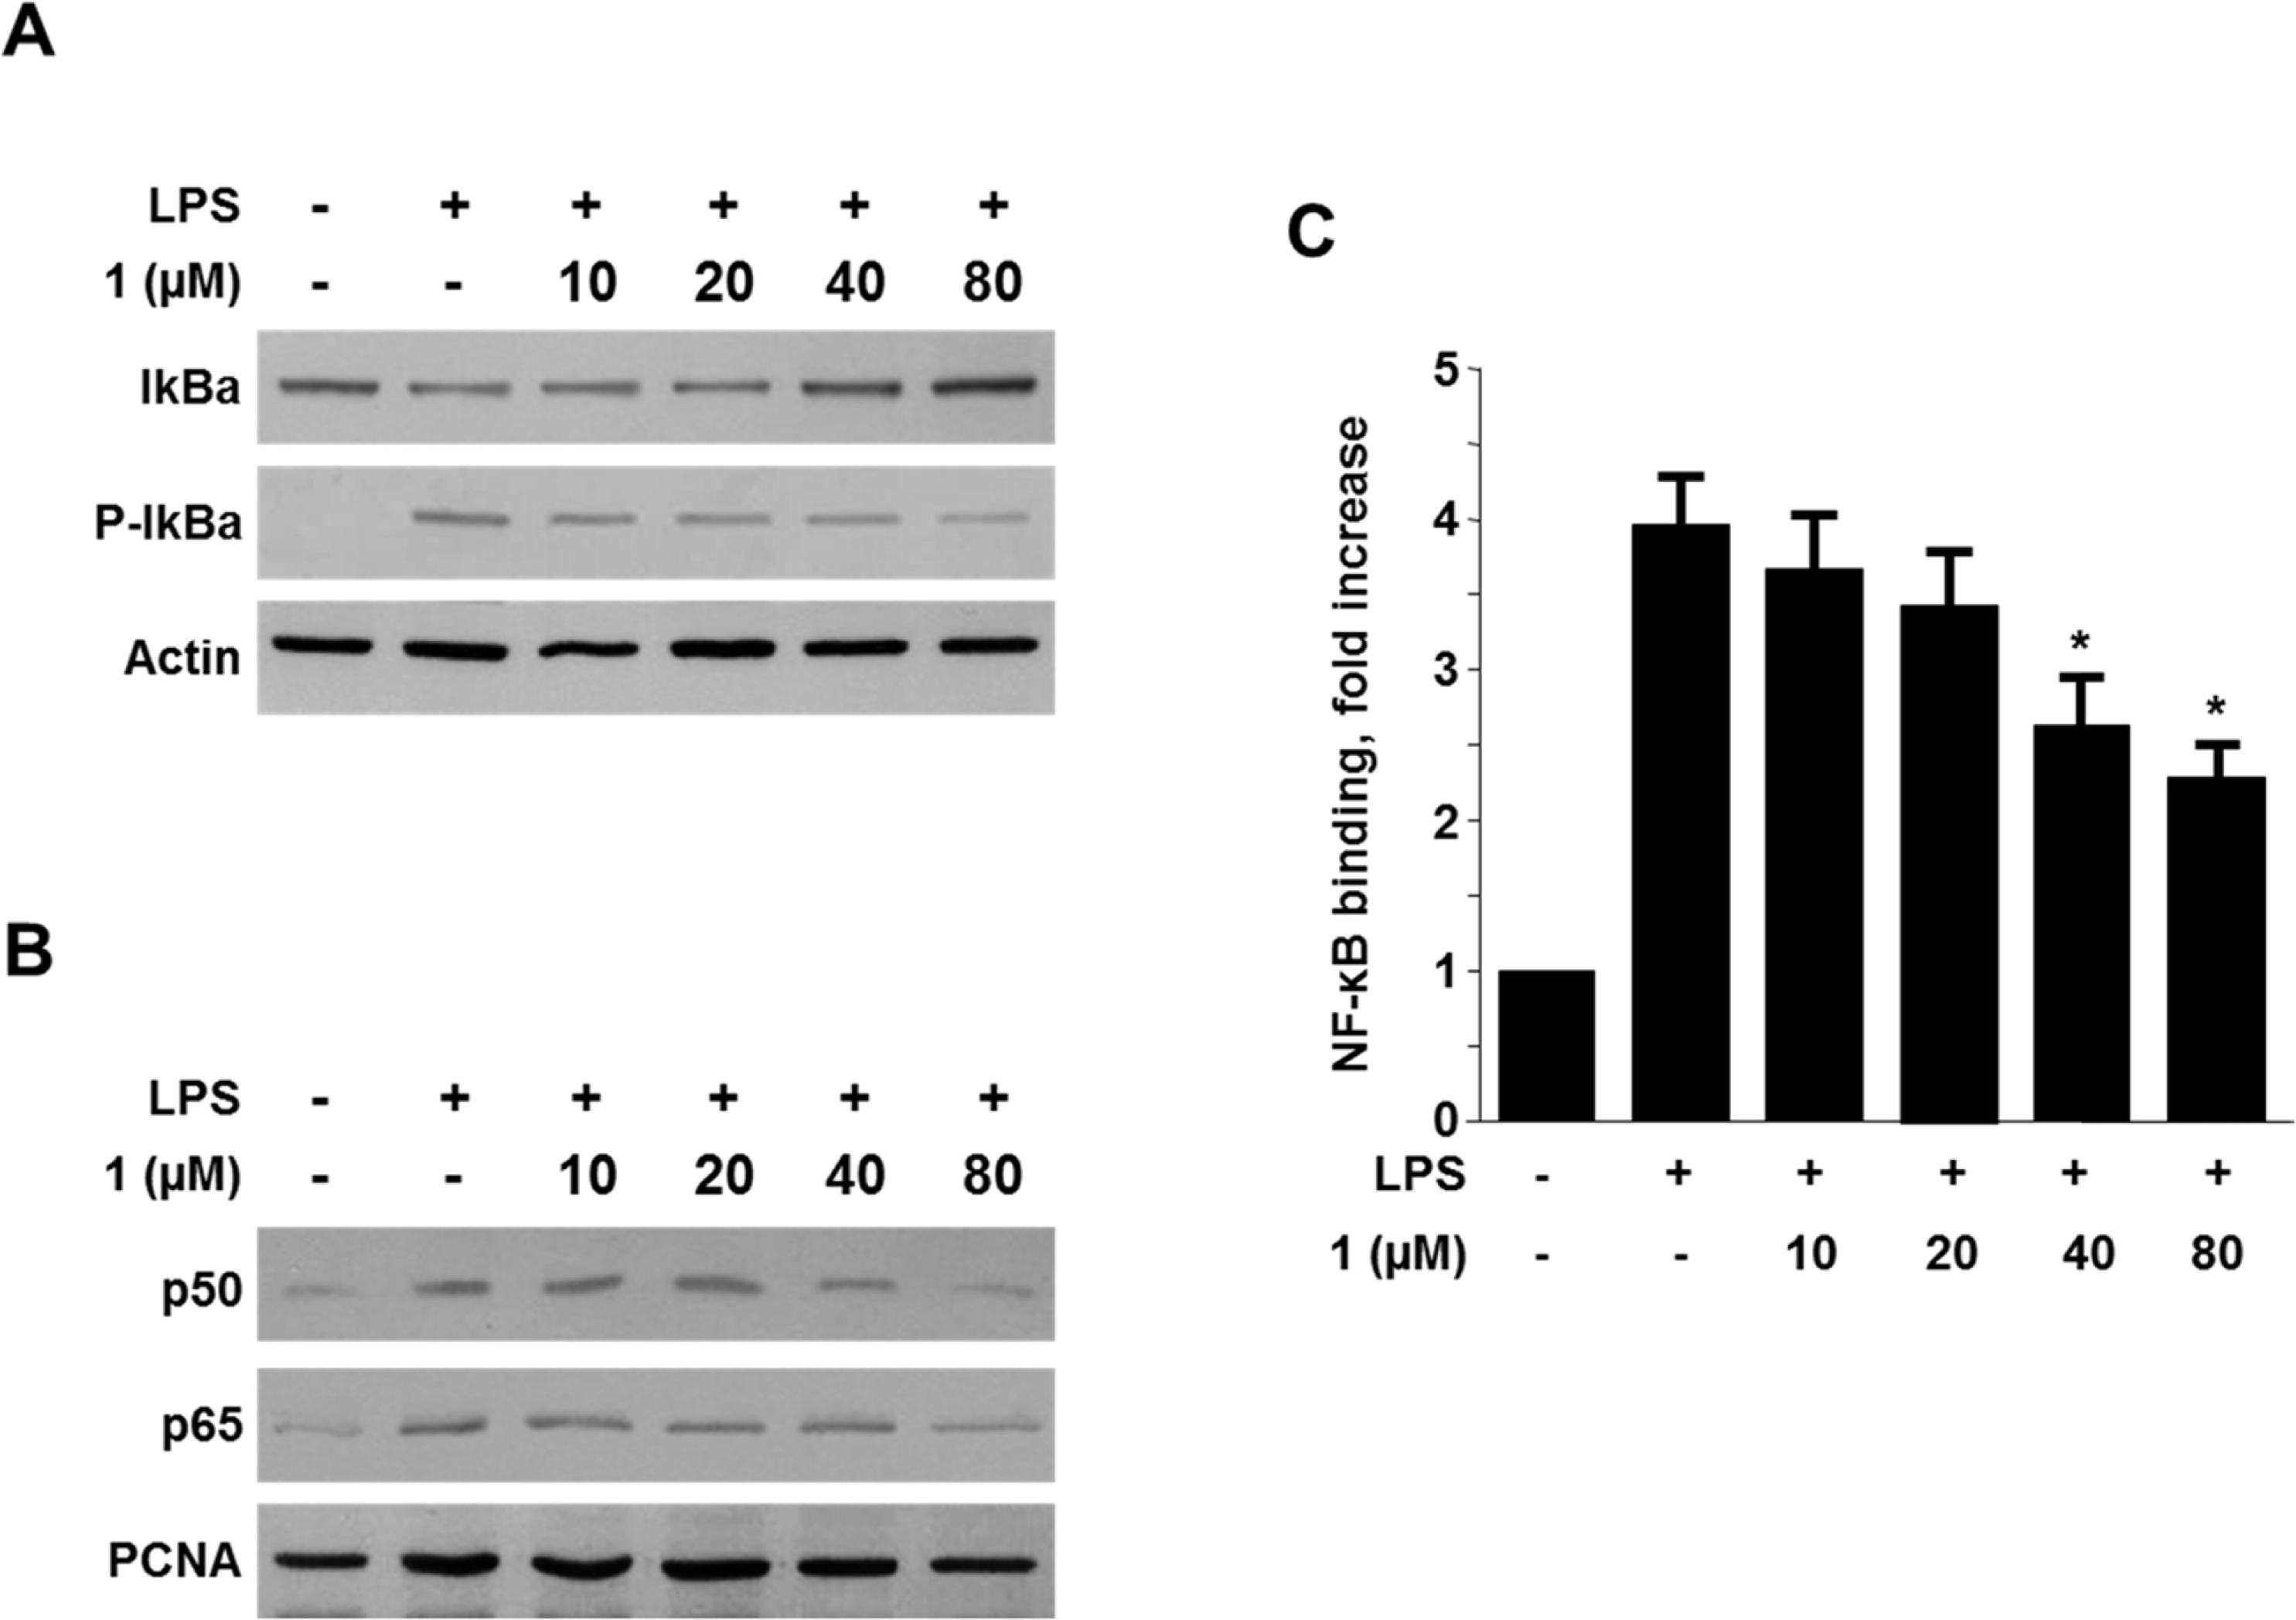 | Fig. 8.Effects of 1 on the Iκ B-α phosphorylation and degradation (A), NF-κ B activation (p65 and p50), and NF-κ B DNA-binding activity (C). BV2 cells were pre-treated with the indicated concentrations of 1 for 3 h, and then stimulated with LPS (1 μg/mL) for 1 h. The western blot analysis of Iκ Bα and p-Iκ Bα in the cytoplasm and NF-κ B in the nucleus was performed as described in the experimental section. The representative blots of three independent experiments are shown. A commercially available NF-κB ELISA (Active Motif) was then used to test nuclear extracts and to determine the degree of NF-κB binding. The data represent the mean values of 3 experiments ± SD. ∗P < 0.05 compared with the group treated with LPS. |


 PDF
PDF ePub
ePub Citation
 Print
Print


 XML Download