This article has been
cited by other articles in ScienceCentral.
Abstract
Background
It is important to evaluate preoperative anxiety and prepare sedation when performing dental surgery under local anesthesia. Spielberger's State-Trait Anxiety Inventory (STAI) is useful for predicting preoperative anxiety. State anxiety is defined as a subjective feeling of nervousness. Reduction in the number of the state anxiety items (questions) will be clinically important in allowing us to predict anxiety more easily.
Methods
We analyzed the STAI responses from 1,252 patients who visited our institution to undergo dental surgery under local anesthesia. Multiple linear regression analysis was conducted for 9 groups comprising anxiety level determinations using the STAI; we then developed a coefficient of determination and a regression formula. We searched for a group satisfying the largest number of requirements for regression expression while setting any necessary conditions for accurately predicting anxiety before dental surgery under local anesthesia.
Results
The regression expression from the group determined as normal for preoperative state anxiety was deemed the most suitable for predicting preoperative anxiety.
Conclusions
It was possible to reduce the number of items in the STAI by focusing on “Preoperative anxiety before dental surgery.”
Keywords: Dental Anxiety, Preoperative Anxiety, Questionnaire, Test Anxiety, State-Trait Anxiety Inventory-form X
INTRODUCTION
The oral area is innervated by the trigeminal nerve and has a low pain threshold; patients often experience anxiety and fear before dental procedures [
12]. It is inferred that anxiety will be relatively higher before dental surgery, such as wisdom tooth extraction under local anesthesia.
To smoothly and safely perform dental surgery under local anesthesia, it is necessary to quantitatively evaluate the anxiety before surgery to identify patients with a high degree of anxiety. In those cases, the practitioner may implement an appropriate whole-body management method such as psychosedation.
The Spielberger State-Trait Anxiety Inventory (STAI) [
3] can be used to simultaneously evaluate the levels of state and trait anxiety. State anxiety is defined as a subjective feeling of nervousness. Trait anxiety is an individual's underlying tendency to perceive a situation a certain way.
We assessed presurgical anxiety using the STAI and intravenously sedated patients with high levels of state anxiety. The ability to predict anxiety with fewer questions is considered to have clinical importance, as it may reduce the mental burden on the patient and shorten the examination time.
Numerous studies have reported that anxiety can be correctly judged using the STAI, even if the number of questions on specific subjects related to state anxiety is reduced [
456789]. We focused on characteristic questions on state anxiety before oral and maxillofacial surgery under local anesthesia. We report on methods for reducing the number of questions on state anxiety in the STAI-form X that can be administered before dental surgery under local anesthesia.
MATERIALS AND METHODS
This study was approved by the Ethics Committee of Fukuoka University Hospital (Number 16-2-19). The STAI-form X (STAI-X) used in this study was the Japanese version [
10]. We analyzed 1,252 questionnaires in which all items of the STAI-X were completed by patients who visited our hospital from September 2009 to February 2015 to develop a plan for surgery under local anesthesia.
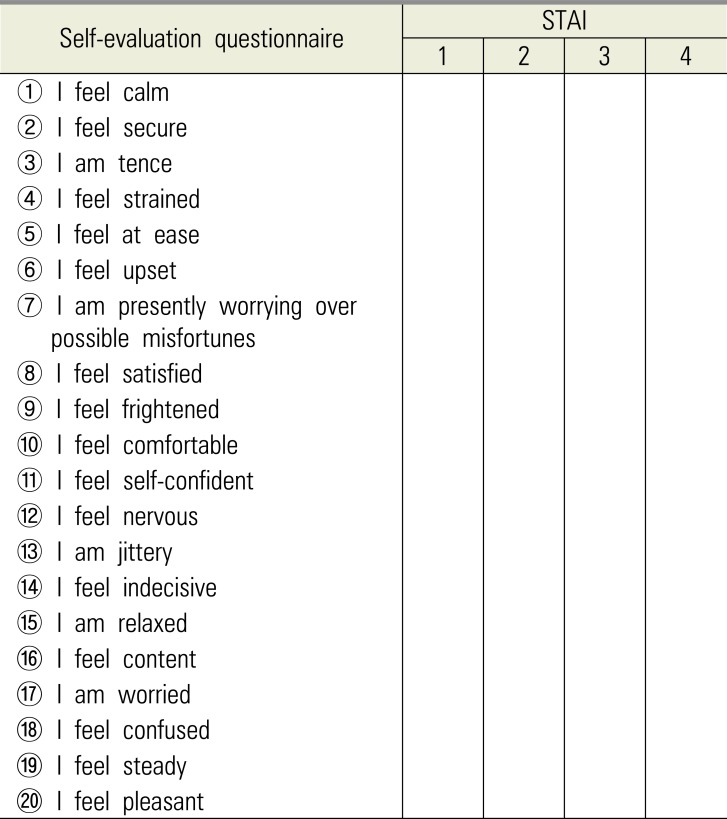
The answer sheet for the STAI-X is a double-sided page; the front contains questions on state anxiety (
Table 1), and the back contains questions on trait anxiety. The scores of both sides are posted on the inside of the recording paper. When we asked patients to complete the STAI-X form, we explained that the front asks about their feelings on the day of consultation in preparation for surgery, while the back asks about their usual feelings, irrespective of surgery.
Both the state and trait scales consist of 20 items; the responses range from 1 to 4 points (forced choice). Both scales include direct and reverse-worded items. The scores range from 20 to 80, with higher scores suggesting greater levels of anxiety. The STAI classifies anxiety into five stages: stages 1 and 2 suggest mild anxiety; stage 3 suggests moderate anxiety, and stages 4 and 5 suggest severe anxiety (
Fig. 1). We extracted gender, age, the trait anxiety and state anxiety scores, and the anxiety stage (≤ III, IV, V), as determined by the STAI-X.
A multiple regression analysis with a brute-force method (BFM) was performed to determine the coefficient of determination (R2) values using one model in which all explanatory variables were included, and one model in which combinations of variables were included. We therefore developed a software program that allows for application of the BFM. In the analysis, we set the total score of the state anxiety question items as the target variable, and all state anxiety question items were used as explanatory variables. The R2 indicates the degree of variance in a dependent variable that can be predicted from independent variables. We searched for a model in which the R2 was high, with a small number of explanatory variables.
First, a multiple regression analysis was performed for each of 9 groups, which were classified according to the anxiety stage; the regression expression of state anxiety and the R
2 values of each group were obtained. The 9 groups were classified as follows: (1) AL group, all patients regardless of their anxiety stage; (2) SH group, high state anxiety regardless of the stage of trait anxiety; (3) SN group, normal state anxiety; (4) TH group, high trait anxiety regardless of the stage of state anxiety; (5) TN group, normal trait anxiety; (6) H-H group, with high state anxiety and high trait anxiety; (7) H-N group, high state anxiety and normal trait anxiety; (8) N-H group, normal state anxiety and high trait anxiety; and (9) N-N group, normal state anxiety and normal trait anxiety. Next, among the regression expressions obtained from each group, the expression in which R
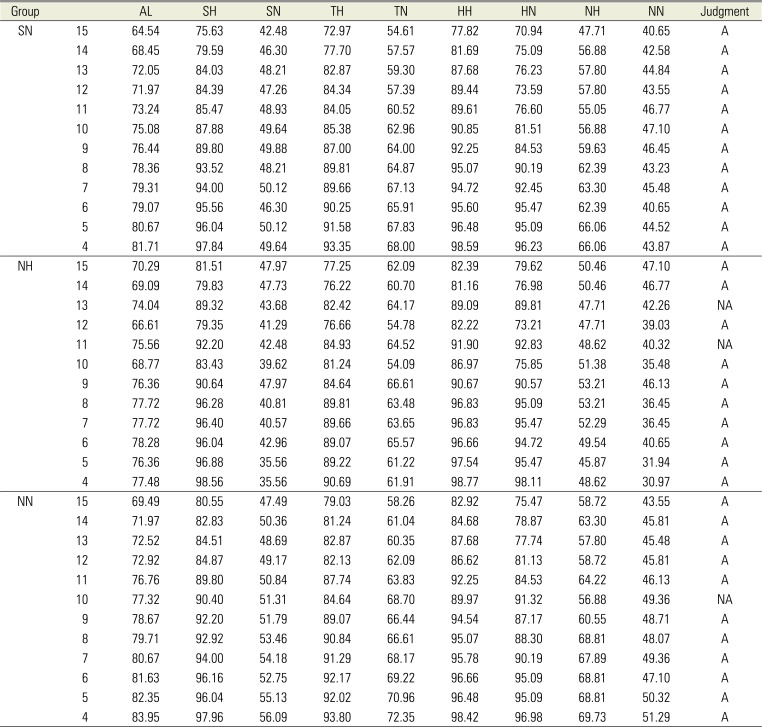
2 was highest when the number of questionnaires was reduced from 20 to 15 items was applied to all groups, and the total score points were calculated. Similar calculations were conducted until the number of questionnaires was reduced to 4 items. The upper segment proportion (US-proportion) was then calculated from the upper segment (US) and lower segment (LS) of the regression line (
Fig. 2).
The SH group comprises the HH group and the HN group. Similarly, the SN group comprises the NH group and the NN group. The purpose of this research was to reduce the number of state anxiety question items appropriately. Analysis was carried out for the HH, HN, NH, and NN groups, considering the influence of trait anxiety. More specifically, the condition is that the US-proportion of the HH group is the largest, followed by the HN group, the NH group, and the NN group. In terms of the value obtained by regression expression, false positives—including US—may be at higher risk to become false negatives included in the LS. Therefore, in addition to this condition, we decided to search for a regression expression to determine a US-proportion greater than 60%.
RESULTS
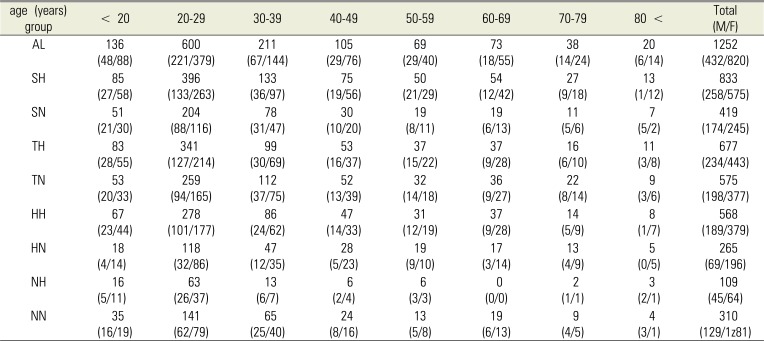
The STAI responses of 820 women and 432 men were analyzed. The average age was 32.8 ± 16.1 years; most of the patients were women in their twenties. A total of 667 patients had a trait anxiety stage of ≥ IV. A total of 833 patients had a high state anxiety stage. The number of patients in each group is shown in
Table 2.
In the multiple regression analysis (using the BFM) of state anxiety in the SN group, the R2—when the number of state anxiety stage question items was reduced to 10— was 0.96. The regression expression in this case was as follows:
Total score = (1.48 × ① [score of] + 1.32 × ③ + 1.54 × ④ + 1.70 × ⑤ + 1.63 × ⑦ + 1.96 × ⑧ + 1.75 × ⑨ + 1.72 × ⑫ + 2.27 × ⑯ + 2.11 × ⑳ + 4.15) (
Table 3).
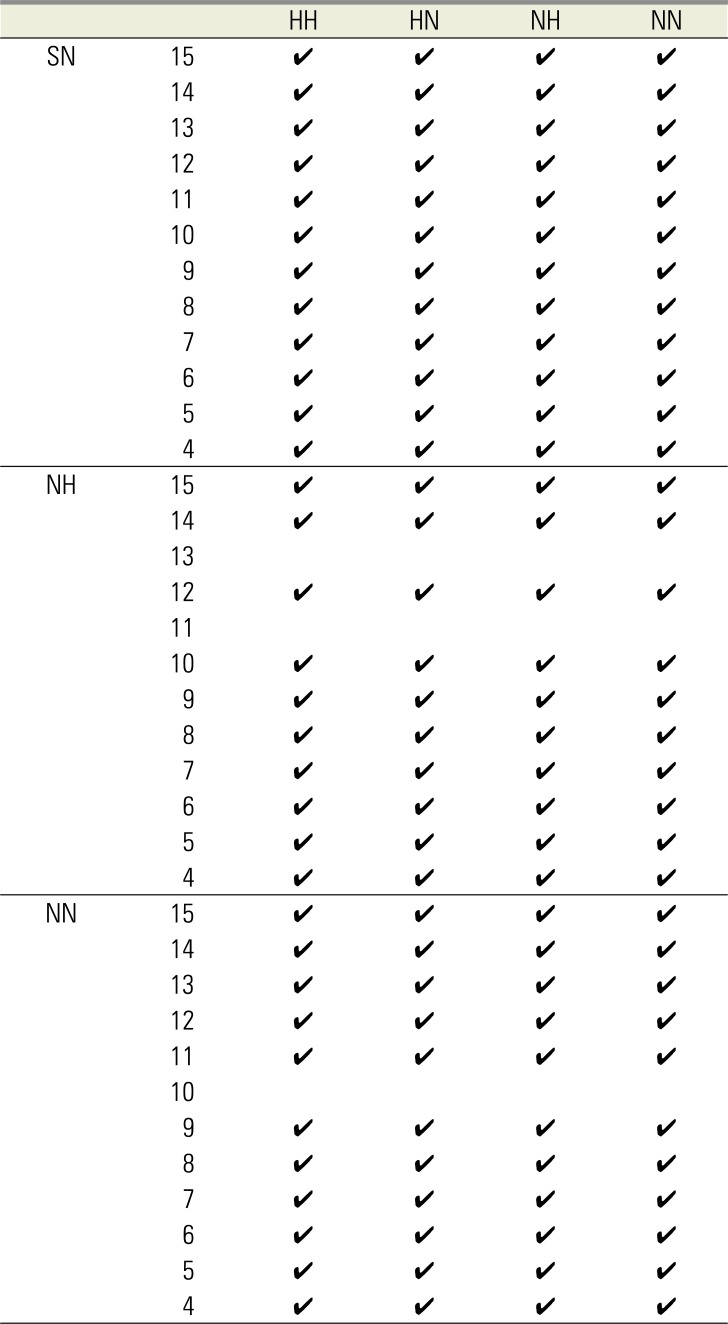
Table 4 presents the judgments regarding whether each regression expression meets the US proportion and all conditions when applied to all groups. In the SN group, for the case in which the regression expression when reducing the questionnaires to 10 items was applied to the NN group, the US proportion was 51.31% and the judgment was Not Applicable (NA). For the case in which the number of questionnaires was reduced one by one from 15 to 4 items in all groups, only the SN, NH, and NN groups had a regression expression meeting the conditions, while no other groups met the conditions. The SH group, TH group, TN group, HH group, and HN group were all deemed NA.
Table 5 presents the judgments of all conditions for the SN, NH, and NN groups. The regression expression that best met the conditions of patients with a high degree of anxiety before dental surgery under local anesthesia was the one obtained from the SN group.
Table 3 presents the coefficient, intercept, and R
2 of the SN group. The regression expression for this group was determined to be most suitable for patients with a high degree of anxiety, particularly before dental surgery under local anesthesia. For example, the anxiety level can be judged with a contribution rate of 86% by the following four questions: ② I feel secure; ⑩ I feel comfortable; ⑮ I am relaxed; and ⑰ I am worried (
Tables 1,
3).
DISCUSSION
Mental stress such as anxiety and fear at the time of oral and maxillofacial surgery affects breathing, easily changes the circulatory dynamics [
111213], and can be a trigger for serious complications. In addition, Okawa et al. reported that patients with greater anxiety in the treatment environment feel more pain; thus, it is important to reduce anxiety in order to alleviate pain during treatment [
14].
To perform safe and comfortable oral and maxillofacial surgery, it is necessary to evaluate a patient's level of anxiety before the operation and to consider appropriate management strategies, such as psychosedation.
The STAI has been reported to be useful for evaluating anxiety and fear in patients before surgery [
21516]. The STAI is a psychological test that was created based on the “anxiety of the trait and state model” by Spielberger et al [
3]. The STAI-X has been standardized in Japan based on results obtained from 1,234 respondents. Since this study data was obtained from 1,252 respondents, the number of patients was considered sufficient—in terms of statistical power—to investigate the actual state of anxiety before dental surgery under local anesthesia.
The STAI-X was conducted at the time of the patient's first visit. It is possible that a patient's anxiety level may change immediately before surgery; thus, it is necessary to consider the influence of the timing of STAI implementation on patient psychology. The STAI-X aims to quantify the extent to which the patient feels uneasy and to identify patients with a high degree of anxiety. It is thought that a unified degree of anxiety can be determined by administering the test without the patient being informed of the results at the time of the first visit or at the time of treatment. In addition, we examined cases in which the STAI-X was conducted again immediately before surgery in patients for whom psychosedation was planned based on the STAI-X results that were obtained at the first visit. We found that the anxiety stage immediately before the operation decreased in comparison with that at the time of the first visit [
17]. This may be due to the establishment of trust between the operator and the patient, as well as the peace of mind obtained by knowing that psychosedation will be administered.
Moreover, if the anxiety of patients is evaluated upon sufficient explanation regarding the disease and surgery, it is believed that anxiety could be reduced in the event of surgery under local anesthesia, whereas anxiety could increase in the event of oral cancer resection conducted under general anesthesia [
1819]. By determining the degree of anxiety at the initial visit, it becomes clear how much anxiety each patient basically has, thereby conceivably allowing us to extract patients with a high degree of anxiety. Based on these observations, it is considered appropriate for the patient to complete the STAI-X at the time of his or her first visit.
Multiple regression analyses are used to analyze data with multiple variables. The methods for selecting explanatory variables for a multiple regression analysis include—but are not limited to—step-up methods, step-down methods, step-wise methods (SWM), BFM, and others. SWM, in which variables are selected mechanically, is the most commonly used method; however, the accuracy of the results can be affected by the fact that some variables may not be entered into the model. We therefore used the BFM for our analysis.
A total of 40 items were included in the analysis; this was the number of question items on the STAI-X (20 trait anxiety questions and 20 state anxiety questions). Some patients, particularly elderly patients, had difficulty filling in the form. Furthermore, surveys with large numbers of questions require a long time to complete; thus, the patient's willingness to answer the questions decreases, and the accuracy of their later answers may decrease. If we can reduce the number of questions by focusing on those that are relevant to the time before dental surgery, it will be possible to assess the anxiety levels of patients more easily. In the present study, the trait anxiety levels of 54.07% of the patients were graded at stages ≥ IV, whereas the state anxiety levels of 66.53% of the patients were graded at stages ≥ IV. The results clearly indicated that state anxiety tends to be high before dental surgery. In this study, we examined the extent to which the question items can be reduced while still reliably predicting anxiety before dental surgery under local anesthesia using the state anxiety section of the STAI-X. Mistakenly identifying patients with high anxiety as those with low anxiety prevents sufficient preoperative preparation and leads to more clinical problems than mistakenly identifying patients with low anxiety as those with high anxiety. For the purpose of ensuring safety during the perioperative period, we set and examined the best conceivable conditions and found that the regression expression obtained from the SN group best met the conditions.
Preoperative anxiety is believed to be correctly determined by asking only the required question items of R
2 for reference in
Table 4 and comparing the score obtained by substituting the answers into the regression expression using the coefficient and intercept, in the evaluation stage criteria of the STAI-X (
Fig. 1).
In conclusion, we examined reducing the questionnaire items on the STAI-X to better extract patients with a high degree of anxiety, particularly before dental surgery under local anesthesia. The best method was shown to be use of the regression expression obtained from patients for whom state anxiety was normal, regardless of the stage of trait anxiety.
Fig. 1
Evaluation-stage criteria for the STAI-X. STAI-X, State-Trait Anxiety Inventory-form X.
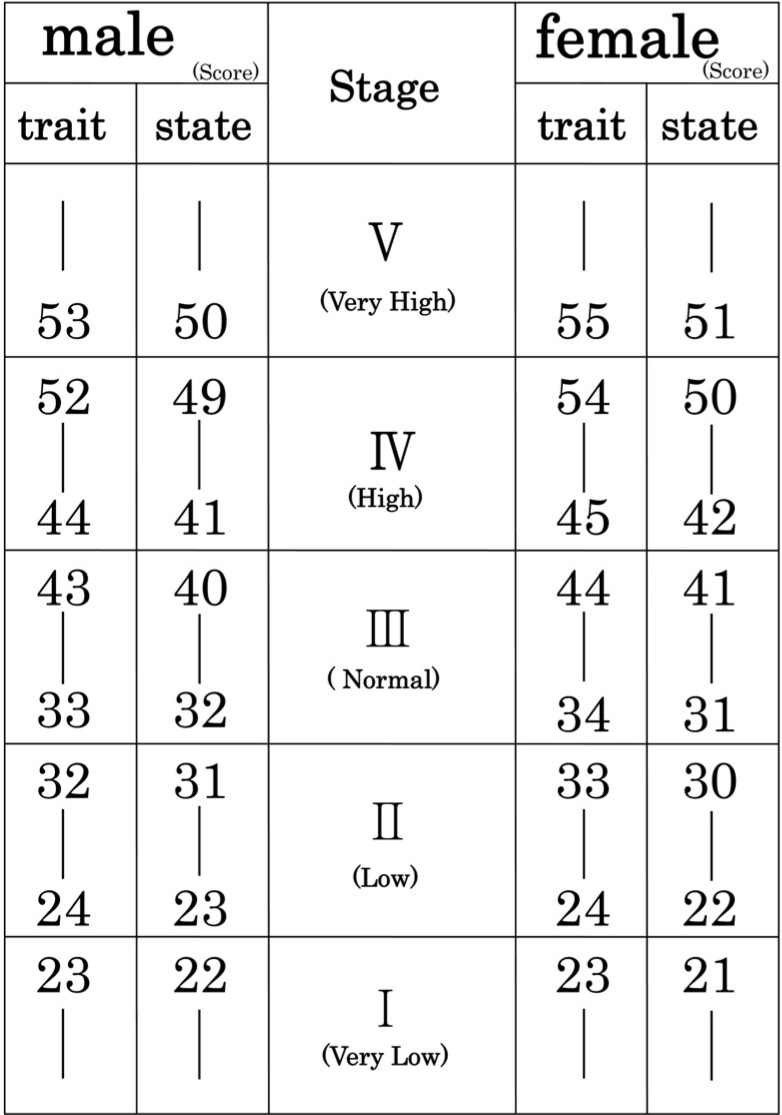
Fig. 2
Evaluation-stage criteria for the STAI-X.
STAI-X, State-Trait Anxiety Inventory-form X.
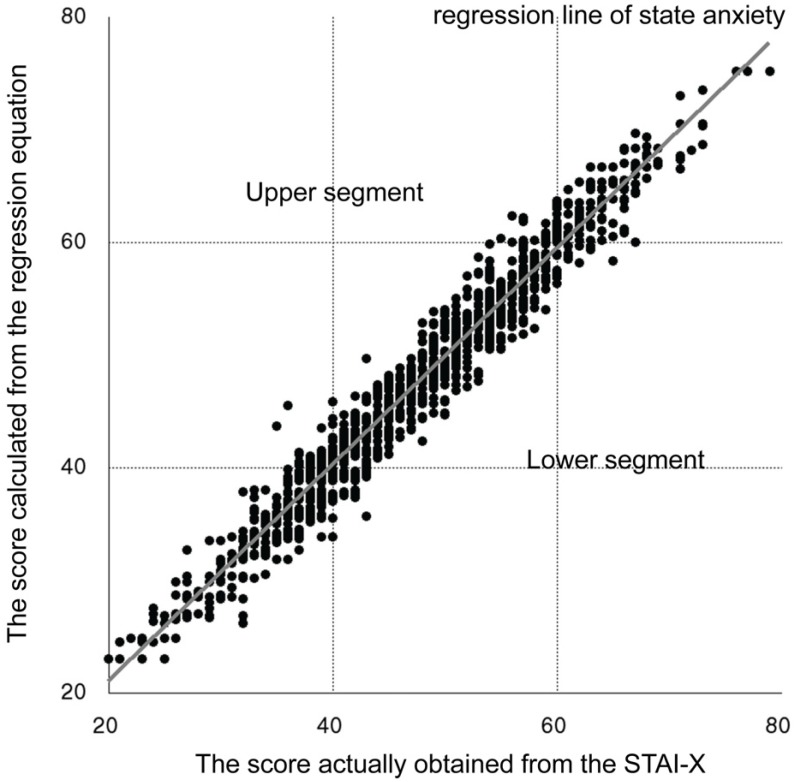
Table 1
Stait anxiety question items
|
Self-evaluation questionnaire |
STAI |
|
1 |
2 |
3 |
4 |
|
① I feel calm |
|
|
|
|
|
② I feel secure |
|
|
|
|
|
③ I am tence |
|
|
|
|
|
④ I feel strained |
|
|
|
|
|
⑤ I feel at ease |
|
|
|
|
|
⑥ I feel upset |
|
|
|
|
|
⑦ I am presently worrying over possible misfortunes |
|
|
|
|
|
⑧ I feel satisfied |
|
|
|
|
|
⑨ I feel frightened |
|
|
|
|
|
⑩ I feel comfortable |
|
|
|
|
|
⑪ I feel self-confident |
|
|
|
|
|
⑫ I feel nervous |
|
|
|
|
|
⑬ I am jittery |
|
|
|
|
|
⑭ I feel indecisive |
|
|
|
|
|
⑮ I am relaxed |
|
|
|
|
|
⑯ I feel content |
|
|
|
|
|
⑰ I am worried |
|
|
|
|
|
⑱ I feel confused |
|
|
|
|
|
⑲ I feel steady |
|
|
|
|
|
⑳ I feel pleasant |
|
|
|
|
Table 2
Group background
|
age (years) group |
< 20 |
20–29 |
30–39 |
40–49 |
50–59 |
60–69 |
70–79 |
80 < |
Total (M/F) |
|
AL |
136 (48/88) |
600 (221/379) |
211 (67/144) |
105 (29/76) |
69 (29/40) |
73 (18/55) |
38 (14/24) |
20 (6/14) |
1252 (432/820) |
|
SH |
85 (27/58) |
396 (133/263) |
133 (36/97) |
75 (19/56) |
50 (21/29) |
54 (12/42) |
27 (9/18) |
13 (1/12) |
833 (258/575) |
|
SN |
51 (21/30) |
204 (88/116) |
78 (31/47) |
30 (10/20) |
19 (8/11) |
19 (6/13) |
11 (5/6) |
7 (5/2) |
419 (174/245) |
|
TH |
83 (28/55) |
341 (127/214) |
99 30/69) |
53 (16/37) |
37 (15/22) |
37 (9/28) |
16 (6/10) |
11 (3/8) |
677 (234/443) |
|
TN |
53 (20/33) |
259 (94/165) |
112 (37/75) |
52 (13/39) |
32 (14/18) |
36 (9/27) |
22 (8/14) |
9 (3/6) |
575 (198/377) |
|
HH |
67 (23/44) |
278 (101/177) |
86 (24/62) |
47 (14/33) |
31 (12/19) |
37 (9/28) |
14 (5/9) |
8 (1/7) |
568 (189/379) |
|
HN |
18 (4/14) |
118 (32/86) |
47 (12/35) |
28 (5/23) |
19 (9/10) |
17 (3/14) |
13 (4/9) |
5 (0/5) |
265 (69/196) |
|
NH |
16 (5/11) |
63 (26/37) |
13 (6/7) |
6 (2/4) |
6 (3/3) |
0 (0/0) |
2 (1/1) |
3 (2/1) |
109 (45/64) |
|
NN |
35 (16/19) |
141 (62/79) |
65 (25/40) |
24 (8/16) |
13 (5/8) |
19 (6/13) |
9 (4/5) |
4 (3/1) |
310 (129/1z81) |
Table 3
The coefficient, intercept, and determination coefficient of the SN group

|
① |
② |
③ |
④ |
⑤ |
⑥ |
⑦ |
⑧ |
⑨ |
⑩ |
⑪ |
⑫ |
⑬ |
⑭ |
⑮ |
⑯ |
⑰ |
⑱ |
⑲ |
⑳ |
int. |
R2
|
|
15
|
1.52 |
|
1.11 |
1.29 |
1.23 |
|
1.29 |
1.41 |
1.17 |
1.05 |
1.06 |
1.34 |
|
1.45 |
|
1.37 |
0.92 |
|
1.00 |
1.18 |
1.43 |
0.99 |
|
14
|
1.43 |
|
1.11 |
1.37 |
1.29 |
|
1.49 |
1.47 |
1.55 |
|
1.14 |
1.44 |
|
1.29 |
1.02 |
1.42 |
|
|
1.07 |
1.26 |
1.51 |
0.98 |
|
13
|
1.50 |
|
1.22 |
1.33 |
1.43 |
|
1.47 |
1.65 |
1.55 |
|
1.20 |
1.48 |
|
1.44 |
|
1.74 |
|
|
1.14 |
1.35 |
1.36 |
0.98 |
|
12
|
1.48 |
|
1.27 |
1.30 |
1.42 |
|
1.48 |
1.72 |
1.62 |
|
1.22 |
1.48 |
|
1.38 |
|
2.03 |
|
|
|
1.71 |
2.97 |
0.97 |
|
11
|
1.40 |
|
1.16 |
1.56 |
1.49 |
|
1.64 |
1.70 |
1.73 |
|
|
1.63 |
|
|
1.34 |
1.82 |
|
|
|
1.94 |
4.13 |
0.97 |
|
10
|
1.48 |
|
1.32 |
1.54 |
1.70 |
|
1.63 |
1.96 |
1.75 |
|
|
1.72 |
|
|
|
2.27 |
|
|
|
2.11 |
4.15 |
0.96 |
|
9
|
1.50 |
|
1.42 |
|
1.71 |
|
1.81 |
1.96 |
1.92 |
|
|
1.95 |
|
|
|
2.19 |
|
|
|
2.16 |
5.01 |
0.95 |
|
8
|
|
2.70 |
|
1.92 |
|
|
1.68 |
|
|
2.21 |
|
|
|
1.88 |
2.39 |
|
2.09 |
|
|
1.93 |
5.91 |
0.94 |
|
7
|
|
2.78 |
|
|
|
|
1.84 |
|
|
2.20 |
|
|
2.84 |
|
2.70 |
|
2.27 |
|
|
1.89 |
6.16 |
0.93 |
|
6
|
|
2.94 |
|
|
|
|
|
|
|
2.30 |
|
|
3.39 |
|
2.71 |
|
2.82 |
|
|
1.95 |
6.41 |
0.91 |
|
5
|
|
3.17 |
|
|
|
|
|
|
|
3.05 |
|
|
3.60 |
|
3.22 |
|
2.86 |
|
|
|
7.61 |
0.89 |
|
4
|
|
3.22 |
|
|
|
|
|
|
|
3.24 |
|
|
|
|
3.36 |
|
3.39 |
|
|
|
10.14 |
0.86 |
Table 4
The US proportion when applied to 3 groups
|
Group |
|
AL |
SH |
SN |
TH |
TN |
HH |
HN |
NH |
NN |
Judgment |
|
SN |
15 |
64.54 |
75.63 |
42.48 |
72.97 |
54.61 |
77.82 |
70.94 |
47.71 |
40.65 |
A |
|
14 |
68.45 |
79.59 |
46.30 |
77.70 |
57.57 |
81.69 |
75.09 |
56.88 |
42.58 |
A |
|
13 |
72.05 |
84.03 |
48.21 |
82.87 |
59.30 |
87.68 |
76.23 |
57.80 |
44.84 |
A |
|
12 |
71.97 |
84.39 |
47.26 |
84.34 |
57.39 |
89.44 |
73.59 |
57.80 |
43.55 |
A |
|
11 |
73.24 |
85.47 |
48.93 |
84.05 |
60.52 |
89.61 |
76.60 |
55.05 |
46.77 |
A |
|
10 |
75.08 |
87.88 |
49.64 |
85.38 |
62.96 |
90.85 |
81.51 |
56.88 |
47.10 |
A |
|
9 |
76.44 |
89.80 |
49.88 |
87.00 |
64.00 |
92.25 |
84.53 |
59.63 |
46.45 |
A |
|
8 |
78.36 |
93.52 |
48.21 |
89.81 |
64.87 |
95.07 |
90.19 |
62.39 |
43.23 |
A |
|
7 |
79.31 |
94.00 |
50.12 |
89.66 |
67.13 |
94.72 |
92.45 |
63.30 |
45.48 |
A |
|
6 |
79.07 |
95.56 |
46.30 |
90.25 |
65.91 |
95.60 |
95.47 |
62.39 |
40.65 |
A |
|
5 |
80.67 |
96.04 |
50.12 |
91.58 |
67.83 |
96.48 |
95.09 |
66.06 |
44.52 |
A |
|
4 |
81.71 |
97.84 |
49.64 |
93.35 |
68.00 |
98.59 |
96.23 |
66.06 |
43.87 |
A |
|
NH |
15 |
70.29 |
81.51 |
47.97 |
77.25 |
62.09 |
82.39 |
79.62 |
50.46 |
47.10 |
A |
|
14 |
69.09 |
79.83 |
47.73 |
76.22 |
60.70 |
81.16 |
76.98 |
50.46 |
46.77 |
A |
|
13 |
74.04 |
89.32 |
43.68 |
82.42 |
64.17 |
89.09 |
89.81 |
47.71 |
42.26 |
NA |
|
12 |
66.61 |
79.35 |
41.29 |
76.66 |
54.78 |
82.22 |
73.21 |
47.71 |
39.03 |
A |
|
11 |
75.56 |
92.20 |
42.48 |
84.93 |
64.52 |
91.90 |
92.83 |
48.62 |
40.32 |
NA |
|
10 |
68.77 |
83.43 |
39.62 |
81.24 |
54.09 |
86.97 |
75.85 |
51.38 |
35.48 |
A |
|
9 |
76.36 |
90.64 |
47.97 |
84.64 |
66.61 |
90.67 |
90.57 |
53.21 |
46.13 |
A |
|
8 |
77.72 |
96.28 |
40.81 |
89.81 |
63.48 |
96.83 |
95.09 |
53.21 |
36.45 |
A |
|
7 |
77.72 |
96.40 |
40.57 |
89.66 |
63.65 |
96.83 |
95.47 |
52.29 |
36.45 |
A |
|
6 |
78.28 |
96.04 |
42.96 |
89.07 |
65.57 |
96.66 |
94.72 |
49.54 |
40.65 |
A |
|
5 |
76.36 |
96.88 |
35.56 |
89.22 |
61.22 |
97.54 |
95.47 |
45.87 |
31.94 |
A |
|
4 |
77.48 |
98.56 |
35.56 |
90.69 |
61.91 |
98.77 |
98.11 |
48.62 |
30.97 |
A |
|
NN |
15 |
69.49 |
80.55 |
47.49 |
79.03 |
58.26 |
82.92 |
75.47 |
58.72 |
43.55 |
A |
|
14 |
71.97 |
82.83 |
50.36 |
81.24 |
61.04 |
84.68 |
78.87 |
63.30 |
45.81 |
A |
|
13 |
72.52 |
84.51 |
48.69 |
82.87 |
60.35 |
87.68 |
77.74 |
57.80 |
45.48 |
A |
|
12 |
72.92 |
84.87 |
49.17 |
82.13 |
62.09 |
86.62 |
81.13 |
58.72 |
45.81 |
A |
|
11 |
76.76 |
89.80 |
50.84 |
87.74 |
63.83 |
92.25 |
84.53 |
64.22 |
46.13 |
A |
|
10 |
77.32 |
90.40 |
51.31 |
84.64 |
68.70 |
89.97 |
91.32 |
56.88 |
49.36 |
NA |
|
9 |
78.67 |
92.20 |
51.79 |
89.07 |
66.44 |
94.54 |
87.17 |
60.55 |
48.71 |
A |
|
8 |
79.71 |
92.92 |
53.46 |
90.84 |
66.61 |
95.07 |
88.30 |
68.81 |
48.07 |
A |
|
7 |
80.67 |
94.00 |
54.18 |
91.29 |
68.17 |
95.78 |
90.19 |
67.89 |
49.36 |
A |
|
6 |
81.63 |
96.16 |
52.75 |
92.17 |
69.22 |
96.66 |
95.09 |
68.81 |
47.10 |
A |
|
5 |
82.35 |
96.04 |
55.13 |
92.02 |
70.96 |
96.48 |
95.09 |
68.81 |
50.32 |
A |
|
4 |
83.95 |
97.96 |
56.09 |
93.80 |
72.35 |
98.42 |
96.98 |
69.73 |
51.29 |
A |
Table 5
The judgment results of all conditions for the SN, NH, and NN groups
|
|
HH |
HN |
NH |
NN |
|
SN |
15 |
✔ |
✔ |
✔ |
✔ |
|
14 |
✔ |
✔ |
✔ |
✔ |
|
13 |
✔ |
✔ |
✔ |
✔ |
|
12 |
✔ |
✔ |
✔ |
✔ |
|
11 |
✔ |
✔ |
✔ |
✔ |
|
10 |
✔ |
✔ |
✔ |
✔ |
|
9 |
✔ |
✔ |
✔ |
✔ |
|
8 |
✔ |
✔ |
✔ |
✔ |
|
7 |
✔ |
✔ |
✔ |
✔ |
|
6 |
✔ |
✔ |
✔ |
✔ |
|
5 |
✔ |
✔ |
✔ |
✔ |
|
4 |
✔ |
✔ |
✔ |
✔ |
|
NH |
15 |
✔ |
✔ |
✔ |
✔ |
|
14 |
✔ |
✔ |
✔ |
✔ |
|
13 |
|
|
|
|
|
12 |
✔ |
✔ |
✔ |
✔ |
|
11 |
|
|
|
|
|
10 |
✔ |
✔ |
✔ |
✔ |
|
9 |
✔ |
✔ |
✔ |
✔ |
|
8 |
✔ |
✔ |
✔ |
✔ |
|
7 |
✔ |
✔ |
✔ |
✔ |
|
6 |
✔ |
✔ |
✔ |
✔ |
|
5 |
✔ |
✔ |
✔ |
✔ |
|
4 |
✔ |
✔ |
✔ |
✔ |
|
NN |
15 |
✔ |
✔ |
✔ |
✔ |
|
14 |
✔ |
✔ |
✔ |
✔ |
|
13 |
✔ |
✔ |
✔ |
✔ |
|
12 |
✔ |
✔ |
✔ |
✔ |
|
11 |
✔ |
✔ |
✔ |
✔ |
|
10 |
|
|
|
|
|
9 |
✔ |
✔ |
✔ |
✔ |
|
8 |
✔ |
✔ |
✔ |
✔ |
|
7 |
✔ |
✔ |
✔ |
✔ |
|
6 |
✔ |
✔ |
✔ |
✔ |
|
5 |
✔ |
✔ |
✔ |
✔ |
|
4 |
✔ |
✔ |
✔ |
✔ |


 PDF
PDF ePub
ePub Citation
 Print
Print


 XML Download