

 PDF
PDF ePub
ePub Citation
 Print
Print


INTRODUCTION
Water intake is essential for life. While fluid intake can be attained from a variety of beverages and foods, plain water (i.e., water without caloric sweeteners) is a calorie-free option for hydration [1]. Drinking water can prevent dehydration, which can affect constipation, kidney stones, and poor cognition, mood, and body heat regulation [23]. Drinking plain water can also help with managing body weight and reducing caloric intake when substituted for sugar-sweetened beverages (SSBs) [456].
To promote plain water intake, free, safe drinking water should be more readily accessible to individuals in homes and public facilities such as parks, playgrounds, schools, public buildings, and worksites. For example, a previous study reported that students in California who had access to free drinking water consumed significantly more water than students who had limited access to free drinking water [7]. Research suggests there is a substantial need for expansion of free drinking water access in public spaces. A 2009 study of US adults who use parks and playgrounds found that only about half of respondents reported having access to water fountains [8]. A study of beverages sold on Boston city property reported that beverages were commonly SSBs (40.5%) in public libraries, community centers, administrative buildings, and parks and recreational facilities prior to issuance of the Healthy Beverage Executive Order [9]. Though access to water fountains in publicly accessible places may be limited in places in the US [8], research has found high public support for free public drinking water access. A study reported that 89% of Americans aged 17 and older supported required access to water in parks [10].
Currently, there is limited information on local policies for providing access to free drinking water in publicly accessible places, public facilities, and parks. Local policies that can impact plain water availability in these settings include general or comprehensive communitywide planning documents developed by local governments to set long-term community development goals [11]; community plans on specific issues such as parks and recreation plans and bicycle or pedestrian plans; local plumbing codes that adopt standards for drinking fountains in publicly accessible places like hospitals and shopping centers; zoning/development incentives and budget provisions to establish and maintain drinking water access on public property. The present study explored such local policies and examined associations between water access policies and municipal-level characteristics using a nationally representative survey of municipalities with population size ≥ 1,000.
MATERIALS AND METHODS
Survey administration
This cross-sectional study used data from the National Survey of Community-Based Policy and Environmental Supports for Healthy Eating and Active Living conducted by the Division of Nutrition, Physical Activity and Obesity at the Centers for Disease Control and Prevention [12]. The Community-Based Policy and Environmental Supports for Healthy Eating and Active Living was an online survey with the option of completing a paper-based version. The survey had 3 modules of questions: 1) Communitywide Planning Efforts for Healthy Eating and Active Living, 2) Built Environment and Policies that Support Physical Activity, and 3) Policies and Practices that Support Access to Healthy Food and Healthy Eating. All questions underwent cognitive testing with a panel of potential respondents and most questions were included on a pilot test in 2 states [12].
Study sample
The Community-Based Policy and Environmental Supports for Healthy Eating and Active Living survey sampled 4,484 municipalities from a sample frame of 10,205 municipalities with population size ≥ 1,000 stratified by region, urban status, and population size to generate a nationally representative sample from all 50 states between May 2014 and September 2014. The response rate was 45% (n = 2,029 municipalities). The potential respondents were identified from the most current Census of Governments that lists municipalities and townships by state [13]. When there was geographic overlap between municipal and township levels of government, the qualified sample pool was changed to avoid duplications. Very small municipalities (population size < 1,000) were excluded from the pool, based on a previous pilot test that showed municipalities of this size had few policies in place [12]. Survey respondents were the city or town manager, planner, or individual with comparable duties, and respondents were encouraged to get support from other municipal officials such as tax office or procurement department representatives, parks and recreation department representatives, or human resources representatives to complete the survey if needed. The data collection was deemed exempt from institutional review because this study did not constitute human subjects research.
Measures
Outcome variables were 4 local policy provisions regarding drinking water access in outdoor and indoor publicly accessible places. Questions were developed based upon previous research on plumbing codes [14], and policies to support drinking water access in planning documents and municipal codes conducted by the American Planning Association [15].
Existence of local policies were captured through the 4 following survey questions, and response options for each question were yes, no, or do not know.
1) Communitywide plans that address free drinking water in parks: Those who reported having communitywide planning documents were asked:
“Does your local government have ‘Providing free drinking water in outdoor publicly accessible places such as parks’ included in the plan(s)? This objective should be written in the plan. However, they do not have to have been implemented yet.”
2) Other local policies or budget provisions for free drinking water in parks:
“Does your local government have policies or budget provisions for… ‘Provision of free drinking water in parks or outdoor recreation areas?’”
3) Development incentives for outdoor drinking fountains:
“Does your local government include any of the following features in policies for development, including zoning codes and design/development guidelines: require or provide incentives for placing drinking fountains or other dispensers in outdoor publicly accessible places?”
4) Local plumbing codes:
Does your municipality “Have a municipal plumbing or building code that contains a different drinking fountain requirement than the drinking fountain requirements contained in the statewide plumbing code?”
Of note, municipal zoning codes and development standards can specify outdoor amenity options, such as drinking fountains, that developers can choose from to fulfill code requirements, or provide incentives like a greater lot build-out or density bonus for installing public amenities [15]. Additionally, municipalities typically have the authority to require a greater number of fountains than state level plumbing or building codes.
Explanatory variables were municipal-level characteristics. Population size of each municipality was based on information from the US Census Bureau 2007 Census of Governments [13] and categorized as 1,000–2,499, 2,500–49,999, and ≥ 50,000 persons. Rural/urban status was established using the ratio of urbanized area to total area in a municipality derived from 2012 US Census Summary File One data [16]. Geographical region was categorized into 4 census regions (Northeast, Midwest, South, and West). The percent of municipal residents below the poverty line was derived from 2009–2013 American Community Survey 5-Year Estimates and categorized as < 20% or ≥ 20% based upon the prevalence cut-point used in the definition of persistent poverty by the US Department of Agriculture [17]. Median educational attainment was categorized as ≤ high school graduate or ≥ some college. Racial/ethnic composition was derived from the 2009–2013 American Community Survey 5-Year Estimates and categorized as ≥ 90%, 51%–89%, and ≤ 50% non-Hispanic white.
Statistical analysis
Descriptive statistics were used to describe municipality characteristics of the analytic sample. Unknown values or missing data for outcome or exposure variables were excluded from analyses when the variable was used. The prevalence and 95% confidence intervals (CIs) of the 4 water policies overall and according to municipality characteristics were calculated and differences in prevalence according to characteristics were assessed using χ2 tests with p values < 0.05 considered significant. We conducted multivariable logistic regression to assess the independent association of each policy with municipality characteristics. A separate model was fit with each policy as the dependent variable and all municipality characteristics as the independent variables. Associations were considered significant if the CI of each odds ratio (OR) did not include one. Of note, missing data of outcome variables (i.e., 4 water-related policies) ranged from 9% to 23% and there were significant differences between municipalities with missing data on any of 4 water-related policies and municipalities without any missing data on water-related policies for population size and racial/ethnic composition, but not for rural/urban status, census region, poverty prevalence, and education. Municipalities with missing data on water-related policies were more likely to have larger population size (≥ 50,000 persons) and lower proportion (≤ 50%) of non-Hispanic white. All analyses were conducted using SAS survey procedures (SAS Institute Inc., Cary, NC, USA) to account for study weights and survey design variables.
RESULTS
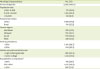
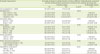
Of the municipalities that responded to the survey, 74.8% were classified as urban, 58.3% of municipalities had a population of 2,500–49,000 persons, and 36.0% were in the South region. About 70% had poverty prevalence of < 20%, and 55.6% of municipalities had median educational attainment as some college or higher. About half of municipalities (49.9%) were 51%–89% non-Hispanic white (Table 1).
Table 1
Characteristics of US municipalities with population size ≥ 1,000 persons, National Survey of Community-Based Policy and Environmental Supports for Healthy Eating and Active Living, 2014
Overall, 56.3% of municipalities had written plans for providing free drinking water in outdoor publicly accessible places such as parks. Based on the multivariable analyses, the odds of having written plans for providing free drinking water in outdoor public places were higher in municipalities with population size of 2,500–49,999 persons (adjusted OR, 1.75; 95% CI, 1.31–2.34) or those with population size of ≥ 50,000 persons (adjusted OR, 2.52; 95% CI, 1.51–4.22) compared with those with 1,000–2,499 persons. In contrast, the odds of having written plans for providing free drinking water in outdoor places were lower in municipalities located in the Northeast (adjusted OR, 0.41; 95% CI, 0.30–0.57) and the South (adjusted OR, 0.71; 95% CI, 0.55–0.92) regions compared with the Midwest and also lower in municipalities with ≤ 50% of the population being non-Hispanic white (adjusted OR, 0.68; 95% CI, 0.47–0.97; vs. ≥ 90% non-Hispanic white) (Table 2).
Table 2
Written community-wide plans for providing free drinking water in outdoor publicly accessible places such as parks by municipality characteristics, National Survey of Community-Based Policy and Environmental Supports for Healthy Eating and Active Living, 2014
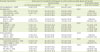
Data shown are percentage (95% CI) not otherwise specified.
OR, odds ratio; CI, confidence interval.
*All municipal characteristics were included in the model, which are presented adjusted OR (95% CI); †Weighted percentage are presented. Because of rounding, weighted percentage may not add up to 100%; ‡χ2 test was used for each variable to examine differences across categories, and p value < 0.05 was considered statistically significant; §Unweighted sample size are presented; ∥The criteria of this values are non-Hispanic white.
Overall 59.2% of municipalities had other policies or budget provisions for free drinking water in parks/outdoor recreation areas. Based on the multivariable analyses, the odds of having policies or budget provisions for free drinking water in parks/outdoor recreation areas were higher in municipalities with population size of 2,500–49,999 persons (adjusted OR, 1.80; 95% CI, 1.34–2.40) or those with population size of ≥ 50,000 persons (adjusted OR, 4.17; 95% CI, 2.38–7.29) compared with those with 1,000–2,499 persons. In contrast, the odds of having this policy or provision were lower in municipalities located in the Northeast (adjusted OR, 0.48; 95% CI, 0.35–0.67) and the South (adjusted OR, 0.66; 95% CI, 0.51–0.85) regions compared with the Midwest (Table 3).
Table 3
Policies or budget provisions for free drinking water in parks or outdoor recreation areas by municipality characteristics, National Survey of Community-Based Policy and Environmental Supports for Healthy Eating and Active Living, 2014
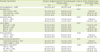
Data shown are percentage (95% CI) not otherwise specified.
OR, odds ratio; CI, confidence interval.
*All municipal characteristics were included in the model, which are presented adjusted OR (95% CI); †Weighted percentage are presented. Because of rounding, weighted percentage may not add up to 100%; ‡χ2 test was used for each variable to examine differences across categories, and p value < 0.05 was considered statistically significant; §Unweighted sample size are presented; ∥The criteria of this values are non-Hispanic white.
Only 9.3% of municipalities reported requiring or providing development incentives for placing drinking fountains or other dispensers in outdoor publicly accessible places in zoning codes and design/development guidelines. Based on the multivariable analyses, the odds of requiring or providing incentives for placing drinking fountains or other dispensers in outdoor publicly accessible places were higher in municipalities with population size of ≥ 50,000 persons (adjusted OR, 2.26; 95% CI, 1.12–4.59) compared with those with 1,000–2,499 persons (Table 4).
Table 4
Requiring or providing incentives for placing drinking fountains or other dispensers in outdoor publicly accessible places in zoning codes and design/development guidelines by municipality characteristics, National Survey of Community-Based Policy and Environmental Supports for Healthy Eating and Active Living, 2014
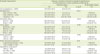
Data shown are percentage (95% CI) not otherwise specified.
OR, odds ratio; CI, confidence interval.
*All municipal characteristics were included in the model, which are presented adjusted OR (95% CI); †Weighted percentage are presented. Because of rounding, weighted percentage may not add up to 100%; ‡χ2 test was used for each variable to examine differences across categories, and p value < 0.05 was considered statistically significant; §Unweighted sample size are presented; ∥The criteria of this values are non-Hispanic white.
Overall 7.7% of municipalities reported having a municipal plumbing or building code that contains a different drinking fountain requirement than the drinking fountain requirements contained in the statewide plumbing code. Based on the multivariable analyses, the odds of having a municipal plumbing or building code that contains a different drinking fountain requirement than the drinking fountain requirements contained in the statewide plumbing code were higher in municipalities with 51%–89% non-Hispanic white (adjusted OR, 2.26; 95% CI, 1.32–3.85) and those with ≤ 50% non-Hispanic white (adjusted OR, 3.78; 95% CI, 1.87–7.64) (Table 5).
Table 5
Municipal plumbing or building code that contains a different drinking fountain requirement than the drinking fountain requirements contained in the statewide plumbing code by municipality characteristics, National Survey of Community-Based Policy and Environmental Supports for Healthy Eating and Active Living, 2014
Data shown are percentage (95% CI) not otherwise specified.
OR, odds ratio; CI, confidence interval.
*All municipal characteristics were included in the model, which are presented adjusted OR (95% CI); †Weighted percentage are presented. Because of rounding, weighted percentage may not add up to 100%; ‡χ2 test was used for each variable to examine differences across categories, and p value < 0.05 was considered statistically significant; §Unweighted sample size are presented; ∥The criteria of this values are non-Hispanic white.
DISCUSSION
We found that more than half of municipalities reported having written plans for providing free drinking water in outdoor places such as parks or having policies or budget provisions for free drinking water in parks or outdoor recreation areas. Fewer than 1 in 10 municipalities required or provided development incentives in zoning and design/development codes to place drinking fountains or other dispensers in outdoor publicly accessible places. Few municipalities had a municipal plumbing or building code that contained a different drinking fountain requirement than the drinking fountain requirements contained in the statewide plumbing code.
Different water-related policies were associated with a number of municipal characteristics. For example, compared to smaller municipalities, municipalities with larger population size were more likely to have: written plans for providing free drinking water in outdoor settings; zoning or development codes that require or provide incentives for placing drinking fountains in outdoor publicly accessible places; or policies or budget provisions for free drinking water in parks or outdoor recreation areas. It may be possible that municipalities with larger population size have more resources to work on innovative health promotion and disease prevention efforts such as increasing access to drinking water, consider water access as higher priority, or have higher consumer demands on ready access to free drinking water outdoors and at public facilities.
We also found regional variations. Compared to municipalities in the Midwest, municipalities in Northeast and the South were less likely to have written plans for providing free drinking water in publicly accessible outdoor places or to have policies or budget provisions for free drinking water in parks or outdoor recreation areas. Although potential reasons for these findings are unclear, access to free drinking water is important in these regions. A previous study reported that adults living in the Northeast and South regions were more likely to consume SSBs at least once per day compared to those living in the Midwest or West [18].
Furthermore, we also found that rural/urban status, poverty prevalence, and median educational attainment were not significantly associated with water-related policies. Although a direct comparison cannot be made, somewhat similar to our findings, Steinman et al. [19] reported that master plans for pedestrian and bicycle transportation were similar regardless of community-level characteristics (e.g., race/ethnicity, household income, and high school education). Our findings are somewhat encouraging because they suggest that there might not be significant disparities in water-related policies by municipal socio-economic characteristics. However, efforts are still needed to address earlier research findings that report lower water intake among low-income adults and those with less education [2021].
Our study represents the first national examination of local policies on access to free drinking water in US municipalities; however, study findings are subject to limitations. First, the survey had a relatively low response rate, which may impact the representativeness of findings. However, sampling weights were applied to account for nonresponse and sampling design. Second, the data were collected at the municipal-level, thus places with no government subdivisions below the county level may not be captured in the survey, because they would not be in the sampling frame. Nonetheless, about 81% of the US population is covered by the municipal government sample design based on the 2010 estimate. Third, the survey responses were based on self-report and were not verified with written municipal policy sources. Fourth, the survey did not capture the substance of policies reported. Prior research into planning document provisions for drinking water found that policies “generally include vague support or promotion of drinking water access through partnerships or other efforts” and lack specific numerical targets [15]. Fifth, certain water-related policy had relatively large missing data and municipalities with missing data on any of 4 water-related policies were more likely to have larger population size. Because larger municipalities were more likely to have water-related policies, our study might underestimate the prevalence of municipalities having water-related policies. Lastly, while the existence of local policies can provide insight into a community's particular priorities, this study does not address implementation of communitywide planning documents, utilization of development incentives or enforcement of local drinking water policies. Communitywide planning documents, in particular, have been criticized for their lack of implementation [22]. Our findings suggest that communities may be more likely to adopt non-binding drinking water policies like communitywide plan provisions, than binding and enforceable policies like local plumbing codes to require more robust drinking water access than that provided for in the statewide code.
CONCLUSION
In conclusion, we found that although more than half of municipalities had written plans for providing free drinking water in outdoor areas or policies/budget provisions of free drinking water in parks or outdoor recreation areas, few municipalities had zoning or development policies that required or incentivized drinking fountains in outdoor public places or had a municipal plumbing/building code with a different drinking fountain requirement than that of the statewide plumbing code. Having water-related policies significantly differed by certain municipal characteristics, such as population size, census region, and racial/ethnic composition. Increasing access to free drinking water is one strategy to reduce consumption of SSBs and improve diet quality. Municipal policies may help to ensure ready access to free drinking water in parks and other publicly accessible places.
 XML Download