

 PDF
PDF ePub
ePub Citation
 Print
Print


INTRODUCTION
Chronic inflammation has been well connected to the incidence of various cancers both in human and in animals for decades [123]. It promotes neoplastic transformation of chronically inflamed tissues by supplying bioactive molecules to the tissues including growth, survival, proangiogenic, invasion, and metastasis factors.
A high protein diet (HPD) provides an increased amount of amino acids to the tissues which can be beneficial for wound healing, immune system, and total body health [45]. On the other hand, however, as the undigested protein entering the large intestine increases, numerous amino acid-derived metabolites including p-cresol, hydrogen sulfide, and ammonia produced by gut microbiota which can exert detrimental effects on the intestinal mucosa [67]. In fact, Lan et al. [8] recently reported that HPD exerts dual effects, being exacerbates colonic inflammation during post-dextran sodium sulfate (DSS) induction phase but helpful in repairing the colonic epithelium in the inflammatory bowel disease mouse model.
The mouse skin and colon models have been extensively used to study the molecular changes implicated in inflammation associated cancer in human. Repetitive application of 12-O-tetradecanoylphorbol-13-acetate (TPA) to mouse skin elicits many diverse physiological changes including epidermal hyperplasia, inflammation, and ornithine decarboxylase expression [910]. In mouse colitis model, administration of DSS (1%–5%) in the drinking water for 5–7 days to the mouse results in pathological features of acute colitis (inflammation) characterized by weight loss, diarrhea and occult blood [1112].
We previously reported that HPD inhibits mouse skin tumorigenesis [13] whereas it exacerbates azoxymethane-induced colon carcinogenesis in mouse [1415]. These contradictory results were derived from two independent experiments in different mouse strain. So far, there are no reports on the effect of HPD in distinct tissues in a mouse cancer model. In human, HPD is recommended for improving immune system and total body condition for cancer patients. However, a possibility of a cancer promoting effect of HPD cannot be ignored. In this study, we therefore evaluated the effect of HPD on TPA or DSS-induced tissue hyperplasia and inflammation markers in mouse skin and colon.
MATERIALS AND METHODS
Animal experiment and diets
ICR mice (5-week-old, female) were purchased from KOATECH Experimental Animal Center (Pyeongtaek, Korea). Mice were housed in individual cages and fed with standard laboratory chow under controlled condition of humidity (50% ± 10%), light (12 hours light/dark cycle), and temperature (23°C ± 2°C) for 1 week before the experiment (Figure 1). Mice were divided into 2 diet groups: normal diet (ND; 20% casein) and HPD (50% casein). Mice were then assigned to 4 groups (n = 5 per group) in each diet group; 1) group 1: ND-acetone; 2) group 2: ND-TPA; 3) group 3: ND-acetone + DSS; 4) group 4: ND-TPA + DSS; 5) group 5: HPD-acetone; 6) group 6: HPD-TPA; 7) group 7: HPD-acetone + DSS; and 8) group 8: HPD-TPA + DSS. Experimental diet based on American Institute of Nutrition (AIN)-76A formula was composed as shown in Table 1. At 6 weeks of age, mice were fed ad libitum either an ND or HPD for 4 weeks. Food intake was recorded daily and body weight was measured once a week.
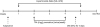 | Figure 1Schematic representation of study design. Five-week-old female ICR mouse were acclimated for 1 week and then randomly grouped to ND (20% casein) and HPD (50% casein) groups. In each diet group, mice were treated with either vehicle (acetone or H2O), TPA, TPA and DSS, or DSS. Experimental diet was fed for total 4 weeks. After 1 week of diet feeding, 6.5 nmol (4 μg) of TPA was topically applied twice a week for 2 weeks on the shaved mouse dorsal skin. DSS in drinking water (2%, wt/v) was administered for 5 days at the final week of the experiment.
ND, normal diet; HPD, high protein diet; TPA, 12-O-tetradecanoylphorbol-13-acetate; DSS, dextran sodium sulfate.
|
Table 1
Composition of experimental diet
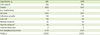
ND, normal diet; HPD, high protein diet; AIN, American Institute of Nutrition.
*Composition of AIN-76A mineral mix (g/kg): calcium phosphate, dibasic 500; sodium chloride 74; potassium citrate, monohydrate 220; potassium sulfate 52; magnesium oxide 24; manganous carbonate (43%–48% Mn) 3.5; ferric citrate (16%–17% Fe) 6; zinc carbonate(70% ZnO) 1.6; cupric carbonate (53%–55% Cu) 0.3; potassium iodate 0.01; sodium selenite 0.01; chromium potassium sulfate 0.55; sucrose, finely powdered 118.03; †Composition of AIN-76A vitamin mix (g/kg): thiamin hydrochloride 0.6; riboflavin 0.6; pyridoxine hydrochloride 0.7; nicotinic acid 3.0; D-calcium pantothenate 1.6; folic acid 0.2; D-biotin 0.02; cyanocobalamine 0.001; cholecalciferol(400,000 IU/g) 0.25; manaquinone 0.005; ascorbic acid 0.2; sucrose, finely powdered 992.824.
![]()
In order to induce skin hyperplasia, at 7 weeks of age, dorsal skin of the mice was shaved 2 days prior to TPA (Alexis Biochemicals, San Diego, CA, USA) treatment. Shaved skin of the mice was topically applied with either acetone or TPA (6.5 nmol [4 µg] of TPA in 200 μL) twice a week for 2 weeks. To induce colonic inflammation, we provided 2% DSS (MP Biomedicals, Irvine, CA, USA) in their drinking water for 5 days at 10 weeks of age and then sacrificed. All animal experimentation was approved by the Animal Care and Use Committee at the Daegu Catholic University (IACUC-2014-042).
Preparation of samples and histological analysis
The entire large intestine and dorsal skin of all mice were sampled. The length and weight of colon were immediately recorded and some parts of tissues were fixed in 10% formalin, embedded in paraffin, and sections were stained with hematoxylin and eosin (H & E) to determine the degree of inflammation. Stained sections were examined using light microscopy. For measuring the rate of epidermal cell proliferation, all animals were i.p. injected with 5-bromo-2′-deoxyuridine (BrdU, 100 mg/kg body weight, Sigma, St. Louis, MO, USA) and were killed 1 hour later. Colon and dorsal skin was isolated from the mice, fixed in 10% formalin. After deparaffinization, 5 μm sections were treated with anti-BrdU antibody (BD Biosciences, San Jose, CA, USA). The number of BrdU-positive cells in the interfollicular epidermis or colonic tissues was counted in five random tissue sections in each mouse. The labeling index of BrdU-labeled cell in the epidermis was calculated from the number of stained BrdU-positive cells per 300 epidermal cells counted from entire 20-mm length of epidermis for each section. The thickness of rectal mucosa and skin interfollicular epidermis was measured with light microscope.
Western analysis
Mouse dorsal skin and the last one third part of large intestine was homogenized in radioimmunoprecipitation assay (RIPA) buffer (0.1% SDS, 1% Triton X-100, 0.5% sodium deoxycholate, 50 mM Tris [pH 7.5], 150 mM sodium chloride, 50 mM sodium fluoride, 1 mM ethylenediaminetetraacetic acid, 1 mM ethylene glycol-bis(β-aminoethyl ether)-N,N,N′,N′-tetraacetic acid, 1 mM dithiothreitol, 1 mM phenylmethylsulfonyl fluoride, 10 µg/mL leupeptin, 10 µg/mL aprotinin). Samples were resolved by SDS-PAGE and transferred to polyvinylidene difluoride membrane. The blot was blocked with 5% non-fat dried milk in 0.1% Tween-20-Tris-buffered saline (TTBS) and probed overnight at 4°C with antibody against cyclooxygenase-2 (COX-2, Cell signaling Technology, Danvers, CO, USA), actin (Santa Cruz Biotechnology, Santa Cruz, CA, USA) at 1:1,000 dilution. We then washed the blot three times with 1% TTBS and then probed with horseradish peroxidase-conjugated secondary antibody (Santa Cruz Biotechnology, Santa Cruz, CA, USA) at 1:1,000 dilution for 1 hour at room temperature. After washing 3 times with 0.1% TTBS, the specific bands were detected by an enhanced chemiluminescence kit (Bio Science Technology, Pohang, Korea).
Measurement of nitric oxide (NO)
Plasma NO concentrations were measured in triplicate according to the manufacturer's instructions, using an NO detection kit (iNtRON Biotechnology, Seongnam, Korea).
Statistical analysis
The data are presented as means ± standard error. All statistical analyses were performed by the SPSS program, version 19 (IBM Corp., Chicago, IL, USA). The data were analyzed by one-way analysis of variance (ANOVA) and differences between experimental groups were evaluated at the p < 0.05 by Duncan's multiple range test.
RESULTS
Food intake and body weight change between ND and HPD fed animals
During 4 weeks of experimental period, mice in HPD group were tended to eat less than mice in ND group (Table 2). However, food intake was not significantly different between ND and HPD groups by treatment. Body weight of mice was slightly less than mice in ND group without statistical significance.
Table 2
Daily food intake and body weight gain

Food intake was recorded daily throughout the experiment and body weight was measure once a week. Body weight gain was calculated by final body weight-initial body weight of each mouse. Values are presented as the mean ± standard error.
NS, not significant; ND, normal diet; HPD, high protein diet; TPA, 12-O-tetradecanoylphorbol-13-acetate; DSS, dextran sodium sulfate.
a,bMeans with different letters within a column are significantly different from each other at p < 0.05 as determined by Duncan's multiple range test. The alphabet a in the table was given to the largest number.
![]()
HPD decreased TPA-induced skin hyperplasia and epidermal cell proliferation
We microscopically examined the structure of the skin using H & E staining method. There was no significant structural difference in skin between ND and HPD groups upon acetone treatment (Figure 2). TPA treatment to mouse dorsal skin caused skin hyperplasia both in ND and HPD groups. The thickness of epidermis after TPA treatment was, however, significantly reduced by 20% in HPD fed animals than that of ND fed mice.
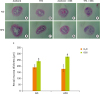
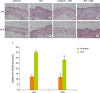 | Figure 2Effect of HPD on mouse epidermal hyperplasia. (A-H) Histological analysis of the skin of ND (upper panel) and HPD fed mice (lower panel) with or without TPA and/or DSS treatment. Tissue sections were stained with H & E and photographed at 100×. (I) Epidermal thickness was measured microscopically. Each value represents the mean ± standard error of the epidermal thickness from 3 random tissue sections in each animal and 3 mice/group.
ND, normal diet; HPD, high protein diet; TPA, 12-O-tetradecanoylphorbol-13-acetate; DSS, dextran sodium sulfate; H & E, hematoxylin and eosin.
Means with different letters are significantly different at p < 0.05 by Duncan's multiple range test. In the graph, alphabets are assigned sequentially starting from a high number to a.
|
To further analyze the proliferation rate of the skin epidermis, we labeled the epidermal cells with BrdU which is the most common method for identifying slow cycling cells. TPA treatment significantly increased BrdU labeling index in ND group (Figure 3). The labeling index between acetone and TPA treated animals was, however, not significantly different in HPD group.
 | Figure 3Effect of HPD on basal cell proliferation in mouse skin. Skin sections were immunostained with an antibody against BrdU and photographed at 200× magnification. Dorsal skins of mice fed (A) ND and treated with acetone, (B) ND and treated with TPA (4 μg of TPA, twice a week for 2 weeks), (C) HPD and treated with acetone, (D) HPD and treated with TPA. (E) The index represents the percentage of BrdU-positive cells relative to the total number of basal cells in the interfollicular epidermis in each experiment group. Each value represents the mean ± standard error of the labeling indices from 5 random tissue sections in each animal and 3 mice/group.
HPD, high protein diet; BrdU, 5-bromo-2′-deoxyuridine; ND, normal diet; TPA, 12-O-tetradecanoylphorbol-13-acetate.
Means with different letters are significantly different at p < 0.05 by Duncan's multiple range test. In the graph, alphabets are assigned sequentially starting from a high number to a.
|
The weight and length of large intestine
We next investigated the effect of HPD on DSS-induced colitis pathophysiologically. It has been reported that the weight of large intestine is increased and the length is shortened in colitis. The weight and length of large intestine was, however, not significantly different between groups in our experiment (Table 3). The large intestine of HPD-DSS group was the shortest and the length of large intestine was tended to shorter in HPD group than that of ND group, however, there was no significant difference between ND and HPD groups.
Table 3
Weight and length of large intestine

After the experiment was terminated, the entire large intestine from cecum to rectum was taken out and the length of large intestine was measured with a ruler. The large intestine was then flushed out luminal contents with phosphate buffered saline and weighed. Values are presented as the mean ± standard error.
NS, not significant; ND, normal diet; HPD, high protein diet; TPA, 12-O-tetradecanoylphorbol-13-acetate; DSS, dextran sodium sulfate.
![]()
HPD increased DSS-induced colon mucosal hyperplasia and colonocyte proliferation
When the structure of large intestine was examined, both ND and HPD control group showed the normal structures of colon wall, submucosa, and crypts (Figure 4). DSS treatment, however, results in the pathological changes of the large intestine with loss of epithelial barrier, narrowing of lumen, decrease in the number of crypts, and submucosal edema. The changes were more prominent in HPD-DSS group (Figure 4G and 4H). Histological changes were determined measuring the thickness of rectal mucosa which indicates the state of hyperplasia with light microscope. Average mucosal thickness score was increased by DSS treatment both in ND and HPD group (Figure 5I). The mucosa was more thickened by DSS treatment in HPD group.
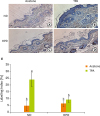
 | Figure 4Effect of HPD on mouse mucosal hyperplasia. The distal part of large intestine was removed and fixed in 10% formalin. (A-H) Histological analysis of the skin of ND (upper panel) and HPD fed mice (lower panel) with or without DSS and/or TPA treatment. Tissue sections were stained with H & E and photographed at 100×. (I) Mucosal thickness was measured microscopically. Each value represents the mean ± standard error of the mucosal thickness from 3 random tissue sections in each animal and 3 mice/group.
HPD, high protein diet; ND, normal diet; DSS, dextran sodium sulfate; TPA, 12-O-tetradecanoylphorbol-13-acetate; H & E, hematoxylin and eosin.
Means with different letters are significantly different at p < 0.05 by Duncan's multiple range test. In the graph, alphabets are assigned sequentially starting from a high number to a.
|
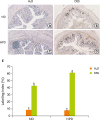 | Figure 5Effect of HPD on mucosal cell proliferation in mouse colon. The distal part of large intestine was removed and fixed in 10% formalin. Rectal sections of mice fed (A) ND and administered with H2O, (B) ND and administered with DSS (2%), (C) HPD and administered with H2O, (D) HPD and administered with DSS (2%) were immunostained with an antibody against BrdU and photographed at 200× magnification. (E) The index represents the percentage of BrdU-positive cells relative to the total number of mucosal cells in each experiment group. Each value represents the mean ± standard error of the labeling indices from 5 random tissue sections in each animal and 3 mice/group.
HPD, high protein diet; ND, normal diet; DSS, dextran sodium sulfate; BrdU, 5-bromo-2′-deoxyuridine.
Means with different letters are significantly different at p < 0.05 by Duncan's multiple range test. In the graph, alphabets are assigned sequentially starting from a high number to a.
|
In accordance with the result shown in Figure 3, BrdU labeling index was not significantly different between ND and HPD-control group (Figure 5). The number of proliferating mucosal epithelial cell in the colon crypts was significantly increased by DSS treatment both in ND and HPD group. HPD feeding, however, resulted in more proliferating mucosal cells by DSS treatment (Figure 5E).
HPD inhibits inflammatory gene expression in skin but increases in colon
Last, we analyzed the COX-2 expression in our skin and colon inflammation model system. COX-2 protein in the skin was strongly expressed by TPA treatment in ND group, however, it was not in HPD group (Figure 6A). In the colon, DSS administration increased the COX-2 expression both in ND and HPD group, however, the expression was stronger in HPD-DSS group than that of ND-DSS group (Figure 6B). When we measured the level of plasma NO as another inflammation marker, the level was also significantly increased by DSS, especially in HPD group (Figure 6C).
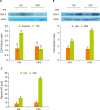 | Figure 6Expression of inflammatory protein in tissues and the production of plasma NO. Mouse dorsal skin (A) and the distal part of large intestine (B) were removed and homogenized. The protein levels were determined by immunoblotting with the appropriate antibodies, as indicated. (C) Plasma NO levels were measured in all mice. Values are presented as the mean ± standard error.
NO, nitric oxide; ND, normal diet; HPD, high protein diet; TPA, 12-O-tetradecanoylphorbol-13-acetate; COX-2, cyclooxygenase-2; DSS, dextran sodium sulfate.
Means with different letters are significantly different at p < 0.05 by Duncan's multiple range test. In the graph, alphabets are assigned sequentially starting from a high number to a.
|
DISCUSSION
The emerging role of chronic inflammation in various diseases including cancer has stimulated research into the influence of nutrition on inflammatory indices [16]. Accumulating epidemiological evidences have shown that chronic inflammation is associated with tumor development and, conversely, inhibition of inflammation reduces tumor incidence and cancer progression [123]. HPD is usually recommended for cancer patients in a purpose of compensating impaired bodily functions such as skeletal muscle protein breakdown, immune response, gastrointestinal functions, and wound healing [45]. However, protein and certain amino acids are utilized for tumors as a preferential energy source and for gluconeogenesis, respectively [171819]. In fact, we previously reported two independent study results that HPD has anti- and pro-tumorigenic effect in mouse skin [13] and colon [1415], respectively. Since the effect of HPD was contradictory in the two studies, we questioned whether ingestion of HPD has dual effect on skin and on colonic inflammation in a mouse as well. To address the question, we used TPA- and DSS-induced mouse skin inflammation and colitis model, respectively, in this study. As we know, this is the first study show that intake of HPD can exert differential influence on different tissues in an organism.
To investigate the dual effect of HPD on skin and colon inflammation, we designed the experiment treating mouse skin with TPA and administering DSS in drinking water in the same mouse while feeding HPD. We chose a study protocol to induce acute inflammation in the tissues to avoid a detrimental body condition by repetitive application of both TPA and DSS for a long period in a mouse. There was no significant difference in daily food intake, body weight, and general health condition in animals throughout the experiment.
TPA is the most potent and frequently used tumor promoter in mouse skin carcinogenesis [910]. Repetitive application of TPA to mouse skin elicits many diverse epigenetic and physiological changes in the skin, including induction of epidermal hyperplasia, inflammation, and alteration of gene expression. If TPA is applied to the genetically mutated (initiated) cells by a carcinogen, those changes of skin can help selective growth of initiated cells and tumor development. It is thought that TPA elicits its effects mainly through binding to and activation of protein kinase C (PKC) [2021]. Activated PKC triggers mitogen-activated protein kinase (MAPK) cascades and stimulates the expression of genes involved in proliferation and inflammation such as extracellular signal-regulated kinase (Erk) and COX-2 [22]. In our study, HPD feeding to the mouse abolished those TPA induced changes in skin. Epidermal cell proliferation, skin hyperplasia, and COX-2 gene expression were not increased by TPA in HPD group compared with ND group. Although the mechanism has not been fully understood, we previously showed that TPA-induced activation of protein kinase B (PKB, also called Akt) signaling pathway was significantly diminished by HPD [13]. PKB/Akt is one of the most frequently deregulated signaling molecules in pathological conditions, including cancer and inflammation [23]. Hyper-activation of PKB signaling is frequently observed in various cancers and the activated PKB up-regulates nuclear factor (NF)-κB pathway, which initiates pro-inflammatory signaling network [242526]. Considering that inhibition of PKB is a potent anti-inflammatory and anti-tumorigenic strategy, it will be of great interest to study how HPD block TPA-induced PKB signaling in mouse skin in the future.
DSS is widely used to induce acute or chronic colitis in mouse because of relatively simple protocol, low cost, and time saving [1112]. Above all, DSS-induced colitis resembles closely to ulcerative colitis (UC) in human symptomatically and pathologically [2728]. When the Swiss Webster mice were treated 4 cycles of DSS with each cycle consisting of 7 days of DSS followed by 14 days of water, loss of crypts and ulceration were seen after first 7 days of DSS [28]. Following one cycle, regenerative mucosal changes including glandular disarray and shortening of crypts were observed as seen in chronic UC in human. After completion of 4 cycles of DSS, approximately 15%–20% of mice developed colitis-associated dysplasia and adenocarcinomas. As we and others have shown that HPD exacerbates DSS-induced colitis and colorectal tumor development in mice [141529]. A plausible explanation for this has been suggested that dietary proteins that escape from digestion and absorption in the small intestine reach to the large intestine and undergoes bacterial fermentation (putrefaction) [67]. Protein fermentation produces metabolites such as H2S, ammonia, phenols, indoles and branched chain fatty acids which exert toxic effects to colonic health including thinning of the mucous barrier, increased colonic permeability, colonocyte DNA damage, and disruption in colonocyte metabolism and growth. In human trial, proportional increases in the content of ammonia and p-cresol were detected in the feces of the people when the protein was supplemented to basal diet without modifications in indigestible carbohydrate content [303132]. It has been reported that only 5% increase of protein supplementation in the basal diet results in marked increase in the protein fermentation [31].
Although HPD we provided to animals is isocaloric to ND, we cannot exclude a possibility that the results shown in this study were resulted from reduced carbohydrates (sucrose) contents in HPD. Normally, carbohydrates are digested and absorbed in small intestine and only undigested carbohydrates such as fiber are fermented in the proximal region of large intestine. The fermentation products are short chain fatty acids (SCFAs) including acetate, propionate, and butyrate which are major energy sources for colonocytes [33]. A concentration of SCFAs in the colonic luminal contents and colonocyte oxidative capacity were, however, not different between HP and NP isocaloric diet fed rats [834].
A limitation of this study is that we used casein as a protein source in experimental animal diet. Although evidences suggest that total intake of protein has a greater influence on the level of protein malabsorption than the nature of protein such as animal vs. plant protein [35363738], the composition of human diet is much more complex. It will be important to evaluate the effect of different combination of proteins in various diet patterns on the inflammation indices in different tissues including intestine.
CONCLUSION
In this study, we clearly showed that ingestion of HPD exerts anti- and pro-inflammatory responses in skin and in colon, respectively, in a mouse. Although the study was conducted in animals, this suggests that when we increase protein supplementation to the patients with inflammation-associated various degenerative diseases including cancer, diabetes, and atherosclerosis, thorough monitoring and surveillance of such a diet therapy (or nutrient intervention) efficacy in various tissues should be followed with a caution. Evaluation of luminal environment change including gut microbiota profile using feces of patients can be a way for such a monitoring in clinic.
 XML Download