

 PDF
PDF ePub
ePub Citation
 Print
Print


INTRODUCTION
Stroke is the second leading cause of death worldwide according to the World Health Organization [1]. Stroke patients usually have chronic disabilities and require long-term rehabilitation care. Such healthcare demands are currently of high concern, as the incidence of stroke increases with elderly society. Similarly, stroke is the third leading cause of death in Korea [2]. Stroke patients often experience a dysfunction in mobility due to weakened muscular strength, behavioral or/and cognitive disorder [3]. Mayo et al. [4] showed that many patients still have social restrictions and a lack of meaningful activities at a half year after stroke and such aftereffects could deteriorate a quality of life. By a year after stroke onset, a quality of life that the stroke patients feel decreases 40% compared to that the patients felt before a stroke [5]. Compared with other chronic diseases, a stroke patients can be at high risk of their quality of life threatened [6].
Anxiety/depression is the most prevalent neuropsychiatric complication of stroke survivors [78]. Post stroke anxiety/depression is associated with poor functional recovery and a high mortality rates [910]. Identifying and efforts to overcoming anxiety/depression may lead to improvements in the mental and physical health of stroke survivors. Early detection of depression symptoms may facilitate functional recovery and improve the quality of life in stroke patients. A generic measure of health-related quality of life, such as the EuroQoL-5 Dimensions Health Questionnaire (EQ-5D), has been introduced to researcher and health professionals to achieve comparisons across diseases and therapies. The EQ-5D has been translated for use in more than many populations and widely used across countries [11]. The high frequency of its use may be attributed to the fact that the generic EQ-5D has the features of both generic utility measurements and a multi-dimensional health profile. In addition, the health profile is rated in various health-related quality of life dimensions, such as the physical, psychological, and social aspects of a multi-dimensional disease, such as stroke [11].
Depression affects 1 in every 3 stroke survivors and represents an added source of morbidity, functional impairment, and mortality in this population [9]. Attempts to prevent the onset of depressive symptoms after stroke through the prophylactic use of antidepressants have been largely unsuccessful which, highlights the need for the introduction of more efficacious and safer interventions [12131415]. Treatment with vitamins B complex may reduce the relative risk of stroke by 18% [16]. In addition, existing evidence suggests that the consumption of these vitamins through diet or supplementation may improve a response to standard antidepressant treatment and reduce the prevalence of an anxiety/depression [1718]. The possible antidepressant effect of these vitamins has been attributed to the facilitation of methylation reactions in neurons in brain that ultimately lead to the synthesis of neurotransmitters (such as dopamine, and serotonin) or, alternatively, to a decrease in cerebrovascular burden, as postulated by the vascular hypothesis of depression [1920].
Therefore, this study examined the nutrition intake level of stroke patients according to their degree of anxiety/depression.
MATERIALS AND METHODS
Study subjects
The data of study subjects were obtained from 2013 to 2015 through the Korea National Health and Nutrition Examination Survey (KNHANES). The KNHANES included a health examination, interviews, and nutrition survey. The health interview and health examination were performed by trained medical staffs and interviewers. One week after the health interview and examination surveys, dietitians interviewed subjects for the nutrition survey.
KNHANES data are valuable sources for monitoring changes in risk factors and diseases, and for identifying target groups in need of interventions. The questionnaires used in this study included questions that addressed the demographic, socioeconomic, dietary, and medical history of each respondent. The food intake databases of the KNHANES were collected by survey method asking personal food intakes during the last 24 hours. This method surveys all foods that were consumed by subjects at a last day before the survey, and surveys individual dietary behaviors such as types, and amounts of foods consumed.
Among 412 subjects of stroke diagnosed, with the exception of 7 persons without anxiety/depression information of EQ-5D index and 27 persons without food intake databases, 378 stroke diagnosis subjects consisting of 187 male subjects (49.5%) and 191 female subjects (50.5%) were included in our final analysis.
In this study, the data were obtained from the KNHANES database (http://knhanes.cdc.go.kr) managed by Korea Centers for Disease Control and Prevention (KCDC). KNHANES dataset is available to the public and approved by the Institutional Review Board of the KCDC.
General characteristics
Socio-demographic survey information including age, sex, residential area, educational level, and household income were obtained. Residential area was categorized into a rural, and an urban area. Education level was divided into groups as elementary school, middle school, high school, or university, by the subject's highest achieved level. Household income was categorized into quartiles as follows: low, low-moderate, moderate-high, and high. Anthropometric measurements were obtained by trained staff members with subjects dressed in a light gown. The height and body weight were measured to the nearest 0.1 cm and 0.1 kg, respectively. Body mass index (BMI) was calculated as the subject's weight (kg) divided by the square of the subject's height (m2) and waist circumference was measured in standing position at a level of midpoint between the lower rib margin and the iliac crest during minimal respiration. Blood pressure (BP) was measured using a mercury sphygmomanometer 3 times with the subject in a seated position after at least 5 minutes of resting.
To assess serum levels of biochemical markers, blood samples were collected after an overnight fasting and were analyzed at a central, certified laboratory. Biochemical profiles information survey including lipid profile and fasting glucose were obtained. Serum levels of glucose were determined by a hexokinase method. Total cholesterol (TC), triglyceride, and high-density lipoprotein cholesterol (HDL-C) levels were measured enzymatically with an automatic chemistry analyzer and low-density lipoprotein cholesterol (LDL-C) level was LDL cholesterol level was estimated indirectly using the Friedewald formula, i.e., LDL-C = TC − HDL-C + (triglycerides/5), for subjects with serum triglyceride concentrations less than 400 mg/dL.
Dietary behaviors and nutrient intake
Nutrient intake and dietary behavior information including smoking status, and alcohol use were obtained. Subjects were divided into 3 groups according to their smoking status during the survey period, as follows: nonsmoker, ex-smoker, or current smoker. Similarly, a current drinker was defined as a subject who drank alcoholic beverages regularly during the survey period, as follow: nondrinker, ex-, or current drinker. The nutrition questionnaire was based on the 24-hour recall method. In order to evaluate nutrient intake, 3-day food record method were conducted and analyzed using the computer-aided nutritional analysis program. The intake level of 3 types of energy nutrients and water-soluble vitamins were analyzed.
Definition of EQ-5D
The EQ-5D was developed by the European quality of life (EuroQoL) group in 1990 [11]. The EQ-5D is a generic and standardized measure of health and health-related quality of life status for clinical and economic appraisal. The EQ-5D index score is derived by first describing an individual health state using the EQ-5D classification system, which consists of 5 dimensions, including mobility, self-care, usual daily activities, pain/discomfort, and anxiety/depression, with 3 levels for each dimension (i.e., no problem, some problems, and extreme problems), and then determining the preference based index score for that health state using an EQ-5D scoring function. This 3-level rating scale has a great advantage of being brief, allowing for quick administration [11].
Statistical analysis
All data were expressed as number and percentage (%) or mean ± standard error. Continuous variables were compared by using an independent t-test. Categorical variables were compared by using the χ2 test. The p values of < 0.05 were considered statistically significant. The Statistical Package for the Social Sciences (SPSS, version 20; SPSS Inc., Chicago, IL, USA) was used for these analyses.
RESULTS
General characteristics and nutrient intake according to the EQ-5D index status
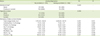
The general characteristics of the subjects are described in Table 1, according to the presence of no problem of EQ-5D index group (n = 119) and having a problem of EQ-5D index group (n = 259). The mean age was 64.2 years in the no problem group and 69.1 years in the having a problem group (p < 0.001). In the having a problem group, 58.8% were men vs. 45.2% in the presence of no problem group (p = 0.014). Table 2 shows differences in dietary behaviors and nutrient intake between 2 groups. No significant differences were observed in cigarette smoking and alcohol consumption between groups. The difference was not yet significant between 2 groups after further adjustment for age and sex.
Table 1
Baseline characteristics of the subjects according to EQ-5D index
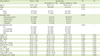
Values are represented as mean ± standard error for continuous variables and number of counts with a percentage for categorical variables. The p values are from Student's t-test for continuous variables and χ2 test for categorical variables assessing the difference between the groups.
EQ-5D, EuroQoL-5 Dimensions Health Questionnaire; P0, the p-value for an unadjusted model; P1, the p-value for a model adjusted for age and sex; BMI, body mass index; BP, blood pressure; TC, total cholesterol; HDL-C, high-density lipoprotein cholesterol; LDL-C, low-density lipoprotein cholesterol.
*Some variables included missing data points.
![]()
Table 2
Nutrient intake and life habit status of the subjects according to EQ-5D index
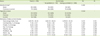
Values are represented as mean ± standard error for continuous variables and number of counts with a percentage for categorical variables. The p values are from Student's t-test for continuous variables and χ2 test for categorical variables assessing the difference between the groups.
EQ-5D, EuroQoL-5 Dimensions Health Questionnaire; P0, the p-value for an unadjusted model; P1, the p-value for a model adjustedfor age and sex.
*Some variables included missing data points.
![]()
EQ-5D distribution according to anxiety/depression status
To determine the quality of life distribution according to anxiety/depression status, quality of life was categorized as “no problem,” “some problem,” and “having a problem” for the 5 items. The each items of 5-dimensional questionnaire differed significantly according to anxiety/depression status. For mobility, 58.0% of patients in group of no problem answered “no problem,” in mobility whereas only 22.1% of patients in a group of having a problem of anxiety or depression answered “no problem” (p < 0.001). For self-care, 80.3% of patients in a group of no problem of anxiety/depression answered “no problem,” whereas 48.1% of patients in a group of having a problem of anxiety or depression group answered “no problem” (p < 0.001). For usual activities, 69.0% of patients in a group of no problem of anxiety/depression answered “no problem,” whereas 25.0% of patients in a group of having a problem of anxiety or depression group answered “no problem” (p < 0.001). For pain/discomfort, 60.0% of patients in a group of no problem of anxiety/depression answered “no problem,” in pain or discomfort whereas 18.3% of patients in a group of having a problem of anxiety or depression answered “no problem” (p < 0.001). The no problem of anxiety/depression group had significantly higher EQ-5D index compared to the group with having a problem of anxiety/depression had (p < 0.001) (Table 3).
Table 3
EQ-5D distribution according to anxiety/depression status in patients with stroke
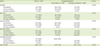
Values are represented as mean ± standard error for continuous variables and number of counts with a percentage for categorical variables. The p values are from Student's t-test for continuous variables and χ2 test for categorical variables assessing the difference between the groups.
EQ-5D, EuroQoL-5 Dimensions Health Questionnaire.
![]()
General characteristics of the subjects according to anxiety/depression status
The general characteristics of the subjects are described in Table 4, according to results from the presence of no problem of anxiety/depression group (n = 274) and having a problem of anxiety or depression group (n = 104). The mean age was 67.4 years in the normal group and 68.0 years in the anxiety or depression group. In the anxiety or depression group, 39.4% were men vs. 53.3% in the normal group (p = 0.016). Mean values of height, body weight, BMI, waist circumferences, and systolic and diastolic BPs were 158.7 ± 0.46 cm, 62.3 ± 0.56 kg, 24.7 ± 0.18 kg/m2, 86.1 ± 0.49 cm, 128.1 ± 1.01 mmHg, 73.2 ± 0.63 mmHg, respectively. There was no significant difference between the normal group and the anxiety or depression group, respectively. There was no significant difference between 2 groups in their serum levels of TC, HDL-C, LDL-C, triglycerides, and fasting glucose. Additionally, there was no significant difference between 2 groups even after further adjustment for sex.
Table 4
Baseline characteristics of the subjects according to anxiety/depression status
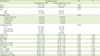
Values are represented as mean ± standard error for continuous variables and number of counts with a percentage for categorical variables. The p values are from Student's t-test for continuous variables and χ2 test for categorical variables assessing the difference between the groups.
P0, the p-value for an unadjusted model; P1, the p-value for a model adjusted for sex; BMI, body mass index; BP, blood pressure; TC, total cholesterol; HDL-C, high-density lipoprotein cholesterol; LDL-C, low-density lipoprotein cholesterol.
*Some variables included missing data points.
![]()
Dietary behaviors and nutrient intake according to anxiety/depression status
Table 5 shows differences in dietary behavior and nutrient intake between the 2 groups. No significant differences were observed in cigarette smoking and alcohol consumption. There was no significant difference between the groups with respect to the proportion of caloric intake from macronutrients and vitamin C intake; however, the intake of total energy (p = 0.013), riboflavin (p = 0.041), and niacin (p = 0.038) was significantly higher in stroke patients with having no anxiety/depression than stroke patients with having an anxiety/depression after adjustment for sex.
Table 5
Nutrient intake and life habit status of the subjects according to anxiety/depression status
Values are represented as mean ± standard error for continuous variables and number of counts with a percentage for categorical variables. The p values are from Student's t-test for continuous variables and χ2 test for categorical variables assessing the difference between the groups.
P0, the p-value for an unadjusted model; P1, the p-value for a model adjusted for sex.
*Some variables included missing data points.
![]()
DISCUSSION
In this study, the nutrition intake level of stroke patients according to their degree of anxiety/depress was examined. The results showed that the total energy intake, riboflavin, and niacin was significantly higher in stroke patients without anxiety/depression than stroke patients with an anxiety/depression. The results also showed an association between usual activities or pain/discomfort and anxiety/depression status of stroke patients.
Meta-analyses found that the incidence of depression at 5 years post-stroke was 31% and the prevalence of depression after stroke was 29% [21]. Kim et al. [22] showed that the prevalence of depression was 2.6-fold higher in stroke patients than in the non-stroke general population. Higher functional disability, longer hospitalization, worse cognition, lower quality of life, and increased mortality are associated with anxiety/depression [2123].
During the acute and rehabilitation phases of stroke, nutrition care is a part of the interdisciplinary approach for the treatment of these patients. Brain injury resulting from stroke has metabolic consequences, and the presence of malnutrition after stroke contributes to clinical outcomes [24252627]. Cellular damage in cerebral ischemia is partly caused by oxidative damage and lipid peroxidation [28]. Some studies have showed that nutrition supplementation with vitamin B complex group may mitigate oxidative damage after acute ischemic stroke. The thiamine (vitamin B1) intake reduced skeletal muscle cramps, promoted perfusion to the heart, and brain, and was effective in energy metabolism and nervous system functioning [29]. In addition vitamin B1 could increase endorphin secretion and, subsequently, cause relaxation and stimulate sleeping through affecting the brain and liver. This nutrients is also effective in releasing adenosine 5′-triphosphate (ATP) and could attenuate the progression of vascular disease [29]. Previous studies also showed the effectiveness of vitamin B1 in decreasing depression, stress, anxiety, pain, fatigue, and sleep disorders which consequently increase the quality of life [303132]. Almeida et al. [33] showed that vitamin B complex treatment (vitamin B6, B12, and folic acid) reduced the hazard of a major depressive episode compared with placebo among survivors of a stroke or transient ischemic attack. In a study with patients who were randomized within 12 hours after a brain infarct to a group receiving or not receiving vitamin B complex (folate, B2, B6, and B12) for 2 weeks, the patients who received the vitamin supplementation had a reduction in plasma levels of malondialdehydes and C-reactive protein, than the controls patients had [34]. Ullegaddi et al. [34] showed the positive effects of vitamin B complex supplementation on antioxidant capacity comparable to the effect of antioxidant vitamins in patients with acute ischemic stroke.
The present study was subject to several limitations. First, only the association was examined due to a cross-sectional design of the study. Second, hospital stroke patients were not included who constitute the typical population of acute or more-severe strokes. Furthermore, most studies have categorized stroke as a composite outcome, without distinguishing first-ever stroke from recurrent stroke, ischemic stroke from hemorrhagic stroke, ischemic stroke due to large artery disease from ischemic stroke due to small artery disease and embolism from the heart, and hemorrhagic stroke due to hypertensive small vessel disease from its many other causes. Therefore, we may have underestimated the effect of stroke status on anxiety/depression. Despite these limitations, this study provides valuable information since it analyzed data from a well-managed national survey applied to the Korean people. In conclusion, a higher prevalence of anxiety/depression was found in subjects who had been diagnosed with stroke, and stroke was a significant risk factor for depression. Many studies have assessed the associations between dietary exposures and stroke risk. The anxiety/depression of stroke patient negatively influences their food intake, activities of daily living and quality of life. Therefore, further research is needed to learn detailed association of many nutrients, foods, and dietary patterns with stroke risk.
In summary, the study has shown the association between nutrition intake, usual activities and pain/discomfort status in the stroke patients with an anxiety/depression. Therefore, we should be careful about the dietary intake including calories and nutrient intake for these patients.
 XML Download