Journal List > Clin Nutr Res > v.6(2) > 1059886

Baek, Oh, Sohn, Woo, Lee, Ju, and Seo: Applicability Evaluation of Job Standards for Diabetes Nutritional Management by Clinical Dietitian

Abstract

This study was conducted to evaluate applicability of job standards for diabetes nutrition management by hospital clinical dietitians. In order to promote the clinical nutrition services, it is necessary to present job standards of clinical dietitian and to actively apply these standardized tasks to the medical institution sites. The job standard of clinical dietitians for diabetic nutrition management was distributed to hospitals over 300 beds. Questionnaire was collected from 96 clinical dietitians of 40 tertiary hospitals, 47 general hospitals, and 9 hospitals. Based on each 5-point scale, the importance of overall duty was 4.4 ± 0.5, performance was 3.6 ± 0.8, and difficulty was 3.1 ± 0.7. ‘Nutrition intervention’ was 4.5 ± 0.5 for task importance, ‘nutrition assessment’ was 4.0 ± 0.7 for performance, and ‘nutrition diagnosis’ was 3.4 ± 0.9 for difficulty. These 3 items were high in each category. Based on the grid diagram, the tasks of both high importance and high performance were ‘checking basic information,’ ‘checking medical history and therapy plan,’ ‘decision of nutritional needs,’ ‘supply of foods and nutrients,’ and ‘education of nutrition and self-management.’ The tasks with high importance but low performance were ‘derivation of nutrition diagnosis,’ ‘planning of nutrition intervention,’ ‘monitoring of nutrition intervention process.’ The tasks of both high importance and high difficulty were ‘derivation of nutrition diagnosis,’ ‘planning of nutrition intervention,’ ‘supply of foods and nutrients,’ ‘education of nutrition and self-management,’ and ‘monitoring of nutrition intervention process.’ The tasks of both high performance and high difficulty were ‘documentation of nutrition assessment,’ ‘supply of foods and nutrients,’ and ‘education of nutrition and self-management.’

INTRODUCTION

According to the National Health Statistics of Korea in 2015, the prevalence of diabetes, which is one of the representative chronic diseases, is 12.0% for males and 9.4% for females, and it has increased to over 20% in 60 years old [1]. It is urgent to control blood sugar and to prevent diabetic complications through improvement of dietary habits for diabetes management [2]. Therefore, in order to effectively manage diabetes, the importance of nutrition education and counseling to patients is heightened and the quality of clinical nutrition service needs to be improved [3]. Clinical nutrition services in hospitals are not only systematic activities that promote the treatment of diseases by improving the nutritional status of the patients but also proper nutrition treatment plan by evaluating and diagnosing the nutritional status of the patients [45].
Since 2002, the United States has adopted a bill to apply Medical Nutrition Therapy to the health insurance system [6]. Like the Joint Commission International abroad, the Korea Institute for Healthcare Accreditation evaluation system recommended that patients with malnourished risk should be identified early by the early nutritional evaluation so that they could be provided with the proper nutritional management and intervention, and continuous monitoring if necessary [5].
Korean national clinical dietician system was introduced since the National Nutrition Control Act was enacted in 2010. In order to promote the clinical dietitian system, it is necessary to present a clear and specific role of clinical dietician and to actively apply these standardized tasks to the medical institution sites [7].
The American Diabetes Association provides principles and standards for diabetes education guidelines such as ‘national standards for diabetes self-management education’ and contributes to the standardization of clinical nutritional therapy for diabetic patients [8]. A tool which can measure the effects of the evidence-based nutrition management was developed and is being used for evaluation of the nutritional management effect. This tool includes ‘evidence-based nutrition practice guidelines,’ ‘nutrition care process and terminology (NCPT),’ and ‘Academy of Nutrition and Dietetics Health Informatics Infrastructure’ [9]. In Australia, a nutrition care process (NCP) implementation package that integrates the NCP and NCPT has been developed and used for conducting a research which compares the results of before and after the training in order to evaluate the performance of the NCP process [10].
In Korea, there is a demand on improvement of the quality of clinical nutrition service through the standardization of clinical nutrition service because the clinical nutrition service of medical institutions varies greatly depending on the region, size of institutions, and manpower status. Therefore, clinical dietitian's job descriptions have been developed through the Developing A Curriculum (DACUM) analysis [11], and the job standards of clinical dietitian and practice guidelines have been developed for the clinical nutrition therapy of diabetes, cancer, and dyslipidemia to ensure that patients are managed accurately and efficiently [12].
However, there have been several studies on the job standards of clinical dietitian that are specialized for each disease, but there is no actual study on whether the developed job standards are accurate and useful. In order to improve the quality of the clinical nutrition service provided to the patients, it is necessary to understand the perception of dietitians on importance, performance, and difficulty of the job standards [13].
Therefore, this study was conducted to provide useful data for promoting the field application of job standards by evaluating the degree of utilization of the job standards of clinical dietitian for the management of diabetic patients at the hospital.

MATERIALS AND METHODS

Study subjects and period

In order to evaluate the degree of utilization of the job standards of clinical dietitian for nutrition management of diabetic patients, a questionnaire survey was conducted on dietitians who are currently responsible for diabetic clinical nutrition therapy in 239 middle and large hospitals over 300 beds in Korea. The survey was conducted between September 7, 2015 to September 18, 2015, using postal mail and e-mail for about 2 weeks. The data collected from 96 hospitals (40.3%) out of 239 hospitals were used for analysis. This study was approved by the Institutional Review Board of the Yeungnam University (approval number: 2015-R-0036-002).

Current status of clinical nutrition service for diabetic patients

The questionnaire for domestic clinical nutrition service was composed of 5 main fields as general status of hospitals, dietician workforce, diabetic clinical nutrition service achievement, other matters, and the status of job standards application to job process for nutrition management of diabetic patients.

Utilization of the job standards of clinical dietitian for diabetes management

In order to investigate the utilization of job standards of clinical dietitians for diabetes management, importance, performance, and difficulty of 4 duties, 19 tasks, and 56 task elements of responsible dietitians were evaluated by the 5 step Likert scale method. Survey questions related to must-do jobs for dietitians at the actual hospital were included how it is important (importance), how often is happens (performance), and how difficult it is (difficulty) in terms of the utilization of job standards of clinical dietitians for diabetes management. Considering the responsibilities of the clinical dietitians, the importance score was presented according to ‘the degree of risk for the patient when the task was not performed properly.’ The performance score has been presented according to the degree of ‘how often I have done,’ considering what dietitians did so far. The difficulty score was presented according to the degree of difficulty in performing the job in consideration of the duties performed by the dietitians so far.

Statistical analysis

Statistical Package for the Social Sciences (SPSS, version 21.0; SPSS Inc., Chicago, IL, USA) statistical program was used to analyze the collected data. In order to identify general characteristics, mean and standard deviation, frequency, and percentage were calculated. To compare the importance, performance, and difficulty of all items in the job standard, repeated measure analysis of variance (ANOVA) analysis was performed and post test was performed with Bonferroni's multiple test method to verify the significance. To analyze the correlation between the importance and performance, difficulty and performance of the task in the job standards, a grid diagram was created by the method proposed by Green [14].

RESULTS

Characteristics of the respondents for job standards of clinical dietitian

Table 1 shows the characteristics of hospital clinical dietitians who responded to job standard questionnaires for diabetic clinical nutrition therapy. These dietitians were working in 40 tertiary hospitals (41.7%), 47 general hospitals (49.0%), and 9 hospitals (9.4%). The average number of annual hospital admissions beds was 738.9 ± 425.1 and the annual number of operating hospital beds was 716.7 ± 418.7. The average number of annual inpatients and annual outpatients was 176,732 ± 173,242 and 582,295 ± 501,695, respectively.
Table 1

Characteristics of the hospitals and respondents surveyed for evaluation of field application of job standards

cnr-6-99-i001
Variable Classification Value
Hospital (n = 96) Type Tertiary hospital 40 (41.7)
General hospital 47 (49.0)
Hospital 9 (9.4)
Scale Permitted bed* 738.9 ± 425.1
Available bed 716.7 ± 418.7
Inpatient 176,732.9 ± 173,242.0
Outpatient§ 582,295.2 ± 501,695.0
Nutrition education room Separate spaces (unshared) 61 (63.5)
Separate spaces (shared) 19 (19.8)
No separate spaces 16 (16.7)
Food service operation type In hospital 50 (53.2)
In consignment 42 (44.7)
Others 2 (2.1)
Affiliation Administrative parts 38 (40.0)
Medical support parts 57 (60.0)
Clinical dietitian (n = 96) Work experience, mon Nutrition care 185.9 ± 101.6
Clinical nutrition care 122.3 ± 73.0
Diabetes care** 120.9 ± 78.2
Certificate Clinical dietician with diabetes educator certificate 40 (41.7)
Data are shown as mean ± SD or number (%).
SD, standard deviation; min, minimum; max, maximum.
*Permitted bed: number of permitted bed in 2014. Available bed: number of available bed in 2014. Inpatient: number of inpatients admitted in 2014. §Outpatient: number of outpatients admitted in 2014. Nutrition care: min = 12, max = 504. Clinical nutrition care: min = 9, max = 362. **Diabetes care: min = 3, max = 342.
Percentage of the hospitals used a separate room for nutrition education (counseling) room was 63.5% and 19.8% used a separate room but shared with other purpose. For hospital foodservice type, 53.2% was direct management and 44.7% was consignment operation. The period of dietitians' work experience was 185.9 ± 101.6 months. Clinical dietician's work experience was 122.3 ± 73.0 months. Diabetes care experience was 120.9 ± 78.2 months, and the clinical dietitian with diabetes educator certificate was 41.7%.

Perceived importance, performance, and difficulty on duties in job standards of clinical dietitian for diabetes management

Table 2 summarizes the importance, performance, and difficulty of the 4 duties of job standards for diabetic clinical nutrition therapy. With respect to overall mean value, the importance of duty was 4.4 ± 0.5, which reveals that job standards for clinical nutrition of diabetes mellitus were recognized as generally important. Performance was 3.6 ± 0.8 and difficulty was 3.1 ± 0.7.
Table 2

Perceived importance, performance, and difficulty of duty in job standards for diabetes nutritional management

cnr-6-99-i002
Duty Importance Performance Difficulty p value
A. Nutrition assessment 4.4 ± 0.4a 4.0 ± 0.7b 2.7 ± 0.7c < 0.001
B. Nutrition diagnosis 4.4 ± 0.6a 3.6 ± 1.1b 3.4 ± 0.9b < 0.001
C. Nutrition intervention 4.5 ± 0.5a 3.7 ± 0.8b 3.2 ± 0.8c < 0.001
D. Nutrition monitoring evaluation 4.4 ± 0.6a 3.0 ± 1.3b 3.2 ± 0.9b < 0.001
Total 4.4 ± 0.5a 3.6 ± 0.8b 3.1 ± 0.7c < 0.001
Data are shown as mean ± SD. p value is the result by repeated measure ANOVA test. Scale score: 1 (never important, very poor, and never difficult)–5 (very important, very good, and very difficult).
SD, standard deviation; ANOVA, analysis of variance.
a,b,cBonferroni's multiple-comparisons post hoc test: a > b > c.
Among the duty items, the importance of ‘nutrition intervention’ was the highest at 4.5 ± 0.5 and the importance of ‘nutrition assessment’ was the lowest at 4.4 ± 0.4. Among the performance items, ‘nutrition assessment’ was the highest at 4.0 ± 0.7 and the ‘nutrition monitoring evaluation’ was the lowest at 3.0 ± 1.3. Among the difficulty items, ‘nutrition diagnosis’ was the highest at 3.4 ± 0.9 and the ‘nutrition assessment’ was the lowest at 2.7 ± 0.7.

Perceived importance, performance, and difficulty on tasks in job standards of clinical dietician for diabetes management

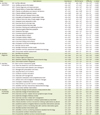
Table 3 shows the importance, performance, and difficulty of the 19 tasks of the job standard for diabetic clinical nutrition therapy. Among task items, importance and performance of ‘checking basic information’ at ‘nutrition assessment’ were the highest at 4.7 ± 0.6 and 4.7 ± 0.7, respectively. ‘Examination of test data’ of importance at ‘nutrition assessment’ was the lowest at 4.2 ± 0.6. Among the performance items, ‘documentation of nutrition monitoring evaluation’ of ‘nutrition monitoring evaluation’ was the lowest at 2.8 ± 1.3. Among the difficulty items, score of ‘planning of nutrition intervention’ of ‘nutrition intervention’ and ‘derivation of nutrition diagnosis’ of ‘nutrition diagnosis’ was the highest at 3.5 ± 1.0 and 3.5 ± 0.9, respectively. The score of ‘checking basic information of nutrition assessment’ was the lowest at 1.8 ± 0.9.
Table 3

Perceived importance, performance, and difficulty of task in job standards for diabetes nutritional management

cnr-6-99-i003
Duty Task Importance Performance Difficulty p value
A. Nutrition assessment A1. Checking basic information 4.7 ± 0.6a 4.7 ± 0.7a 1.8 ± 0.9b < 0.001
A2. Checking medical history and therapy plan 4.5 ± 0.5a 4.1 ± 0.8b 2.9 ± 0.9c < 0.001
A3. Evaluation of anthropometric measurement data 4.4 ± 0.5a 3.9 ± 0.8b 2.5 ± 0.9c < 0.001
A4. Examination of test data 4.2 ± 0.6a 3.4 ± 1.0b 3.0 ± 0.9c < 0.001
A5. Examination of physical signs data 4.4 ± 0.6a 4.0 ± 0.8b 2.4 ± 0.9c < 0.001
A6. Collection and evaluation of food nutrition-related data 4.4 ± 0.6a 3.8 ± 0.8b 3.0 ± 0.9c < 0.001
A7. Decision of nutritional needs 4.5 ± 0.6a 4.1 ± 1.0b 2.7 ± 1.1c < 0.001
A8. Documentation of nutrition assessment 4.3 ± 0.7a 3.8 ± 1.0b 3.1 ± 1.0c < 0.001
B. Nutrition diagnosis B1. Derivation of nutrition diagnosis 4.4 ± 0.6a 3.6 ± 1.1b 3.5±0.9b < 0.001
B2. Documentation of nutrition diagnosis 4.4 ± 0.7a 3.6 ± 1.2b 3.2 ± 1.0b < 0.001
C. Nutrition intervention C1. Planning of nutrition intervention 4.6 ± 0.5a 3.5 ± 1.0b 3.5 ± 1.0b < 0.001
C2. Supply of foods and nutrients 4.7 ± 0.5a 4.4 ± 0.8b 3.1 ± 1.1c < 0.001
C3. Education of nutrition and self-management 4.6 ± 0.5a 4.0 ± 0.9b 3.1 ± 1.0c < 0.001
C4. Conducting nutrition counseling 4.3 ± 0.7a 3.3 ± 1.1b 3.2 ± 0.9b < 0.001
C5. Documentation of nutrition intervention 4.3 ± 0.8a 3.3 ± 1.1b 3.3 ± 1.0b < 0.001
D. Nutrition monitoring evaluation D1. Monitoring of nutritional status 4.4 ± 0.6a 3.0 ± 1.3b 3.0 ± 0.9b < 0.001
D2. Monitoring of nutrition intervention process 4.5 ± 0.6a 3.1 ± 1.3b 3.1 ± 1.0b < 0.001
D3. Evaluation of nutrition intervention 4.4 ± 0.7a 2.9 ± 1.3c 3.4 ± 1.0b < 0.001
D4. Documentation of nutrition monitoring evaluation 4.3 ± 0.7a 2.8 ± 1.3b 3.2 ± 1.0b < 0.001
Data are shown as mean ± SD. p value is the result by repeated measure ANOVA test. Scale score: 1 (never important, very poor, and never difficult)–5 (very important, very good, and very difficult).
SD, standard deviation; ANOVA, analysis of variance.
a,b,cBonferroni's multiple-comparisons post hoc test: a > b > c.

Analysis of perceived importance and performance on tasks in job standards of clinical dietitian for diabetes management

The results of the grid analysis with the average of the performance of the clinical dietitian's tasks as the x-axis and the average of the importance as the center line of the y-axis are shown in Figure 1.
Figure 1
Grid diagram of importance and performance of task in job standards for diabetes nutritional management. 1) Quadrant 1: A1. checking basic information, A2. checking medical history and therapy plan, A7. decision of nutritional needs, C2. supply of foods and nutrients, and C3. education of nutrition and self-management. 2) Quadrant 2: B1. derivation of nutrition diagnosis, C1. planning of nutrition intervention, and D2. monitoring of nutrition intervention process. 3) Quadrant 3: A4. examination of test data, B2. documentation of nutrition diagnosis, C4. conducting nutrition counseling, C5. documentation of nutrition intervention, D1. monitoring of nutritional status, D3. evaluation of nutrition intervention, and D4. documentation of nutrition monitoring evaluation. 4) Quadrant 4: A3. evaluation of anthropometric measurement data, A5. examination of physical signs data, A6. collection and evaluation of food nutrition-related data, and A8. documentation of nutrition assessment.
cnr-6-99-g001
As a result of dividing into 4 areas according to the relationship of importance and performance; A1. checking basic information, A2. checking medical history and therapy plan, A7. decision of nutritional needs, C2. supply of foods and nutrients, and C3. education of nutrition and self-management were included in Quadrant 1, where both importance and performance are high. Quadrant 2 included B1. derivation of nutrition diagnosis, C1. planning of nutrition intervention, and D2. monitoring of nutrition intervention process. In Quadrant 3, where both importance and performance were low, A4. examination of test data, B2. documentation of nutrition diagnosis, C4. conducting nutrition counseling, C5. documentation of nutrition intervention, D1. monitoring of nutritional status, D3. evaluation of nutrition intervention, and D4. documentation of nutrition monitoring evaluation were included. A3. evaluation of anthropometric measurement data, A5. examination of physical signs data, A6. collection and evaluation of food nutrition-related data, and A8. documentation of nutrition assessment were included in Quadrant 4. In the grid analysis of importance and performance, items with high importance had generally high performance and those with low importance had low performance.

Analysis of perceived importance and difficulty of tasks in job standards of clinical dietitian for diabetes management

The results of the grid analysis with the average of difficulty of the clinical dietitian's tasks as the x-axis and the average of importance as the y-axis center line are shown in Figure 2.
Figure 2
Grid diagram of importance and difficulty of task in job standards for diabetes nutritional management. 1) Quadrant 1: B1. derivation of nutrition diagnosis, C1. planning of nutrition intervention, C2. supply of foods and nutrients, C3. education of nutrition and self-management, and D2. monitoring of nutrition intervention process. 2) Quadrant 2: A1. checking basic information, A2. checking medical history and therapy plan, and A7. decision of nutritional needs. 3) Quadrant 3: A3. evaluation of anthropometric measurement data, A5. examination of physical signs data, and A6. collection and evaluation of food nutrition-related data. 4) Quadrant 4: A8. documentation of nutrition assessment, B2. documentation of nutrition diagnosis, C4. conducting nutrition counseling, C5. documentation of nutrition intervention, D3. evaluation of nutrition intervention, and D4. documentation of nutrition monitoring evaluation.
cnr-6-99-g002
As a result of dividing into 4 areas according to the relationship of importance and difficulty, B1. derivation of nutrition diagnosis, C1. planning of nutrition intervention, C2. supply of foods and nutrients, C3. education of nutrition and self-management, and D2. monitoring of nutrition intervention process were included in Quadrant 1. Quadrant 2 included A1. checking basic information, A2. checking medical history and therapy plan, and A7. decision of nutritional needs. In particular, A1. checking basic information had the highest importance and the lowest difficulty. In Quadrant 3, where both importance and difficulty are low, A3. evaluation of anthropometric measurement data, A5. examination of physical signs data, and A6. collection and evaluation of food nutrition-related data were included. A8. documentation of nutrition assessment, B2. documentation of nutrition diagnosis, C4. conducting nutrition counseling, C5. documentation of nutrition intervention, D3. evaluation of nutrition intervention, and D4. documentation of nutrition monitoring evaluation were included in Quadrant 4. A4. examination of test data and D1. monitoring of nutritional status were found at the boundary between Quadrant 3 and Quadrant 4.

Analysis of perceived performance and difficulty of tasks in job standards of clinical dietitian for diabetes management

The results of the grid analysis with the average of difficulty of the clinical dietitian's tasks as the x-axis and the average of performance as the y-axis center line are shown in Figure 3.
Figure 3
Grid diagram of performance and difficulty of task in job standards for diabetes nutritional management. 1) Quadrant 1: A8. documentation of nutrition assessment, C2. supply of foods and nutrients, and C3. education of nutrition and self-management. 2) Quadrant 2: A1. checking basic information, A2. checking medical history and therapy plan, A3. evaluation of anthropometric measurement data, A5. examination of physical signs data, A6. collection and evaluation of food nutrition-related data, and A7. decision of nutritional needs. 3) Quadrant 4: B1. derivation of nutrition diagnosis, B2. documentation of nutrition diagnosis, C1. planning of nutrition intervention, C4. conducting nutrition counseling, C5. documentation of nutrition intervention, D2. monitoring of nutrition intervention process, D3. evaluation of nutrition intervention, and D4. documentation of nutrition monitoring evaluation.
cnr-6-99-g003
As a result of dividing into 4 areas according to the relationship between performance and difficulty, A8. documentation of nutrition assessment, C2. supply of foods and nutrients, and C3. education of nutrition and self-management were included in Quadrant 1, where both performance and difficulty are high. In Quadrant 2, A1. checking basic information, A2. checking medical history and therapy plan, A3. evaluation of anthropometric measurement data, A5. examination of physical signs data, A6. collection and evaluation of food nutrition-related data, and A7. decision of nutritional needs were included. In particular, A1. checking basic information showed the lowest difficulty and the highest performance. In Quadrant 3, where performance and difficulty are both low, no work was involved. B1. derivation of nutrition diagnosis, B2. documentation of nutrition diagnosis, C1. planning of nutrition intervention, C4. conducting nutrition counseling, C5. documentation of nutrition intervention, D2. monitoring of nutrition intervention process, D3. evaluation of nutrition intervention, and D4. documentation of nutrition monitoring·evaluation were included in Quadrant 4. A4. examination of test data and D1. monitoring of nutritional status were found at the boundary between Quadrant 3 and Quadrant 4.

Analysis of perceived importance, performance, and difficulty of task elements in job standards of clinical dietitian for diabetes management

Table 4 summarizes the importance, performance, and difficulty of the 56 task elements of job standards for diabetic clinical nutrition therapy. Of the total task elements, A1-1. verifies referrals, A2-1. checks diagnosis and treatment plan, A3-1. evaluates anthropometric measurement data, A6-1. evaluates dietary history, C2-1. manages diet prescription and menu, and C3-1. conducts nutrition education had high importance, and A4-2. examines physical function data had the least importance (3.6 ± 1.0). The performance was the highest with A1-2. verifies personal information (4.7 ± 0.8) and the lowest with A4-2. examines physical function data (2.6 ± 1.3). The difficulty was the highest with A2-2. checks history of prescribed medication of (3.7 ± 1.1) and the lowest with A1-1. verifies referrals (1.6 ± 1.0).
Table 4

Perceived importance, performance, and difficulty of task element in job standards for diabetes nutritional management

cnr-6-99-i004
Duty Task element Importance Performance Difficulty p value
A. Nutrition assessment A1-1. Verifies referrals 4.8 ± 0.6a 4.6 ± 0.8a 1.9 ± 1.0b < 0.001
A1-2. Verifies personal information 4.6 ± 0.7a 4.7 ± 0.7a 1.6 ± 1.0b < 0.001
A2-1. Checks diagnosis and treatment plan 4.8 ± 0.5a 4.3 ± 1.0b 3.0 ± 1.2c < 0.001
A2-2. Checks history of prescribed medication 4.5 ± 0.7a 3.6 ± 1.2c 3.7 ± 1.1b < 0.001
A2-3. Checks complications and related risk factors 4.7 ± 0.5a 4.4 ± 0.9b 2.3 ± 1.1c < 0.001
A2-4. Checks referral treatment results 4.3 ± 0.9a 3.8 ± 1.2b 3.2 ± 1.1c < 0.001
A2-5. Checks personal disease history data 4.4 ± 0.8a 4.3 ± 0.8a 2.5 ± 1.0b < 0.001
A3-1. Evaluates anthropometric measurement data 4.8 ± 0.4a 4.6 ± 0.8a 2.1 ± 1.0b < 0.001
A3-2. Collects historical data of body weight change 4.6 ± 0.6a 4.3 ± 1.0b 2.3 ± 1.0c < 0.001
A3-3. Assesses body composition data 3.8 ± 1.0a 2.8 ± 1.4b 3.0 ± 1.3b < 0.001
A4-1. Examines blood urine test data 4.7 ± 0.5a 4.3 ± 1.0b 2.7 ± 1.2c < 0.001
A4-2. Examines physical function data 3.6 ± 1.0a 2.6 ± 1.3b 3.3 ± 1.0a < 0.001
A5-1. Examines chewing and swallowing function 4.3 ± 0.8a 3.9 ± 1.1b 2.5 ± 1.0c < 0.001
A5-2. Examines gastrointestinal symptom 4.4 ± 0.7a 4.1 ± 0.9b 2.4 ± 1.1c < 0.001
A5-3. Examines vital signs 4.3 ± 0.8a 4.0 ± 1.2b 2.0 ± 1.0c < 0.001
A5-4. Examines physical symptom 4.5 ± 0.8a 4.0 ± 1.1b 2.8 ± 1.2c < 0.001
A6-1. Evaluates dietary history 4.8 ± 0.4a 4.5 ± 0.8b 2.7 ± 1.1c < 0.001
A6-2. Evaluates dietary intakes 4.4 ± 0.7a 3.6 ± 1.2b 3.5 ± 1.1c < 0.001
A6-3. Examines physical activity level 4.3 ± 0.8a 3.9 ± 1.0b 2.7 ± 1.0c < 0.001
A6-4. Examines dietary environment 4.1 ± 0.8a 3.5 ± 1.1b 3.1 ± 1.0c < 0.001
A6-5. Evaluates nutritional knowledge and attitudes 4.4 ± 0.7a 3.7 ± 1.1b 3.0 ± 1.1c < 0.001
A7-1. Decides calorie needs 4.7 ± 0.6a 4.5 ± 1.0b 2.6 ± 1.2c < 0.001
A7-2. Decides individual nutrient needs 4.3 ± 0.9a 3.8 ± 1.3b 2.9 ± 1.2c < 0.001
A8-1. Identifies nutrition assessment standard terminology 4.2 ± 0.9a 3.4 ± 1.2b 3.3 ± 1.0b < 0.001
A8-2. Documents nutrition assessment 4.5 ± 0.7a 4.2 ± 1.1b 3.0 ± 1.1c < 0.001
B. Nutrition diagnosis B1-1. Identifies the problem 4.6 ± 0.7a 3.8 ± 1.1b 3.4 ± 1.1b < 0.001
B1-2. Determines etiology 4.3 ± 0.8a 3.4 ± 1.2b 3.6 ± 1.0b < 0.001
B1-3. Clusters signs and symptoms 4.4 ± 0.8a 3.6 ± 1.2b 3.6 ± 1.0b < 0.001
B2-1. Identifies nutrition diagnosis standard terminology 4.3 ± 0.9a 3.5 ± 1.3b 3.3 ± 1.0b < 0.001
B2-2. Documents nutrition diagnosis 4.5 ± 0.7a 3.7 ± 1.3b 3.2 ± 1.1c < 0.001
C. Nutrition intervention C1-1. Sets nutrition intervention goals 4.6 ± 0.6a 3.7 ± 1.1b 3.5 ± 1.1b < 0.001
C1-2. Plans the details for nutrition intervention 4.6 ± 0.5a 3.7 ± 1.2b 3.6 ± 1.0b < 0.001
C1-3. Communicates with diabetes care colleagues 4.5 ± 0.8a 3.2 ± 1.3b 3.3 ± 1.2b < 0.001
C2-1. Manages diet prescription and menu 4.8 ± 0.5a 4.3 ± 0.9b 3.1 ± 1.1c < 0.001
C2-2. Supplies foods and nutrients 4.7 ± 0.6a 4.4 ± 0.8b 3.0 ± 1.1c < 0.001
C3-1. Conducts nutrition education 4.8 ± 0.4a 4.4 ± 0.7b 3.2 ± 1.1c < 0.001
C3-2. Educates self-management 4.6 ± 0.6a 3.8 ± 1.2b 3.2 ± 1.1c < 0.001
C3-3. Evaluates compliance and comprehension level 4.5 ± 0.7a 3.7 ± 1.3b 3.0 ± 1.1c < 0.001
C4-1. Utilizes tools and strategies for behavior changes 4.3 ± 0.8a 3.4 ± 1.2b 3.3 ± 1.0b < 0.001
C4-2. Evaluates compliance level 4.3 ± 0.9a 3.6 ± 1.3b 3.0 ± 1.1c < 0.001
C4-3. Plans follow-up care for nutrition counseling 4.3 ± 0.8a 2.8 ± 1.4c 3.4 ± 1.1b < 0.001
C5-1. Identifies nutrition intervention standard terminology 4.2 ± 0.9a 3.0 ± 1.4b 3.3 ± 1.0b < 0.001
C5-2. Documents nutrition intervention 4.4 ± 0.8a 3.5 ± 1.3b 3.3 ± 1.1b < 0.001
D. Nutrition monitoring evaluation D1-1. Examines change of anthropometric measurements data 4.3 ± 0.8a 3.0 ± 1.4b 2.9 ± 1.1b < 0.001
D1-2. Examines change of biochemical data 4.4 ± 0.7a 3.2 ± 1.5b 2.9 ± 1.2b < 0.001
D1-3. Examines nutrition-related clinical symptoms·signs change 4.3 ± 0.7a 3.0 ± 1.4b 3.1 ± 1.1b < 0.001
D1-4. Examines changes of dietary intakes 4.5 ± 0.6a 3.2 ± 1.4b 3.0 ± 1.1b < 0.001
D1-5. Examines nutrition-related self-management 4.3 ± 0.9a 2.8 ± 1.4b 3.1 ± 1.1b < 0.001
D2-1. Checks whether intervention is being implemented as prescribed 4.6 ± 0.6a 3.3 ± 1.4b 3.0 ± 1.1b < 0.001
D2-2. Checks whether nutrition intervention is being implemented as planed 4.5 ± 0.7a 3.2 ± 1.4b 3.1 ± 1.1b < 0.001
D2-3. Examines positive or negative factors on nutrition intervention process 4.3 ± 0.8a 2.8 ± 1.3c 3.3 ± 1.1b < 0.001
D3-1. Compares nutrition monitoring data with nutrition intervention goals 4.4 ± 0.7a 2.9 ± 1.4b 3.3 ± 1.1b < 0.001
D3-2. Modifies nutrition intervention plan 4.4 ± 0.7a 2.9 ± 1.4c 3.4 ± 1.0b < 0.001
D4-1. Identifies nutrition monitoring evaluation standard terminology 4.2 ± 0.7a 2.7 ± 1.4c 3.2 ± 1.0b < 0.001
D4-2. Documents nutrition intervention results 4.3 ± 0.7a 2.9 ± 1.4b 3.1 ± 1.0b < 0.001
D4-3. Documents modified nutrition intervention plan 4.3 ± 0.8a 2.9 ± 1.4b 3.2 ± 1.1b < 0.001
Data are shown as mean ± SD. p value is the result by repeated measure ANOVA test. Scale score: 1 (never important, very poor, and never difficult)–5 (very important, very good, and very difficult).
SD, standard deviation; ANOVA, analysis of variance.
a,b,cBonferroni's multiple-comparisons post hoc test: a > b > c.

DISCUSSION

The purpose of this study was to evaluate the utilization of the job standards of clinical dietitian for the management of diabetic patients and to improve the work capacity of clinical dietitians by effectively applying and spreading them to hospital sites.
As for the operation type of the hospital foodservices, direct management was 53.2%, and consignment operation (including partial consignment) was 46.8%. In the study of Lee and Kwak [15], of the hospitals over 500 beds, direct management was 58.7% and consignment operation was 41.3%. In the study of Kim [16], direct management and consignment operation of hospitals over 400 beds and more was 74% and 26%, respectively. It shows that the ratio of consignment operation is increasing. Because the characteristics of the direct management and consignment operation of hospital foodservices could be different in the implementation of clinical nutrition tasks, it is necessary to define the contents for each task, so that tasks can be clearly and efficiently performed.
The average periods of working experience were 185.9 ± 101.6 months for dietitians, 122.3 ± 73.0 months for clinical dietitians, and 120.9 ± 78.2 months for diabetic management dietitians, indicating that the experience of hospital dietitians is accumulated and specialized compared with the past [17].
The overall job performance was 3.6 ± 0.8 out of 5 when the job standards derived from this study was applied to the hospital site and then was evaluated, which showed that the job performance was increased compared to other related studies of which the job performance was 1.8 out of 5.0 [18]. Clinical dietitians in hospitals recognize the importance of clinical nutrition services, but their task performance may be lower due to the size and type of hospitals, lack of human resources, and lack of knowledge of clinical dietitians' roles [19]. However, since the national clinical dietitian system has been implemented, interest on the job standards of hospital clinical dietitian has been increased. Therefore, performance of job standards for clinical dietitian is expected to improve in the future.
‘Nutrition intervention’ was the most important factor in the recognition of the importance of job standards for diabetic clinical nutrition therapy. In the study by Um et al. [7], the total daily NCP work time of the clinic dietitians was the highest in ‘nutrition intervention’ among the NCP stage. It is considered that the tasks recognized as important in the nutrition management process are also time consuming in actual work performance in relationship to the results of this study.
The performance of ‘nutrition monitoring evaluation’ during duty was the lowest at 3.0 ± 1.3. In diabetic patients who need continuous treatment, continuous monitoring such as symptom changes, physical changes, and biochemical test results, as well as appropriateness of patient nutritional management are very important tasks, so practical plans to improve performance should be taken [20].
In the study of Cha et al. [11], the areas of high importance and performance for clinical dietitian jobs were nutrition screening, decision of nutritional needs, documentation of nutrition assessment, setting the nutrition diagnosis, planning the nutrition intervention, management of nutrition prescription, nutrition education, nutrition support, documentation of nutrition intervention, monitoring of nutritional status, and monitoring of nutrition intervention process. These were similar to the jobs, such as checking basic information, checking medical history and therapy plan, decision of nutritional needs, supply of foods and nutrients, and education of nutrition and self-management, which were included in areas where both importance and performance were high in this study. It is important to note that the clinical dietitian's job related to checking medical document, decision of nutritional needs, and education of nutrition is still important and the performance of these jobs are high.
The tasks of high importance but low performance were derivation of nutrition diagnosis, planning of nutrition intervention, and monitoring of nutrition intervention process. These tasks should be of interest because they are areas that help improve the quality of work. In addition, the result of Moon and Jang [21] showed the recognition that the higher the performance, the lower the difficulty and the lower the performance, the higher the difficulty. Therefore, the studies should be actively conducted on ways to reduce difficulty and improve performance. It is necessary to provide opportunities to educate the clinical dietitians to understand the tasks which are high importance and high performance but of which clinical dietitians feel difficult, so that the job standards can be accurately performed. It should be possible to lower the awareness of the difficulty by strengthening the practical training of the corresponding tasks such as supply of foods and nutrients, and education of nutrition and self-management.
The necessity of the standard education guidelines for the dietitians' education program and the utilization of the standard education guidelines were surveyed. In the result, 70.7% of the hospitals responded ‘very necessary and will use them,’ indicating that they realize the need for standardized education guidelines [22]. In 2015, job standards and guidelines for clinical nutrition therapy were developed, and 80.2% of the hospitals over 300 beds were recognizing job standards and guidelines for clinical nutrition therapy. Of these, 59.2% answered that they applied job standards and guidelines to clinic sites in hospitals. It is expected that the job standard for clinical nutrition therapy of diabetic patients will be used as educational data of clinical dietitian educational institutions, and specialized job training will be provided. Furthermore, it is necessary to standardize clinical nutrition education curriculum linked to practical training in hospitals, and to continue studies on qualification, education and standard job performance according to clinical dietitian's role [2223].
The purpose of this study is to evaluate the utilization of clinical dietitian job standards for the management of diabetic patients, to effectively apply and spread them to clinical sites, and to contribute to solve the clinical nutrition service disparity among medical institutions. However, due to the differences in the environment depending on the medical institutions, it is necessary to classify and apply the recommendation level of the job standard contents according to the type of the medical institutions, the hospital size, and the regional characteristics. It is also necessary to have a way to promote the achievement of the clinical nutrition treatment by applying the job standards.
In the future, in order to provide specialized clinical nutrition services for diabetic patients, it is necessary to specialize clinical nutrition service in accordance with the international trend and to strengthen practical training.

CONCLUSION

This study was conducted to evaluate applicability of the job standards of clinical dietitian for diabetes nutrition management. The tasks with low performance compared to their high importance are derivation of nutrition diagnosis, planning of nutrition intervention, monitoring of nutrition intervention process. The tasks with the high difficulty compared to their high importance are derivation of nutrition diagnosis, planning of nutrition intervention, supply of foods and nutrients, education of nutrition and self-management, and monitoring of nutrition intervention process. The tasks with high difficulty and low performance are derivation of nutrition diagnosis, documentation of nutrition diagnosis, planning of nutrition intervention, conducting nutrition counseling, documentation of nutrition intervention, monitoring of nutrition intervention process, evaluation of nutrition intervention, and documentation of nutrition monitoring evaluation. In order to widely apply the job standards of clinical dietitian for the management of diabetic patients, it is important to find a way to improve performance of the tasks of high importance but low performance.

Notes

Funding This research was supported by Support Program for Women in Science, Engineering and Technology through the National Research Foundation of Korea (NRF) funded by the Ministry of Science, ICT and Future Planning (No. 2014H1C3A1011558).

Conflict of Interest The authors declare that they have no competing interests.

References

1. Jang SN. Chronic illnesses and limited daily activities in the Korean elderly. Health Welf Policy Forum. 2015; 225:6–17.
2. Ministry of Health and Welfare, Korea Centers for Disease Control and Prevention. Korea Health Statistics 2015: Korea National Health and Nutrition Examination Survey (KNHANES VI-3). Sejong: Korea Centers for Disease Control and Prevention;2016.
3. Moon SJ, Shon CY, Kim JH, Kim HS, Lim HS, Lee HC, Huh KB. Measurement of nutrition counseling effects for diabetes mellitus patients. Korean J Nutr. 1994; 27:1070–1077.
4. White JV, Young E, Lasswell A. Position of the American Dietetic Association: nutrition-an essential component of medical education. J Am Diet Assoc. 1994; 94:555–557.
crossref
5. Um MH, Park YK, Lee SM, Lee SM, Lee E, Cha JA, Park MS, Lee HS, Rha MY, Lyu ES. Clinical nutrition service in Korean tertiary hospitals and general hospitals: result of nationwide cross-sectional survey. J Korean Diet Assoc. 2014; 20:183–198.
crossref
6. Park EC, Kim HA, Lee HY, Lee YE, Yang IS. A review of the medical nutrition therapy (MNT) of the U.S. medicare system. Korean J Community Nutr. 2002; 7:852–862.
7. Um MH, Park YK, Lee SM, Cha JA, Lee E, Lyu ES. Time measurement study of certified clinical dietitians from tertiary hospital in Seoul and Gyeonggi-do. J Korean Diet Assoc. 2015; 21:123–139.
crossref
8. Funnell MM, Brown TL, Childs BP, Haas LB, Hosey GM, Jensen B, Maryniuk M, Peyrot M, Piette JD, Reader D, Siminerio LM, Weinger K, Weiss MA. National standards for diabetes self-management education. Diabetes Care. 2012; 35:Suppl 1. S101–S108.
crossref
9. Thompson KL, Davidson P, Swan WI, Hand RK, Rising C, Dunn AV, Lewis N, Murphy WJ. Nutrition care process chains: the “missing link” between research and evidence-based practice. J Acad Nutr Diet. 2015; 115:1491–1498.
crossref
10. Porter JM, Devine A, Vivanti A, Ferguson M, O'sullivan TA. Development of a nutrition care process implementation package for hospital dietetic departments. Nutr Diet. 2015; 72:205–212.
crossref
11. Cha JA, Kim KE, Kim EM, Park MS, Park YK, Baek HJ, Lee SM, Choi SK, Seo JS. Development of job description of clinical dietitians in hospitals by the DACUM method. J Korean Diet Assoc. 2013; 19:265–286.
crossref
12. Seo JS, Kim EM, Park MS, Son JM, Woo MH, Wie KA, Lee SM, Ju DL, Cha JA. Job standards and practice toolkits for clinical nutrition therapy: diabetes mellitus·cancer·dyslipidemia. Cheongju: Ministry of Health and Welfare;2014.
13. Choi KB, Lee SM, Lyu ES. Patient perceptions of clinical nutrition service. J Korean Diet Assoc. 2012; 18:59–71.
crossref
14. Green CG. Using customer survey data to develop marketing strategies in college/university foodservices. J Coll Univ Foodserv. 1992; 1:39–51.
crossref
15. Lee JE, Kwak TK. Development and verification of indicators for a foodservice & nutrition management evaluation at a hospital nutrition department. J Korean Diet Assoc. 2009; 15:364–382.
16. Kim BG. Q·I in hospital nutrition service. Nutr Diet. 1997; 97:2–8.
17. Lee JH. Analyzing job satisfaction of hospital dietitians: based on job related factors of contracted foodservice management company [master's thesis]. Seoul: Yonsei University;2003.
18. Lee MJ, Lee YK. Effects of job characteristics, job performance and organizational commitment on job satisfaction of hospital dietitians in the Daegu Kyungpook area. Korean J Community Nutr. 2000; 5:672–682.
19. Choi J, Park E. Different perceptions of clinical nutrition services between doctors and dietitians in the Busan-Gyeongnam area. J Korean Diet Assoc. 2013; 19:69–81.
crossref
20. Ottery FD. Definition of standardized nutritional assessment and interventional pathways in oncology. Nutrition. 1996; 12:S15–S19.
crossref
21. Moon HK, Jang YJ. Analysis of the dietitian’s job description in the school. J Korean Diet Assoc. 2000; 8:143–153.
22. Kim SJ, Lim HJ, Cho YM, Lee HO, Choue RW. Present status of dietetic internship program in Korea. J Korean Diet Assoc. 2002; 8:408–414.
23. Kang JH, Jeong EH, Lee JS. Comparison study on perception of job importance, job performance, and job difficulty in clinical dietitians at small and medium hospitals in Busan. J Korean Diet Assoc. 2016; 22:26–40.
crossref
TOOLS
ORCID iDs

Young Jin Baek
https://orcid.org/http://orcid.org/0000-0002-8678-7558

Na Gyeong Oh
https://orcid.org/http://orcid.org/0000-0003-4231-1731

Cheong-Min Sohn
https://orcid.org/http://orcid.org/0000-0003-0529-7037

Mi-Hye Woo
https://orcid.org/http://orcid.org/0000-0001-7005-0570

Seung Min Lee
https://orcid.org/http://orcid.org/0000-0003-3046-8010

Dal Lae Ju
https://orcid.org/http://orcid.org/0000-0002-3251-0932

Jung-Sook Seo
https://orcid.org/http://orcid.org/0000-0001-8963-1375

Similar articles