

 PDF
PDF ePub
ePub Citation
 Print
Print


INTRODUCTION
According to the World Health Organization (WHO) report obesity incidence increased 2 folds between 1980 and 2014 worldwide [1]. Because obesity has been pointed out as a risk factor of chronic diseases such as cardiovascular disease, type II diabetes and some cancers [234] many countries adopt and execute various national policies for obesity prevention and for reducing the socio-economic burden by obesity [56]. Also there are increasing attention and interest in developing nutrition counseling program for weight control of the obese [78]. During the time in university which corresponds to the early adult period social and emotional development are completed with physical maturity and one's dietary habit is determined [9]. Especially, in Korea, students are exposed to several health risks because students get lifestyle changes to liberal patterns vs. uniform and restricted lifestyle under competitive school environment and much study loads in typical Korean high schools [10]. However, increased risk of chronic diseases due to the change of the dietary habit during university is not sufficiently acknowledged by university students. During the time in university students' obesity is considered as the first symptom to predict the risk of getting chronic diseases related to obesity in the future [11]. Therefore, it is very important to actively control obesity from the early year of university period.
Even though the cause of obesity is complicated, dietary habit or lifestyle plays an important role in developing obese conditions [1213]. To effectively cure obesity with diet management, controlling the excessive nutrient intake but also concretely instructing the knowhow of choosing right foods and desirable eating pattern are necessary [14]. To maintain the reduced body weight after weight control, it is necessary to correct the way or pattern of eating, exercise and overall lifestyle [15]. Also it is important to acquire the ability to control one's own dietary habit by continuous nutrition education and counseling.
When education or counseling is carried out for ideal weight control, applying appropriate counseling skill according to steps of personal behavior change is reported as an useful method [1617].
Therefore, in this study, systematic nutrient counseling program was carried out for the obese university students and then their anthropometric characteristics, blood indices, and the change of nutrition intake were investigated. Also, the purpose of this study is to help obese students to attain right behavior for weight control and to improve their health through the process of evaluating the effect of the nutrition counseling program on the loss of body weight and body fat.
MATERIALS AND METHODS
Study subjects and period
Participants for the nutrition counseling program were recruited by the heath management center in university campus. Among students whose age were between 20–39 years old and who registered the program by invitation, total of 28 participants were selected by the criteria checklist which distinguish steps of personal behavior change and check if a student's body mass index (BMI) was more than 25. Among applicants, students whose BMI were less than 25, who were having diabetes or hypertension during the time period of study and who were chronically taking medicine were excluded in this study by surveying the checklist to select the participant. The program was performed for 10 weeks from the early of September at 2015 to the mid of November at 2015. This study was proceeded after the approval of Institutional Review Board (IRB) for human subjects in Yeungnam University (approval number: 7002016-A-2015-32) and the study was performed after getting agreement about the participation to the program from the participants according to the guideline of IRB.
Composition of the nutrition counseling program
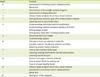
Nutrition counseling program was consisted of 30-minute nutrition counseling once a week. Nutrition counseling was performed at the scheduled day and time every week in the health management center for total 28 of obese students. Nutrition counseling program was performed according to the weekly plan showed in Table 1, and the nutrition counseling technique was differentially applied according to the investigated checklist which indicates steps of personal behavior change of students for the selection of the study participant. The results of counseling were analyzed for the remaining 24 participants after excluding the participants who showed poor attendance during the 10-week program.
Table 1
Contents of nutrition counseling program for the subjects
![]()
General characteristics and health behavior of the subjects
General characteristics and health behavior were referred to references [918], and it was composed of 6 questions about general characteristics and 8 questions about health behaviors such as drinking, smoking, exercising and sleeping status. The questionnaires were surveyed by direct writing of the participant.
Food intake of the subjects
The change of the nutrition intake was analyzed by investigating the daily status of the nutrition intake using ‘24-hour recall’ just before starting the program and at the 9th week of the program. To have the participants remember and tell what kind of food and how much they eat in a day, bowl, and food model were used. Also, the participants were instructed to write diet diary every day to educate the food intake method to the participants. The meal recorded by participants was analyzed using a nutrition analysis program (CAN-Program 4.0 for professionals; The Korean Nutrition Society, Seoul, Korea).
Evaluation of nutrient intake of the subjects
The energy and nutrient intake were evaluated according the information about the food intake followed by obtaining the subject's nutrition intake rate to the Dietary Reference Intakes for Koreans (KDRIs) and calculating the Index of Nutritional Quality (INQ) from the amount of energy and nutrient intake. INQ is the index to estimate if the amount of individual nutrient intake compared to the energy intake is relatively appropriate and it is used to evaluate the appropriateness of the meal [19].
Anthropometric parameters and blood analysis
The stature and weight of subjects were measured. Stature, weight, BMI, the amount of body fat and striated muscles, body fat percentage, circumference of the waist and hip were measured using body composition measuring instrument (Inbody 520; Biospace, Seoul, Korea) at the beginning and the 9th week of the program.
For biochemical tests 8 mL of whole blood was collected from each subject under starvation. The blood test was performed by requesting a professional blood test institute, Seoul Medical Science Institute, Seoul Clinical Laboratory (SCL). The level of aspartate transaminase (AST), alanine transaminase (ALT), gamma-glutamyl transpeptidase (γ-GTP), uric acid, total cholesterol, high-density lipoprotein (HDL) cholesterol, neutral fat, C-reactive protein (CRP), blood glucose, thyroid-stimulating hormone (TSH), hemoglobin, hematocrit (Hct), white blood cells (WBCs), red blood cells (RBCs), platelet, mean corpuscular volume (MCV), mean corpuscular hemoglobin concentration (MCHC) and the amount of insulin were analyzed. The blood test was performed at the beginning and the 9th week of the program.
Statistical analysis
Statistical analysis was performed using Statistical Analysis System (SAS, version 9.4; SAS Institute, Cary, NC, USA). All of the statistical significance was tested in the range of ɑ < 0.05. Blood test and body composition analysis were performed and the status of the food and nutrition intake was analyzed before and the 9 weeks after the program. The difference between before and after the test was compared and analyzed by Wilcoxon signed ranks test.
RESULTS
General characteristics of the subjects
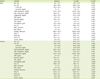
The general characteristics of the 24 subjects in this study are shown in Table 2. In gender distribution 66.7% (16 subjects) of subjects were men and 33.0% (8 subjects) of subjects were women. The average age was 23.2 years old. Fifty percent of the subjects was self-boarding, which is the highest, 29.2% was living with parents, 12.5% was living in a dormitory and 4.2% was living with relatives.
Table 2
General characteristics of the subjects

![]()
Seventy-five percent of the subjects were taking nutritional supplement and 25% of them were not. When subjects were categorized to one of the 5-step behavior change according to the level of their controlling behavior before the program, 50% of the subjects were in the pre-consideration step, consideration step or preparation step and 50% were in the action step or maintenance step, which indicates that half of the subjects were controlling weight before the program started.
Health behavior of the subjects
Health behavior of the subjects was investigated (Table 3). Regarding the frequency of drinking, 41.7% of the subjects were drinking little, 25.0% were drinking 1–3 times a month and 29.2% were drinking 1–2 times a week. Regarding the amount of drinking, 20.8% of the subjects were taking 1–2 cups, 4.2% were taking 3–4 cups, 20.8% were taking 5–6 cups, 20.8% were taking more than 7 cups, and 20.8% were taking irregular amount. When subject's smoking status was analyzed, 16.7% of the subjects were smoking, which means the majority does not smoke cigarette.
Table 3
Health behavior of the subjects

![]()
In all subjects 41.7% were exercising regularly. When the frequency of exercising was investigated, 45.8% of the subjects were not exercising, 16.7% were exercising 1–2 times a week, 25.0% were exercising 3–4 times a week and 12.5% were exercising more than 5 times a week. Regarding the length of the exercise time, 45.8% of the subjects were exercising for 0 to less than 30 minutes, which is the highest portion, and 29.2% were exercising for more than 60 minutes to less than 120 minutes.
Anthropometric parameters of the subjects
When the subjects were classified into overweight, obese and highly obese according to the BMI, the number of the subjects during the nutrition counseling program showed that there were no overweight subjects before starting the program and 58.3% of the subjects were obese and 41.7% of the subjects were highly obese (Table 4). However, the number of overweight subjects increased at the 9th week of the program while the number of obese and highly obese subjects decreased, which indicated the weight loss of the study subjects.
Table 4
Change of anthropometric parameters according to gender in subjects

Values are presented as mean ± standard deviation.
BMI, body mass index.
*Difference between baseline and final by Wilcoxon signed ranks test.
![]()
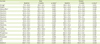
Table 4 shows the change of the physical measurement of subjects. In case of men, even though the weight, amount of body fat, and BMI decreased, differences of these parameters were not statistically significant. However, in case of women, the weight, amount of body fat and BMI decreased greatly more than those in men.
Blood index of the subjects
Table 5 shows the blood index of the subjects. When the values from men and women were compared with the reference values, they were all in the normal range. When the blood indicator change was investigated during the program, MCV and MCHC value of both men and women showed significant difference between before and after the program. MCV value of men significantly decreased from 93.4 fL to 89.9 fL (p < 0.001), and the MCV value of women also significantly decreased from 94.9 fL to 90.6 fL (p = 0.008). The men MCHC and the women MCHC value significantly increased from 32.0% to 33.2% (p < 0.001) and from 31.5% to 32.8% (p = 0.008), respectively. In addition, AST, ALT, and insulin level of men were changed significantly after the program. In case of women, hemoglobin concentration significantly increased from 12.8 g/dL to 13.7 g/dL (p = 0.008) and the RBC level also significantly increased from 4.3 Mil/uL to 4.6 Mil/uL (p = 0.008).
Table 5
Blood index of the subjects before and after the program according to gender
Values are presented as mean ± standard deviation.
AST, aspartate transaminase; ALT, alanine transaminase; γ-GTP, gamma-glutamyl transpeptidase; HDL, high-density lipoprotein; CRP, C-reactive protein; TSH, thyroid stimulating hormone; Hct, hematocrit; WBC, white blood cell; RBC, red blood cell; MCV, mean corpuscular volume; MCH, mean corpuscular hemoglobin; MCHC, mean corpuscular hemoglobin concentration.
*Difference between baseline and final by Wilcoxon signed ranks test.
![]()
Nutrition intake of the subjects
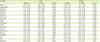
The status of nutrition intake of the subjects in the nutrition counseling program is shown in Table 6. The nutrition intake was indicated as the ratio obtained by comparing the status before and after the program with the KDRIs. The energy intake rate of men was 77.5% of the reference intake before the program and 41.2% of the reference at the 9th week of the program. When the difference by the period was investigated, there was significant difference between before the program and at the 9th week of the program (p < 0.001). Protein intake of men significantly decreased from 136.5% to 82.4% (p < 0.001). There was significant difference in nutrients intake between before the program and at the 9th week of the program (p < 0.05) except vitamin A, vitamin C, vitamin D, and vitamin B12.
Table 6
Nutrient intake of the subjects as percentage of KDRIs according to gender before and after the program
Values are presented as mean ± standard deviation.
KDRIs, Dietary Reference Intakes for Koreans.
*Difference between baseline and final by Wilcoxon signed ranks test; †Percentage of estimated average requirements; ‡Percentage of adequate intake.
![]()
In case of women, the energy intake compared to the estimated energy requirements before the program decreased from 90.8% to 51.1% at the 9th week of the program, and the change was significant (p < 0.05). Protein intake of women significantly decreased from 144.1% to 83.6% during the program (p = 0.008). The nutrients which showed significant difference between before the program and at the 9th week of the program were calorie, dietary fiber, vitamin E, vitamin C, vitamin B1, niacin, vitamin B6, calcium, phosphorus, potassium, iron, zinc, and selenium (p < 0.05).
The change of INQ according to the nutrition counseling program is presented in Table 7. When the difference in the INQ value between different genders was investigated, dietary fiber and vitamin A were significantly increased from 0.97 to 1.16 (p = 0.025) and from 1.44 to 2.40 (p = 0.018) in men, respectively. Vitamin C (p = 0.005), vitamin B6 (p = 0.001), folate (p = 0.003), phosphorus (p = 0.013), and iron (p = 0.013) also showed significant difference. Potassium significantly increased (p = 0.001) from 0.90 before the beginning of the program to 1.24 at the 9th week of the program. The INQ of women was lower than that of men overall. Vitamin C and vitamin B1 showed significant increase (p < 0.05) between before the program and at the 9th week of the program.
Table 7
Comparison of INQ of the subjects according to gender before and after the program
INQ, index of nutrition quality.
*Difference between baseline and final by Wilcoxon signed ranks test.
![]()
DISCUSSION
This study was to analyze the factors which have effect on the status of nutrient intake and on the change of physical measurements of the subjects after executing systematic nutrition counseling program to obese university students.
It is found that the residence type of the subjects showed 50.0% of self-boarding and 12.5% of dormitory-boarding. Therefore, it is supposed that cooking by oneself after leaving one's family has an effect on the occurrence of obesity. When the steps of behavioral change starting the nutrition counseling program were examined, 50.0% of the subjects were in the pre-consideration, consideration and preparation step and the remaining 50.0% were in the action and maintenance step [16]. According to Kim and Lim [17], an action-centered program named ‘Change 10 habits’ was developed. Researchers executed a personal nutrition education according to the steps of behavioral change the study subjects belong, and they found that there was a significant difference between before and after the execution of the nutrition education [17]. It seems that an effective weight loss of study subjects in this study after nutrition counseling was due to counseling technique based on the stepwise behavioral change.
When the dietary habit of the subjects was examined and the exercise status which is an important factor for obesity management along with nutrition was checked, 41.7% of the subjects were doing exercise regularly. According to the 2014 National Health Statistics, it was reported that 35.0% of men and 14.2% of women who were in the age of 19–29 years old were performing muscle exercise more than 150 minutes at medium strength, more than 2 times a week [20]. Because insufficient exercise is related to the development of obesity and make people vulnerable to various chronic diseases, obese young adults including university students should do regular exercise to increase the energy expenditure.
According to the results of the physical measurements after executing the nutrition counseling program, body weight, amount of body fat, BMI, and body fat percentage decreased in men. In case of women, weight, amount of body fat, BMI, and body fat percentage decreased more extent than those of men. According to the Kim et al.'s study [21] with obese female university students, the BMI and ratio of waist-hip circumference were significantly decreased after executing a 12-week obesity mediation program. A mediation program executed for the same length of time and conducted by Park et al. [22] also showed that there was a significant decrease in anthropometric measurement such as weight, BMI, and body fat rate after a 10-week mediation program. Even though there was no significant difference in the body measurements among men and women in this study, there was a decreasing trend in weight, amount of body fat, BMI and body fat percentage, and a slight increase of skeletal muscle. Therefore, we might expect that there would be a positive change in the body composition if the program would perform in a long-term.
The blood test showed that there was a significant difference in the MCV and MCHC level. Also, there was a significant change in hemoglobin level and a significant increase in the RBC level of the women. According to the study for an obesity counseling program for male and female university students by Yoon et al. [10], there was almost no change in the serum lipid content between before and after the program. In general, change of the serum lipid content was reported after weight loss occurred. However, various results might be due to different characteristics of the subjects, content of the nutrition counseling program and the length of program period.
To examine the status of nutrient intake of the subjects before and after the program, the ratio was obtained by comparing nutrient intake of the subjects with the KDRIs. The result showed that the nutrient intake generally decreased after the nutrition counseling program. Lee et al. [23] proposed that the good nutrition education should be performed to reduce the calorie intake and simultaneously maintain the intake of micronutrient during nutrition counseling because the intake of nutrients such as calorie, vitamins and minerals decreases after executing the nutrition education program for the weight control. Study by Park et al. [24] which showed a significant decrease in obesity degree and blood lipid level after the nutrition counseling program also emphasized the importance of the education about the caloric nutrients but also the education about the balanced intake of vitamins and minerals.
Nutrient qualitative index showed that intake of a lot of nutrients such as dietary fiber, vitamin A, vitamin C, vitamin B6, and folate significantly increased in men when the value was compared between before beginning and at the 9th week of the program. Lee et al. [25] which showed the effect of nutrition education and mediating effect of exercise on obese women reported that intakes of most nutrients such as total protein, dietary fiber, vitamin A, and calcium after the program were significantly higher than intakes before executing the mediation program.
Because only 24 subjects completed the nutrition counseling program and the length of period executed was just 10 weeks, the number of study subjects and study period was not sufficient enough to evaluate the effectiveness of the program on the personal weight control and might be main limitation of the study. However, university students participated in this study made a progress in the appropriate nutrient intake by receiving systematic nutrition counseling and education emphasizing the importance of self-control to maintain the reduced weight in the long run. We propose that practical and long-term mediation strategy of obese management based on the individual characteristics such as steps of behavioral change is required.
CONCLUSION
The 10-week nutrition counseling program performed with obese university students showed that there was a decreasing tendency in weight, amount of body fat, BMI, and body fat percentage. The blood test showed that levels of all parameters were in the normal range before and after the program. When the change of the nutrient intake to the KDRIs was examined, there was a tendency of decrease in most of the nutrients intake including proteins. However, the nutrient quality index showed increasing tendency after the program and implies that the intake of micronutrients was getting balanced simultaneously with the decrease of total calorie intake. Taken together this study suggest potential of nutrition counseling program based on steps of behavioral changes the subject belong in obese management.
 XML Download