

 PDF
PDF ePub
ePub Citation
 Print
Print


INTRODUCTION
Hemodialysis (HD) patients are exposed to protein energy malnutrition (PEM), which is a major risk and predictive factor of morbidity or mortality [1]. The prevalence of malnutrition in chronic kidney failure patients before dialysis treatment ranges from 20% to 80%, depending on the choices of population or nutritional markers. In patients undergoing continuous dialysis treatment, the malnutrition rate was reported still as up to 23%–73%. Therefore, malnutrition is a very common problem affecting HD patients [2]. Although these patients require regular nutritional assessment and consecutive personalized nutrition counseling (PNC), the limited dietitian resources and strict health insurance conditions make it difficult to implement these measures under current hospital circumstances in Korea.
In HD patients, PEM can be caused by a reduced intake of nutrients, poor appetite, or an increased protein catabolism due to metabolic acidosis, hyperparathyroidism, insulin resistance, and inflammation. In any given conditions, moderate to severe malnutrition induces a body weight loss and alterations in body composition — mainly a reduction in fat and muscle mass and an increase in total body fluids, with an increase in extracellular water (ECW) [3].
Not only the monitoring of the weight changes, but also the examination of the blood can provide general information about HD patients' nutritional status. However, the results of blood analysis results are hard to trust as they are influenced by chronic inflammation and an unstable iron status. In addition, the weight is also directly affected by the amount of fluid intake amount and the dialysis dose. In light of these limitations, bioelectrical impedance analysis (BIA) has recently been gaining attention as a simple, objective, non-invasive, and inexpensive way to evaluate HD patients' hydration status and body composition.
The goal of this study was to evaluate the effectiveness of 3 consecutive PNC sessions on the nutritional status of HD patients based on an anthropometric assessment, biochemical parameters, dietary intake, and multi-frequency BIA.
Go to : 
MATERIALS AND METHODS
Patients
The study was conducted at 2 dialysis units of university hospitals (Gangnam Severance Hospital, Yongin Severance Hospital) between July 2013 and April 2014. Clinically stable patients who had been receiving maintenance HD treatment for over 1 month were assigned to receive PNC over 3 visits: at baseline, after 3 months, and after 6 months. The exclusion criteria included patients with C-reactive protein (CRP) ≥ 50 mg/L (indicating a severe inflammation status), malignant oncology, acute renal failure, liver cirrhosis with ascites, severe pulmonary edema, New York Heart Association heart failure ≥ class III, amputated arms and legs, alcoholism, and recent surgery.
Patients at 2 dialysis units who agreed to be enrolled were included, and there were 51 patients at baseline (21 of Gangnam Severance Hospital, 30 of Yongin Severance Hospital). Among them, 9 patients were excluded over the study period (2 for exclusion criteria, 2 for transfer to another dialysis unit, 1 for refusal after enrollment, and 1 for death). Finally, 42 patients (16 of Gangnam Severance Hospital, 26 of Yongin Severance Hospital) completed the study.
The study protocol was approved by the Institutional Review Board of the Gangnam Severance Hospital (No. 3-2013-0039). All patients provided written informed consent prior to study enrollment.
Nutritional assessment
The patients' demographic data — including sex, age, HD duration (in months), and presence of comorbid diseases — were collected at baseline. Anthropometric measurements including height, weight before and after a dialysis session, body mass index (BMI, kg/m2), and handgrip strength (with the Jamar® Hydraulic Hand Dynamometer; Sammons Preston, Chicago, IL, USA) were examined. Their pre-dialysis biochemical results—including serum blood urea nitrogen (BUN, mg/dL), creatinine (mg/dL), cholesterol (mg/dL), albumin (g/dL), total iron binding capacity (TIBC, mcg/dL), hemoglobin (g/dL), potassium (mmol/L), and phosphate (mg/dL) levels were obtained from their electronic medical records.
In all patients, a BIA was carried out using Inbody S10 (InBody Co., Ltd., Seoul, Korea) in the lying position within 30 minutes after dialysis treatment. After entering the patient's height, weight, age, and gender, measurements were taken using the 4-electrode, 8-point touch electrode method by wiping the areas where the 8 electrodes would be attached (one each on the thumb and middle finger of both hands and one each on both ankles) with electrolyte tissue and connecting the holder electrode. Among BIA results, four parameters were used: the phase angle, the body cell mass (BCM), the fat-free mass (FFM), and the ECW/total body water (TBW) ratio.
A trained dietitian collected dietary record of a usual day in recent week by an interview, using food models to facilitate the recall process in order to verify the intake amount. For the nutrient analysis, the Food Exchange Unit Lists for renal disease patients (Korean Dietetic Association & Korean Society of Nephrology, 1997) were used to convert the food intake amount into basic unit numbers and into calories and proteins.
We evaluated the patients' nutritional status using the modified quantitative subjective global assessment (MQ-SGA) [4] and malnutrition-inflammation score (MIS) tools [5], which were developed specifically for renal patients by modifying the conventional SGA. MQ-SGA comprises 7 components (weight change, dietary intake, gastrointestinal symptoms, functional capacity, comorbidity, subcutaneous fat, and muscle wasting) which have 4 levels of severity, so final score is supposed to ranges from 7 (normal) to 35 (severely malnourished). MIS has 10 components, which includes 7 components the same as MQ-SGA and 3 additional components (BMI, serum albumin, and TIBC). Each has 4 levels of severity, so final score is supposed to ranges from 0 (normal) to 30 (severely malnourished). We divided the patients into two groups (adequately nourished [AN] vs. malnourished [MN]) based on MIS score of 5 points or less.
These assessment data were collected 3 times at baseline, 3rd and 6th months, except for MQ-SGA and MIS which were done 2 times at baseline and 6th month only.
Nutritional intervention
All patients received three individualized consultations over the study period, and every consultation was done by one well trained dietitian. Each consultation involved a 40- to 60-minute PNC session focusing on the adequate food intake for each patient's energy and protein needs. The recommended goals of the patient's nutritional management were to improve the nutritional status, to prevent accumulated fluid waste products, and to minimize the incidence of metabolic side effects.
Recommended protein intake for each patient was calculated as 1.2 g/kg of ideal body weight, which should be composed of > 50% of high biological value protein foods according to the National Kidney Foundation's Kidney Disease Outcomes Quality Initiative (K/DOQI) clinical practice guidelines [6]. We also calculated recommended energy intake for each patient as 30–35 kcal/kg of ideal body weight. Moreover, we suggested a daily recommended sodium intake amount below 3,000 mg, a potassium amount of 1,500–2,000 mg, and a phosphate amount of 15–17 mg/kg of ideal body weight.
The contents of the nutritional education included a focus on individual energy and protein needs, tips to restrict the intake of potassium, phosphorus, sodium, and fluid. In addition, we offered HD patients with diabetes mellitus nutritional education about blood sugar control. At the 1st session, general information of nutrition therapy and a recommended meal plan by individual requirement were given to the patients. At 2nd and 3rd session, patient's change in diet was assessed and tailored solution was suggested to achieve the adequate intake. Repeated education of nutrition therapy was done if needed. Four educational materials — Nutritional therapy for HD patients, Individual meal plan with food illustrations, caution food list, and cooking tips for low sodium intake — were developed based on Gangnam Severance Hospital's.
We evaluated whether each patient's intake was adequate based on their food habits and problems. We recorded the patient's intake and habits at every point to ensure continuous and consistent management.
Statistical analysis
The statistical analyses were performed using Stata software 13.1 (StataCorp, College Station, TX, USA). The subjects' diabetes and cardiovascular disease histories were analyzed by frequency and percentage, and all the other results were presented by mean and standard deviation. Baseline characteristics were analyzed by paired t-test to examine gender differences. To evaluate the effect of three times of nutritional intervention, paired t-tests (baseline with 3rd and 6th months, respectively) were done. In the subgroup analysis by nutritional status, the results between baseline and 6th month's were compared by paired t-test. If the p value was < 0.05, the difference was considered significant.
Go to :
RESULTS
Baseline characteristics
The baseline characteristics of the 42 HD patients are shown in Table 1. Among the 42 patients, 19 were women, and 25 had diabetes mellitus while 6 had a cardiovascular disease. The mean age of the patients was 60.8 ± 11.6 years, and their mean dialysis duration was 36.7 ± 27.8 months. The mean BMI was 22.84 ± 3.85 kg/m2, with no difference between men and women. Handgrip strength of men was higher than that of women (29.21 ± 11.39 vs. 18.33 ± 6.26, p < 0.001).
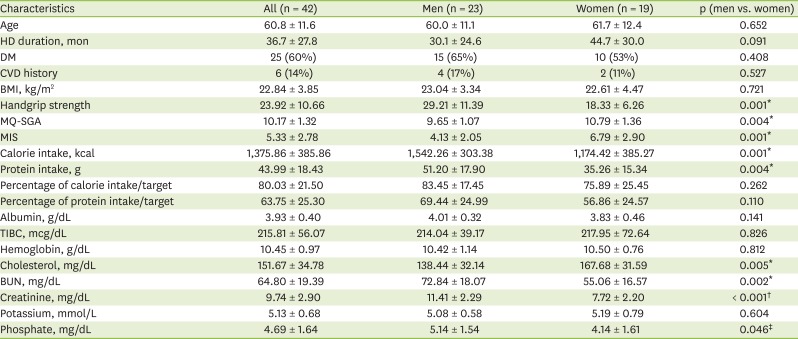
Table 1
General characteristics of the patients at baseline
CVD, cardiovascular disease; BMI, body mass index; MQ-SGA, modified quantitative subjective global assessment; MIS, malnutrition-inflammation score; TIBC, total iron binding capacity; BUN, blood urea nitrogen.
*p < 0.01, †p < 0.001, ‡p < 0.05.
![]()
The MQ-SGA score was 1.14 point lower in men than in women (9.65 ± 1.07 vs. 10.79 ± 1.36, p = 0.004), which means relatively less severity of malnutrition. MIS showed similar results to MQ-SGA score (men vs. women: 4.13 ± 2.05 vs. 6.79 ± 2.90, p = 0.001) also showing relatively less severity of malnutrition. The intake of energy and protein was significantly higher in men than in women (p < 0.050), while the calorie and protein intake per target did not vary by sex. The calorie intake rate was 80.03% ± 21.50% of the target amount and the protein intake rate was 63.75% ± 25.30% of the target amount. Therefore, both were insufficient.
Serum albumin, TIBC, hemoglobin, and potassium levels did not differ between male and female patients. However, the levels of cholesterol in male patients were significantly lower than those of female patients (138.44 ± 32.14 vs. 167.68 ± 31.59 mg/dL, p = 0.005). BUN (72.84 ± 18.07 vs. 55.06 ± 16.57 mg/dL, p = 0.002), creatinine (11.41 ± 2.29 vs. 7.72 ± 2.20 mg/dL, p < 0.001), and phosphate (5.14 ± 1.54 vs. 4.14 ± 1.61 mg/dL, p = 0.046) levels were higher in men than in women (Table 1).
Among BIA parameters, the phase angle (5.11 ± 0.82 vs. 3.91 ± 1.15, p < 0.001), BCM (32.37 ± 4.51 vs. 23.17 ± 3.73 kg, p < 0.001), and FFM (50.18 ± 6.79 vs. 36.51 ± 5.77 kg, p < 0.001) were higher in men than in women, and the ECW/TBW — i.e., the degree of edema — was significantly lower in men than in women (0.391 ± 0.010 vs. 0.401 ± 0.013, p = 0.012) (Table 2).
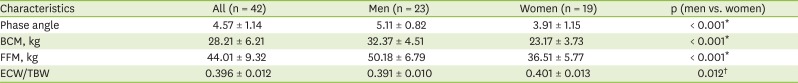
Table 2
BIA parameters of the patients at baseline
BIA, bioelectrical impedance analysis; BCM, body cell mass; FFM, fat free mass; ECW/TBW, extra cellular water/total body water.
*p < 0.001, †p < 0.05.
![]()
Comparison of nutritional parameters over time
To examine the changes in the clinical outcome with continuous nutritional counseling over time, baseline parameters were compared with the measurements at 3rd and 6th months (Tables 3 and 4).
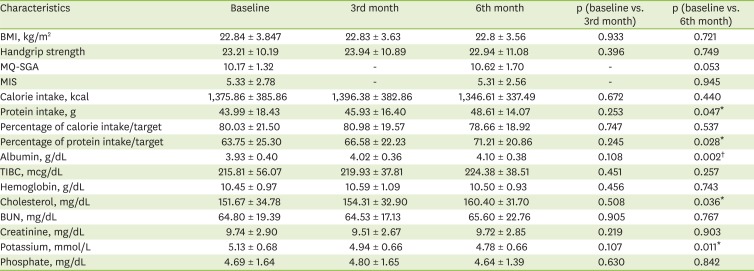
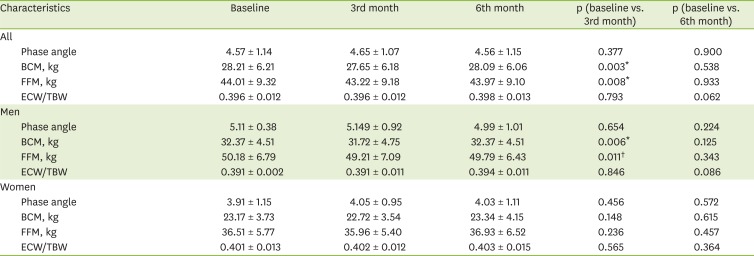
Table 3
Changes in nutritional parameters by personalized nutritional counseling over time
BMI, body mass index; MQ-SGA, modified quantitative subjective global assessment; MIS, malnutrition-inflammation score; TIBC, total iron binding capacity; BUN, blood urea nitrogen.
*p < 0.05, †p < 0.01.
![]()
Table 4
Changes in BIA parameters by personalized nutritional counseling over time
BIA, bioelectrical impedance analysis; BCM, body cell mass; FFM, fat free mass; ECW/TBW, extra cellular water/total body water.
*p < 0.01, †p < 0.05.
![]()
BMI, handgrip strength, MQ-SGA score, and MIS did not change significantly over time. The mean of the calorie intake and calorie intake per target did not change over time. The protein intake showed no difference between baseline and 3rd month, but showed a significant increase between baseline and 6th month (43.99 ± 18.43 vs. 48.61 ± 14.07 g, p = 0.047; 63.75% ± 25.30% vs. 71.21% ± 20.86% of the target intake, p = 0.028). Similarly, albumin (baseline: 3.93 ± 0.40 g/dL, 6th month: 4.10 ± 0.38 g/dL, p = 0.002) and cholesterol (baseline: 151.67 ± 34.78 mg/dL, 6th month: 160.40 ± 31.70 mg/dL, p = 0.036) levels did not differ between baseline and 3rd month, but significantly increased between baseline and 6th month. The potassium level did not differ between baseline and 3rd month, but it decreased between baseline and 6th month (5.13 ± 0.68 vs. 4.94 ± 0.66 mmol/L, p = 0.011). The other parameters did not change significantly over time (Table 3).
The BIA showed no significant change in the phase angle and the ECW/TBW ratio. The BCM (baseline: 28.21 ± 6.21 kg, 3rd month: 27.65 ± 6.18 kg, p = 0.003) and FFM (baseline: 44.01 ± 9.32 kg, 3rd month: 43.22 ± 9.18 kg, p = 0.008) showed a significant decrease at 3rd month, but recovery without a significant difference from baseline at 6th month. According to gender, the phase angle and the ECW/TBW ratio in men were not statistically significant, but the BCM (baseline: 32.37 ± 4.51, 3rd month: 31.27 ± 4.75, p = 0.006) and the FFM (baseline: 50.18 ± 6.79, 3rd month: 49.21 ± 7.09, p = 0.011) were significantly decreased at 3rd month and recovered at 6th month, similar to those in all subjects. On the other hand, women were not statistically significant in all results (Table 4).
Comparison of parameters according to initial nutritional status
The changes and significance of the AN and MN groups' parameters between baseline and 6th month were checked. There were no difference in BMI, handgrip strength, calorie and protein intake, and calorie and protein intake per target of the AN and MN groups between baseline and 6th month. Over the study period, the albumin (baseline: 3.84 ± 0.43 g/dL, 6th month: 4.15 ± 0.36 g/dL, p = 0.005) and cholesterol (baseline: 154.57 ± 34.02 mg/dL, 6th month: 169.48 ± 28.04 mg/dL, p = 0.026) levels increased in the MN group, while they did not change in the AN group. The phase angle, BCM, and FFM showed no change in both groups. However, the ECW/TBW ratio significantly increased from 0.389 ± 0.010 at baseline to 0.392 ± 0.012 at 6th months in the MN group (p = 0.036) (Table 5).
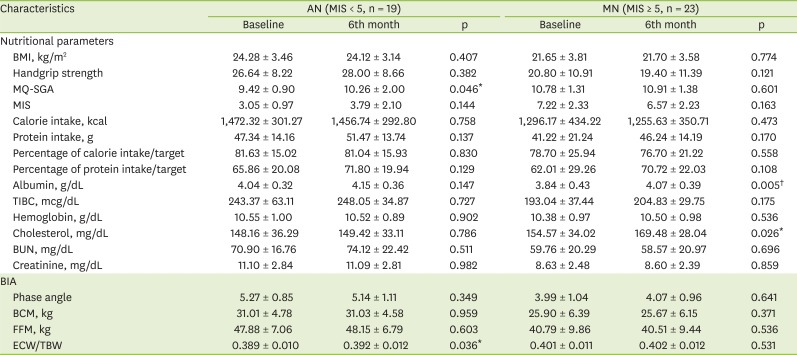
Table 5
Changes in parameters by personalized nutritional counseling in subgroup analysis by nutritional status
AN, adequate nourished; MN, malnourished; BMI, body mass index; MQ-SGA, modified quantitative subjective global assessment; MIS, malnutrition-inflammation score; TIBC, total iron binding capacity; BUN, blood urea nitrogen; BIA, bioelectrical impedance analysis; BCM, body cell mass; FFM, fat free mass; ECW/TBW, extra cellular water/total body water.
*p < 0.05, †p < 0.01.
![]()
Go to :
DISCUSSION
This study used not only biochemical data, but also dietary intake, body composition analysis, and malnutrition scoring tools to assess the patients’ malnutrition more closely and objectively. As there is no single measure to provide a comprehensive assessment of the nutritional status of HD patients, the optimal monitoring methods and tools have long been debated. For a comprehensive overview of the nutritional status of dialysis patients, subjective global assessment (SGA) is recommended. Moreover, some modified scoring measures are suggested according to the patients’ characteristics [457]. In addition, dual-energy X-ray absorptiometry (DEXA) is suggested as an assessment tool for dialysis patients, as it reflects the muscle mass and body composition accurately [8]. The Dialysis Outcomes and Practice Patterns Study (DOPPS) — a prospective longitudinal study that included nutritional factors affecting HD patients — formed the basis for the National Kidney Foundation's K/DOQI guideline. This guideline recommended a combination of valid, complementary measures — including the calorie and protein intake, visceral protein, muscle mass, the body composition, and functional status — rather than a single measure for nutritional assessment [6]. Since then, there has been a European consensus that routine nutritional assessment should involve multiple clinical data, including the weight loss history, BMI, muscle mass, subcutaneous fat mass, and the serum albumin, creatinine, and cholesterol levels [1]. The fact that the BMI does not seem to be a reliable marker of protein-energy malnutrition also supports the necessity of combined measures for nutritional assessment [9].
In particular, this study assessed the patient's body composition by BIA. BIA has become widely known as a nutritional assessment tool that can be used to analyze the body composition and body water in a simple, objective, painless, and non-invasive way and at a low cost [10111213]. A recent study suggested that the total body fat and lean body mass measured by DEXA and BIA were highly correlated in HD patients, proving BIA's usefulness [14]. As multi-frequency BIA is more appropriate than single-frequency BIA for estimating the muscle mass of HD patients [3], this study used multi-frequency impedance by measuring 5 different frequencies. Among BIA measurements, the phase angle is a factor that reflects cell integrity and is related to the nutritional status and the survival rate [15]. Chertow et al. [12] divided over 3,000 hemodialysis patients into phase angle quintiles, and found that patients in the lowest phase angle group had a 1.5 higher relative risk of mortality than patients in the highest phase angle group independently of their age, sex, race, diabetes status, serum albumin and creatinine levels. According to Pupim and Ikizler [8], the phase angle has also been found to correlate positively with the muscle mass and strength, and to be associated with a higher risk of death in chronic HD patients. As another BIA measurement, the FFM includes the skeleton, skin, muscle, visceral organs, and total body water, only excluding the fat mass. The BCM can be useful as an indicator of the muscle mass and nutritional status, as it excludes the bone mineral mass and extracellular water from the FFM; therefore, it can represent the most metabolically active components in HD patients, who are vulnerable to fluid accumulation [16]. On these bases, this study used the phase angle, the BCM, and the FFM. Moreover, the edema status is an important malnutrition diagnosis factor. Therefore, the ECW/TBW ratio was also used to analyze the nutritional status.
Intensive nutritional counseling is an essential recommendation for all HD patients. The nutritional care plan should be updated at least every 3–4 months, and nutritional counseling should be provided every 1–2 months (and more frequently in patients suffering from malnutrition). In particular, dietary intervention is needed to meet the patient's energy and protein requirements, as there is a risk of protein-energy malnutrition [6]. In their review of the effects of the nutritional support for chronic HD patients, Bossola et al. [17] concluded that oral nutritional supplements (ONSs) could improve the serum albumin and other nutritional parameters, and that intradialytic parenteral nutrition improved the serum albumin levels and body weight [17]. Recently, nutritional counseling and support designed to increase the calorie intake through artificial nutrition were shown to improve the nutritional status and to reduce the risk of morbidity and mortality in anorexic patients [18].
A study on the effects of PNC on HD patients suggested that patients in the nutritional counseling group showed more improved serum albumin levels than those who received ONSs [19]. In addition, the diagnosis of individual nutritional problems and personal nutritional counseling were reported to be effective in improving the serum albumin levels [20]. A study found that nutritional counseling significantly increased the normalized protein catabolic rate and serum albumin level, reaching the target level [21]. In this study, nutritional counseling and the intervention of dietitians improved the protein intake rather than increasing the intake directly through nutritional supplements. It must be noted that these results were concurrent with improvements in the biochemical indicators. As the serum albumin level is an index that is closely related to the nutritional status and the mortality when excluding inflammation [6], the results of this study suggest an improvement in the nutritional status and clinical outcome. In addition, patients with low cholesterol levels (below 150–180 mg/dL) may be suspected of malnutrition [6]. Therefore, it is also significant that the serum cholesterol increased from 151.67 ± 34.78 mg/dL at baseline to 160.40 ± 31.70 mg/dL at 6 months (p = 0.036). This is consistent with the findings of studies that increased the calorie and protein intake through nutritional support [17], and of those that evaluated the effectiveness of nutritional counseling [20]. The serum potassium levels at 6 months were significantly reduced. This may be considered an improvement of the clinical outcomes; however, it is difficult to attribute this effect solely to nutritional counseling, as it may also have been influenced by the medication treatment.
Due to the continuous protein loss from dialysis, HD patients are easily exposed to body mass wasting without a sufficient protein intake. This study found that the BCM and FFM had significantly decreased from baseline at 3 months, showing a different trend from the protein intake, serum albumin, and cholesterol levels. However, the BCM and FFM at 6 months had recovered, showing no significant difference from the baseline. This suggests that continuous nutrition counseling over the entire study period delayed the wasting of the body composition.
Although the MQ-SGA and MIS were developed by the same authors, the MIS is relatively more recent, and it is known to evaluate patient's prognosis and nutritional status more accurately by adding three items to the MQ-SGA [5]. This study therefore used the MIS to divide patients into 2 groups (1 with a relatively good [AN] and 1 with a relatively bad nutritional status [MN]) at the outset. As a result, the serum albumin did not change significantly in the AN group, while it significantly improved in the MN group. Therefore, nutritional counseling and an increased protein intake can be considered to have a greater effect on the nutritional status of patients with a poor nutritional status than on that of patients with a relatively good nutritional status. Patients suffering from malnutrition should receive nutritional care as early as possible to improve their prognosis, and it is important to improve their intake through continuous management for at least 6 months.
This study only included patients who received nutritional management. As there was no control group of patients who did not receive nutritional counseling, it was difficult to evaluate the effect accurately. The small number of patients was also a limitation. To evaluate the effect of nutritional counseling more objectively, studies including a control group that is not receiving nutritional counseling, and studies involving a larger number of patients are needed.
In addition, this study was conducted over a relatively short period of 6 months. Therefore, further research is needed to assess the effects of long-term nutritional counseling and malnutrition management on changes in the body composition.
Patients' comorbidities, deconditioning, and gastrointestinal-related symptoms (nausea, vomiting, constipation, etc.) may affect their intake. Therefore, these factors must be taken into account to assess the relationship between each factor and the intake level, and thereby the nutritional status.
In this study, 3 nutritional counseling sessions were provided over 6 months; however, it was difficult to confirm recovery from malnutrition. Moreover, no significant improvement in the nutritional status was observed on the 3rd month. In patients with severe malnutrition, intensive nutritional management is required within short intervals of 1 month. This suggests a need for further research into closer and more intensive nutritional care.
Go to :
CONCLUSION
After 3 continuous, individualized nutritional counseling sessions, there was no significant change in the HD patients' dietary intake and biochemical data at 3 months. However, the protein intake, serum albumin, and cholesterol levels had improved at 6 months. Among the BIA results, there was a significant reduction in the BCM and FFM at 3 months, although they had recovered without a significant difference from baseline at 6 months. The wasting of the body composition was found to be delayed. There was a significant improvement in the serum albumin and cholesterol levels of patients affected by malnutrition. Therefore, continuous nutritional management for at least 6 months is considered to contribute to the improvement of HD patients' nutritional status. As the benefits of nutritional management are particularly significant in patients with severe malnutrition, screening for malnutrition and the early initiation of nutritional management are required.
Go to :
 XML Download