

 PDF
PDF ePub
ePub Citation
 Print
Print


INTRODUCTION
Pursuing an adequate maternal nutritional status during pregnancy is crucial in order to optimize maternal, fetal, and neonatal health [1]. The maternal components contribute about 65% and the products of conception contribute about 35% of total gestational weight gain [2]. Generally, the mother gains fat (3.3–4.1 kg) and body water (6.0–7.0 kg), while increases in fat-free mass are primarily due to the uterus, placenta, and fetus [3].
Maternal nutritional status during pregnancy is associated with pregnancy outcomes. Recommendations for maternal weight gain during pregnancy differ for different categories of body mass index (BMI, kg/m2), with lower weight gain recommended for women who are overweight and obese [2]. For women of normal pre-pregnancy BMI (in kg/m2; 18.5 ≤ BMI < 25.0), the recommended range of total weight gain is 11.5–16.0 kg, whereas for underweight (BMI < 18.5 kg/m2), overweight (25.0 ≤ BMI < 30.0 kg/m2), and obese (30.0 kg/m2 ≤ BMI) women, ranges are 12.5–18.0 kg, 7.0–11.5 kg, and 5.0–9.0 kg, respectively [2]. There is a positive correlation between maternal blood glucose levels and birth size [4]. And dietary glycemic load played a role for excessive gestational weight gain [5]. Maternal pre-pregnancy BMI and gestational weight gain were positively and independently associated with neonatal adiposity [6]. The prospective study reported that a maternal dietary intake is associated with early childhood weight patterns [7]. Also the study showed positive correlations between maternal vitamin C status and birth weight [8]. Birth size was strongly associated with the consumption of milk at week 32 and of green leafy vegetables and fruits at week 32 of gestation [9]. It is well established that periconceptional folic acid supplementation reduces the risk of neural tube defects [10]. Poor nutrition also has adverse effects on the pregnancy outcome. The purpose of our study was to examine the maternal dietary intake during third trimester of pregnancy and investigate the relationship between maternal nutrition and pregnancy outcome.
MATERIALS AND METHODS
Subjects
Seventy-five women (aged 25–40 years) giving birth to term infants at 2 months postpartum were recruited as part of a community-based residing in Daegu. None of the women studied reported consuming alcohol and cigarettes at any time during their pregnancy. Women completed a demographic questionnaire. Information was obtained on maternal age and self-reported height and pre-pregnancy weights, education level and household income. Weight at birth (kg), length at birth (cm), ponderal index (kg/m3), and gestational were collected. Weight gain during pregnancy of the participants was classified in 3 groups by gestational weight gain recommendations [2]: within the normal (11.5–15.0 kg), lower than recommended, and over than the recommended. The study was approved by the institutional review board (IRB) of the Keimyung University (40525-201506-BR-46-03) and written informed consent was obtained from all women.
Dietary assessment
Participants completed a 106-item semi-quantitative food-frequency questionnaire (SQFFQ) [11]. Participants were asked to report the frequency of consumption of specific foods and beverages in the period between 28 and 42 weeks' gestation. For each item the frequency was recorded in times per day, week, or month. The women were asked to estimate portions and quantities based on pictures, food models, and measuring tools such as cups or teaspoons.
Statistical analysis
Data were analyzed using SAS version 9.3 (SAS Institute, Cary, NC, USA). Significant differences were defined as p < 0.05. Student's t-test was used to determine significant differences between income levels or job status and significant differences comparing three gestational weight gain groups were analyzed by one-way analysis of variance (ANOVA) and Duncan's multiple range test.
RESULTS
Maternal characteristics were summarized according to weight gain during pregnancy. Self-reported participant demographic and physical characteristic data are shown in Table 1. As per the recommendations of the institute of medicine (IOM) recommendation [2], women who gained below the recommended weight gain during pregnancy, within, and over were 25.3%, 38.7%, 36.0%, respectively. Women with a gestational weight gain above the recommendations had 18.2 ± 2.5 kg, about 3.2 kg more weight. Women with a gestational weight gain below the guidelines had 9.7 ± 1.3 kg, about 3.0 kg less weight. On average, the pregnant women in the three groups (low, recommend, and over) were 31.7 ± 2.9, 33.0 ± 3.3, 32.3 ± 3.5 year of age respectively. And pre-pregnancy BMI in three groups (low, recommend, and over) were 21.8 ± 2.7 kg/m2, 20.4 ± 1.7 kg/m2, 20.40 ± 1.79 kg/m2, respectively.
Table 1
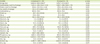
Maternal characteristics and energy intake by gestational weight gain

Data are presented as mean ± standard deviation.
BMI, body mass index.
*,†Values with different superscripts within the row are significantly different at p < 0.05 by Duncan's multiple range test; ‡Percent of Dietary reference intakes for Koreans 2015 [14].
![]()
Maternal daily energy intake in low gain group was 2,395 ± 813 kcal, percentage of energy from protein was 14.5% ± 3.0%, percentage of energy from fat was 21.6% ± 6.7%, and percentage of energy from carbohydrates was 63.0% ± 8.5%. Maternal daily energy intake in recommended gain group was 1,940 ± 710 kcal, percentage of energy from protein was 14.6% ± 2.5%, percentage of energy from fat was 19.3% ± 6.8%, and percentage of energy from carbohydrates was 64.9% ± 8.5%. Maternal daily energy intake in over gain group was 2,423 ± 782 kcal, percentage of energy from protein was 13.7% ± 2.7%, percentage of energy from fat was 19.6% ± 5.7%, and percentage of energy from carbohydrates was 65.7% ± 7.3%. There were no meaningful differences among nutrient intake by weight gain subgroup, except energy intake. The mean ± standard deviation (SD) intake of carbohydrates was 355.5 ± 115.9 g/day in gestation week 28–36. Participants with lower energy intake tended to have a lower pre-pregnancy BMI.
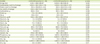
Educational level and household income per month of the subjects are shown in Table 2. Ninety-five percent of the subjects hold a college degree. Over 3,000,000 won for household income is 52.0%, full time employed status is 19.9%.
Table 2
Educational level, household income, and occupational status of the subjects

![]()
Infant birth characteristics are shown in Table 3. Birth weights for lower than recommend, recommend, over than recommend group were 3.14 ± 0.32 kg, 3.23 ± 0.38 kg, 3.35 ± 0.34 kg, respectively, results did not differ by groups. Mean gestational age at birth were 275.5 ± 16.7 days, 273.9 ± 14.9 days, 279.2 ± 4.5 days, respectively, and results did not differ by groups. Birth length for lower than recommend, recommend, over than recommend group were 49.5 ± 1.8 cm, 50.2 ± 1.8 cm, 50.9 ± 1.9 cm, respectively, and lower group was significantly shorter than other groups (p < 0.05). Ponderal index (kg/m3) for lower than recommend, recommend, over than recommend group were 28.6 ± 28.5 kg/m3, 26.6 ± 34.6 kg/m3, 26.4 ± 32.1 kg/m3 respectively, and lower than recommend group was significantly higher than other groups (p < 0.05). The difference of mean ponderal index was 8.3% when the offspring of mothers with a weight gain in the lower group was compared with the offspring of mothers with a weight gain in the both recommend group and higher group (p < 0.05).
Table 3
Infant characteristics by gestational weight gain

Data are presented as mean ± standard deviation.
*,†Values with different superscripts within the row are significantly different at p < 0.05 by Duncan's multiple range test.
![]()
The mother and infant characteristics by employed status are presented in Table 4. Gestational period for unemployed and employed group were 275.7 ± 14.2 days, 276.9 ± 4.5 days, respectively, and unemployed group had a significant lower gestational period than employed groups (p < 0.05).
Table 4
The characteristics of mother and infant by employment status

![]()
Ponderal index (kg/m3) for unemployed and employed group were 25.5 ± 27.2 kg/m3, 25.7 ± 13.5 kg/m3, respectively, and unemployed group had a significant lower gestational period than employed groups (p < 0.05).
The dietary intake of participants during 28–42 weeks of gestation by employed status is presented in Table 5. Total energy intake was significantly higher in unemployed group than in employed group. Both groups had a similar carbohydrate and fat intake as a percentage of total energy and employed group had a lower protein intake than the unemployed group (p < 0.05). In the employed group, energy and protein intake were low, also the intakes of vitamin B2 (1.0 ± 0.3 mg), niacin (14.1 ± 5.3 mg), vitamin C (76.4 ± 46.0 mg), calcium (511.3 ± 183.3 mg), and potassium (1,939.0 ± 809.0 mg) were significantly lower at employed group.
Table 5
Nutrient intake pregnancy women by employment status
Data are presented as mean ± standard deviation.
*Percent of Dietary reference intakes for Koreans 2015 [14].
![]()
The mother and infant characteristics by monthly household income per month are presented in Table 6. Almost one-half of the participants were more than 3,000,000 won per month household income level. Gestational period for low income and high income groups were 276.5 ± 12.7 days, 275.5 ± 13.1 days, respectively. Ponderal index (kg/m3) for low income and high income groups were 25.9 ± 22.7 kg/m3, 25.2 ± 26.7 kg/m3, respectively. We did not observe any significant differences between household incomes.
Table 6
Infant characteristics by household income

![]()
The dietary intake of participants during 28–42 weeks of gestation by income status is presented in Table 7. Dietary intakes of energy, carbohydrate, fat, and protein did not differ between high income and low income group. Similarly, there were no significant differences between the mineral and vitamin intakes in high income and low income, with the exceptions of iron and folic acid (p < 0.05). These data are similar to those of the Ministry of Food and Drug Safety survey: Ministry of Food and Drug Safety which reported 58.8% for Dietary reference intakes for Koreans (KDRIs) in iron intake in pregnancy women [12]. Using the estimated average requirement (EAR) cutoff, 65.0% and 70.0% of our study participants did not meet their requirements of iron and folic acid through diet alone during late pregnancy, respectively [13].
Table 7
Nutrient intake pregnancy women by household income
Data are presented as mean ± standard deviation.
*Percent of Dietary reference intakes for Koreans 2015 [14].
![]()
At the point of income group, the intakes of vitamin B2, niacin, and vitamin C were significantly lower at low income group. Almost all the study subjects had dietary intakes of folic acid and iron less than the EAR 520 μg DFE/day and 19 mg/day, respectively [14]. So without supplements, these women could not have appropriate quantities of folic acid and iron recommendations.
DISCUSSION
Maternal diet during pregnancy is an important factor and identifying nutrition status necessary for reducing possible adverse pregnancy outcomes. Maternal pre-pregnancy BMI and gestational weight gain were positively and independently associated with neonatal adiposity [14].
The dietary intake data were checked in person by dietitians to ensure completeness. In comparison to the KDRIs recommended estimated energy requirements (EER) for energy during the third trimester (28–42 weeks), gestational weight gain recommended group was about 18.0% lower than KDRIs [14]. A previous study showed that energy intake decreased in the third trimester, and most women did not meet the national recommended amounts for iron and folic acid from food sources alone [15].
Another recent study reported that 47% of women had excessive gestational weight gain, 32% of women gained within the guidelines (the IOM recommendation), and 21% of women had inadequate gestational weight gain in the United States [16]. When compared to the US population, our study shows that excessive gestational weight gain ratio is higher in US population than in Korean population that we investigated. High gestation weight gain is positively associated with postpartum weight retention [17].
Fetal growth depends on the uptake of nutrients, which occurs at the end of a complex maternal supply line that begins with the mother's intake [18]. The majority of placental growth is completed by the end of the second trimester, preceding the large third trimester increases in fetal weight [19]. Overweight and obese women have a higher risk of Caesarean delivery [20], and increase risk of preterm delivery [21]. Higher maternal weight is independently associated with higher birth weight in developing country [22]. Maternal macro nutrient intake during pregnancy was not associated with infant birth weight [23].
The majority of placental growth is completed by the end of the second trimester, preceding the large third trimester (28–42 weeks) increases in fetal weight [19]. Fetal growth depends on the uptake of nutrients, which occurs at the end of a complex maternal supply line that begins with the mother's intake appetite, diet, absorption [18]. Maternal nutrition is thus one of the critical factors influencing fetal growth and eventual birth size [24]. We also observed that higher carbohydrate during 28–42 weeks of gestation was associated with a higher ponderal index.
During pregnancy, a lower carbohydrate intake at moderate levels in late gestation is associated with a lower fat mass in their offspring at birth [25]. However, in late gestation, maternal intake of carbohydrates was relatively strongly associated with the offspring's length. Studies suggest that protein intake during pregnancy is associated with shorter infant birth length or does not increase fetal length [26]. The current EAR and DRIs recommendations of 0.88 g/kg and 1.1 g/kg, respectively, are for all stages of pregnancy in US [27]. But the current EAR for protein is 52 g/day for second trimester, 65 g/day for third trimester, DRI is 65 g/day for second trimester, and 80 g/day for third trimester in pregnancy women in Korea [14]
The maternal protein intake is affected differently by gender. Lower maternal protein intake was significantly associated with longer birth length and lower ponderal index in male but not female offspring [23]. Lower protein and higher carbohydrate intake during late pregnancy were associated with thinness at birth, characterized by a lower ponderal index in a study conducted in the United Kingdom [28]. Energy and nutrient intakes are associated with gestational weight gain [29]. Also anemia during pregnancy is a leading nutritional disorder with serious short-term and long-term consequences for both the mother and the fetus. Women of childbearing age and during pregnancy are advised to consume 400 μg/day of folic acid from fortified foods or from a supplement in addition to folic acid-rich foods to help reduce the risk of neural tube defect [30]. Folic acid is essential in the synthesis of purine and the building blocks of DNA [31]. We did not observe a significant association between folic acid intake and birth weight, this is the similar results with the previous study [32]. In addition, folic acid and vitamin B12 are required for the conversion of homocysteine to methionine [33]. No association was observed between vitamin B6 intake and duration of gestation in Korean women [34]. Vitamin B12 and birth weight is not associated in most previous studies [3536].
Specifically, diets high in sodium and low in potassium in during pregnancy can produce hypertension in pregnancy [37]. In the present study, the women consumed sodium 2,300 mg/day through diet. This is surprising, because the average consumption of sodium in Korea is around 4,600 mg among middle aged women [38]. A number confirmed by a study conducted by the Korea Ministry of Food and Drug Safety (KFDA) for pregnant women through diet alone; which is a 50% reduction of sodium intake. The reason of such difference in sodium intake could be associated to the education level of participants in this study (95% of participants have a college degree) compared with that obtained nationally, where, e.g. 30.5% of 30 or more ages adult hold a college degree [38]. While the adequate intake (AI) level for potassium is 3,500 mg/day during pregnancy [14], our participants consumed an average of 2,500 mg/day, which corresponded to 71 percentile of potassium intake in late pregnancy. This indicates that the majority of the participants had dietary potassium intakes below the AI level.
The World Health Organization (WHO) issued a strong recommendation that pregnant women be provided calcium supplements to prevent preeclampsia. Specifically, lower in vitamin C and calcium is very harmful for bone health both maternal and fetus [39]. The participants in the present study did not meet KDRIs for many important micronutrients, such as folic acid, iron, calcium, and potassium. Also, vitamin D data were not available, it is very important nutrient with vitamin C and protein for bone health. Adequate folic acid and iron intake during pregnancy is critical for maternal and fetal health [30]. Further investigations are recommended in order to know the reasons for low iron and folic acid intake in late pregnancy in Korean women. This present study encourages nutrition education for a more balanced diet that will provide pregnant women with folic acid, iron, potassium, and calcium.
There are a few limitations in this study. Although the food-frequency questionnaire (FFQ) are valid and reliable instruments to assess dietary intake [40], it is not absolute accurate. We ascertained diet at 28–42 weeks of gestation. Previous research suggests that there are minimal changes in dietary patterns during pregnancy from preconception [41]. Participants were asked to recall dietary intake between 28 and 42 weeks' gestation in late pregnancy, it is possible that the habitual intake could influence reports. Also the current study pregnancy women cannot be regarded as representative.
CONCLUSION
Greater gestational weight gain during pregnancy is associated with an increased birth length in infant. And gestational weight gain is greater in women with small pre-pregnancy BMI. Job status is affected nutrient intake and pondral index in pregnancy women and infant. This group of women was severe folic acid and iron deficient, mildly-to-moderately calcium deficient during pregnancy. These nutrients should be concern for pregnant women. Our data emphasize the importance of eating a balanced diet from all food groups in order to obtain essential nutrients from diet.
 XML Download