

 PDF
PDF ePub
ePub Citation
 Print
Print


INTRODUCTION
MATERIALS AND METHODS
Study subject and period
Data collection and preprocessing
Analysis method
1) Keyword frequency analysis
2) N-gram analysis
3) Keyword network analysis
RESULT
Keyword frequency analysis
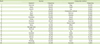
Table 1
The frequency of diet keywords for human and companion animal related to the diet by simple frequency analysis in 2016
![]()
N-gram analysis
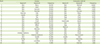
Table 2
The frequency of diet keywords for human and companion animal related to the diet by N-gram analysis in 2016
![]()
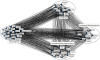
Keyword network analysis

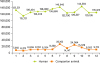
Seasonality analysis
DISCUSSION
CONCLUSION
The keyword that appeared the most in human through keyword frequency analysis was ‘exercise’ with 191,032 counts, and it was ‘dog’ in companion animals with 41,629 counts. The keyword ‘menu’ was shown high in human with 79,675 counts and the keyword ‘feed’ was shown high in companion animals with 31,068 counts.
In N-gram analysis that analyzed the link frequency between keywords, keywords related to eating were shown in order of diet-menu (59,376 counts), diet-tea (23,261 counts), diet-food (22,956 counts), and diet-lunchbox (12,138 counts) for human. For companion animals, keywords were shown in order of diet-feed (5,989 counts), diet-menu (2,472 counts), dog-feed (2,194 counts), cat-feed (2,152 counts), homemade-snack (2,118 counts), and diet-food (1,592 counts). The result related to diet-exercise in human (33,363 counts) and diet-exercise in companion animals (1,482 counts) was shown low frequency compared to eating. Thus, it was confirmed that human beings and companion animals both prefer diet over exercise.
As a result of conducting keyword network analysis that grouped keywords associated with a diet with similar characteristics, humans were classified into a total of 4 groups and companion animals were classified into a total of 3 groups. The food group and the exercise group were commonly shown in both human and companion animals, but human had the commercial diet program group and the commercial diet food group whereas companion animals had the professional medical support group.
The seasonality analysis showed that human and companion animals shared similar graphs. The starting time of diets in human and companion animals were similar, but human's diets were significantly affected by mass media and trend as in January and October.
 XML Download