

 PDF
PDF ePub
ePub Citation
 Print
Print


INTRODUCTION
Prostate cancer is the second most common cancer in men worldwide, with a standardized incidence rate of 31.1 per 100,000 men, accounting for 15% of cancers diagnosed in men in 2012 [1]. More developed countries had a higher incidence rate of 69.5 per 100,000 men but less developed area had a lower incidence of 14.5 per 100,000 men [1]. The higher incidence in developed countries, especially Australia/New Zealand, North America, and Western/Northern Europe, is speculated to be a consequence of prostate specific antigen (PSA) screening test and subsequent biopsy [12]. However, other exogenous factors (e.g., lifestyle, environment, and diet) and intrinsic factors (e.g., age, race, and family history) might also be involved in prostate carcinogenesis [34].
Previous studies regarding individual dietary constituents, such as food and nutrient intake, showed limited and conflicting results on the risk of prostate cancer [5]. This tendency was consistent with the recent 2014 Continuous Update Project (CUP) of prostate cancer published by the World Cancer Research Fund International/American Institute for Cancer Research (WCRF/AICR), which took diverse researches together and analyzed them through a systemic review [6]. In this report, the evidence of all individual dietary factors was limited, downgrading from 2007 WCRF/AICR second expert report [67]. Moreover, nutrients are virtually never consumed alone, and therefore it is insufficient for individual dietary components to address the complex inter-correlation within multiple food constituents [8]. For this reason, evaluation of whole foods through a dietary pattern analysis can account for the complexity of nutrient interactions within foods, which can contribute to alterations in metabolism [89].
Generally, there are two kinds of dietary patterns: exploratory or a posteriori dietary patterns, which define pattern groups based on generating the food consumption patterns of the study population (e.g., factor analysis, cluster analysis, and principle component analysis), and hypothesis-driven or a priori dietary patterns, which derive pattern groups based on existing evidence through dietary guidelines, such as indices or scores (e.g., Mediterranean Diet Score [MDS], Healthy Eating Index [HEI], and Dietary Inflammatory Index [DII]) [1011]. A systematic review and meta-analysis examining the relationship between a posteriori dietary patterns and prostate cancer risk have been published to date [12], whereas the review of synthetic a priori dietary indices have not yet been investigated. Only a short review of four studies on MDS has been conducted [13]. Therefore, the purpose of this study was to review the association between diverse types of a priori dietary pattern indices and prostate cancer risk.
MATERIALS AND METHODS
The article search was conducted in the PubMed database for studies published between January 1, 1997 and March 31, 2017. The search terms were as follows: (“Prostate Cancer”) AND (“Dietary Pattern” OR “Eating pattern” OR “Food pattern” OR “Dietary habit” OR “Diet score” OR “Dietary index” OR “Mediterranean Diet” OR “MDS” OR “mMDS” OR “aMDS” OR “Healthy Eating Index” OR “HEI” OR “a-HEI” OR “HEI-2010” OR “Dietary Inflammatory Index” OR “DII” OR “Nordic Nutrition Recommendations” OR “NNR” OR “Oxidative Balance Score” OR “OBS” OR “Oxidative Stress Score” OR “OSS”). The keywords are based on preceding searches of a priori dietary pattern indices of prostate cancer risk.
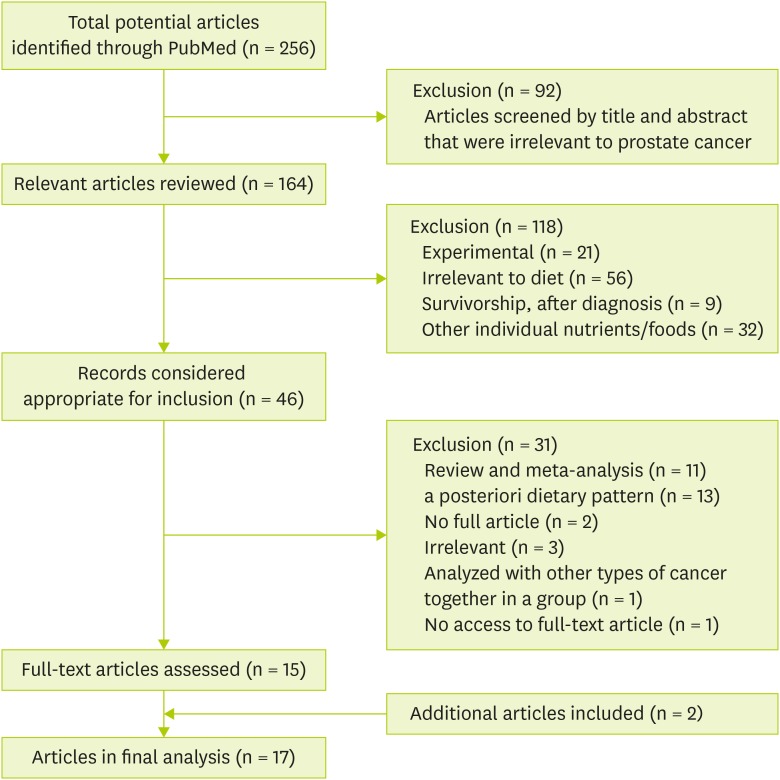
A total of 256 articles were identified, followed by the screening of the title and abstract. Those articles that were irrelevant to prostate cancer were excluded (n = 92), while articles relevant to prostate cancer remained (n = 164). Of those remaining 164 articles, 118 articles were additionally excluded by the following factors in sequence: 1) experimental studies (both in vivo and in vitro) (n = 21), 2) studies irrelevant to diet (n = 56), 3) studies on survivorship or after diagnosis with prostate cancer (n = 9), and 4) studies on individual nutrients and foods (n = 32).
A total of 46 articles were considered relevant according to dietary patterns or indices. Among these articles, 31 were excluded by the following factors: 1) review or meta-analysis (n = 11), 2) a posteriori dietary pattern analysis (n = 2), 3) irrelevant articles (n = 3), 4) cancer risk analyzed with other cancer types together as a group (n = 1), and 5) no access to the full-text article (n = 1). Of those 15 original articles selected, through screening the references, two additional articles were included, and 17 eligible epidemiological studies (7 case-control studies, 1 nested case-control study, 7 prospective cohorts, and 2 case-cohorts) about a priori dietary pattern indices were ultimately selected: MDS, DII, Oxidative Balance Score (OBS) or Oxidative Stress Score (OSS), Nordic Nutrition Recommendations (NNR), HEI, Low Carbohydrate, High Protein Diet (LCHP) score, WCRF/AICR Recommendations Index, Prostate Cancer Dietary Index Score, and Food Standards Agency Nutrition Profiling System Dietary Index (FSA-NPS DI) (Figure 1).
MDS
The traditional MDS is mainly composed of abundant plant foods (vegetables, legumes, fruits, nuts, and cereals); high intake of olive oil but low intake of saturated fat; moderately high intake of fish; low to moderate consumption of milk and dairy products, mostly in the form of cheese or yogurt; low consumption of red meat and poultry; and moderate consumption of alcohol, mainly red wine [14]. Each of the Mediterranean diet recommendations were scored as 1 (great adherence) or 0 point (low adherence), with equal-weights given, which were added together as the final MDS, ranging from 0–9 points [14]. Several modified versions of the MDS have been developed and utilized in epidemiological studies with diverse health outcomes in both Mediterranean and non-Mediterranean populations [15].
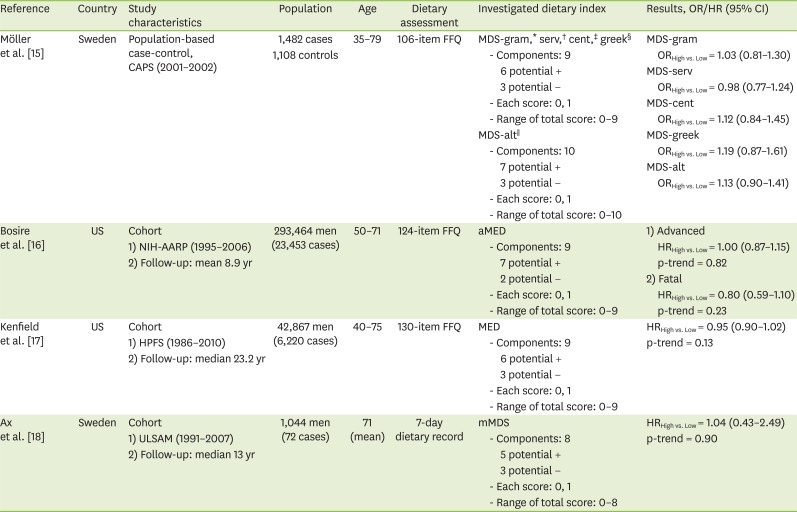
Table 1 describes a case-control study and three prospective cohort studies that have been conducted to find the association between Mediterranean diet and the risk of prostate cancer [15161718]. A case-control study in Sweden used modified-MDS indices by setting different measures (gram/day, servings/week), different cut-off values (median or 25th/75th centile), different index populations (Swedish, Greek), and replacing the food components, from fat ratio of monounsaturated fatty acids (MUFA)/saturated fatty acids (SFA) to olive oil only; from cereal to whole grain; from meat to red/processed meat only; from alcohol to red wine only; and separating fruits and nuts which were previously combined [15]. However, all of those 5 modified indices were non-significant [15]. Another Swedish study in a cohort model also found no association, even though they modified the MDS by considering Swedish population characteristics: legumes and nuts were incorporated into the vegetable group due to low intake; cereals are extended to include potatoes due to high consumption; and MUFA/SFA was changed to polyunsaturated fatty acids (PUFA)/SFA [18]. Two US cohort studies also found no association of MDS in the overall prostate cancer risk, and this tendency remained even after stratification of advanced and fatal prostate cancer groups [16
17]. The baseline PSA screening history subgroups were also not associated [16]. In summary, there was no association between MDS and prostate cancer risk in all four of the studies.
Table 1
The association between the MDS and prostate cancer risk
| Reference | Country | Study characteristics | Population | Age | Dietary assessment | Investigated dietary index | Results, OR/HR (95% CI) | ||
|---|---|---|---|---|---|---|---|---|---|
| Möller et al. [15] | Sweden | Population-based case-control, CAPS (2001–2002) | 1,482 cases | 35–79 | 106-item FFQ | MDS-gram,* serv,† cent,‡ greek§ | MDS-gram | ||
| 1,108 controls | - Components: 9 | ORHigh vs. Low = 1.03 (0.81–1.30) | |||||||
| 6 potential + | MDS-serv | ||||||||
| 3 potential − | ORHigh vs. Low = 0.98 (0.77–1.24) | ||||||||
| - Each score: 0, 1 | MDS-cent | ||||||||
| - Range of total score: 0–9 | ORHigh vs. Low = 1.12 (0.84–1.45) | ||||||||
| MDS-alt∥ | MDS-greek | ||||||||
| - Components: 10 | ORHigh vs. Low = 1.19 (0.87–1.61) | ||||||||
| 7 potential + | MDS-alt | ||||||||
| 3 potential − | ORHigh vs. Low = 1.13 (0.90–1.41) | ||||||||
| - Each score: 0, 1 | |||||||||
| - Range of total score: 0–10 | |||||||||
| Bosire et al. [16] | US | Cohort | 293,464 men (23,453 cases) | 50–71 | 124-item FFQ | aMED | 1) Advanced | ||
| 1) NIH-AARP (1995–2006) | - Components: 9 | HRHigh vs. Low = 1.00 (0.87–1.15) | |||||||
| 2) Follow-up: mean 8.9 yr | 7 potential + | p-trend = 0.82 | |||||||
| 2 potential − | 2) Fatal | ||||||||
| - Each score: 0, 1 | HRHigh vs. Low = 0.80 (0.59–1.10) | ||||||||
| - Range of total score: 0–9 | p-trend = 0.23 | ||||||||
| Kenfield et al. [17] | US | Cohort | 42,867 men (6,220 cases) | 40–75 | 130-item FFQ | MED | HRHigh vs. Low = 0.95 (0.90–1.02) | ||
| 1) HPFS (1986–2010) | - Components: 9 | p-trend = 0.13 | |||||||
| 2) Follow-up: median 23.2 yr | 6 potential + | ||||||||
| 3 potential − | |||||||||
| - Each score: 0, 1 | |||||||||
| - Range of total score: 0–9 | |||||||||
| Ax et al. [18] | Sweden | Cohort | 1,044 men (72 cases) | 71 (mean) | 7-day dietary record | mMDS | HRHigh vs. Low = 1.04 (0.43–2.49) | ||
| 1) ULSAM (1991–2007) | - Components: 8 | p-trend = 0.90 | |||||||
| 2) Follow-up: median 13 yr | 5 potential + | ||||||||
| 3 potential − | |||||||||
| - Each score: 0, 1 | |||||||||
| - Range of total score: 0–8 | |||||||||
MDS or MED, Mediterranean Diet Score; OR, odds ratio; HR, hazard ratio; CI, confidence interval; CAPS, Cancer of the Prostate in Sweden study; FFQ, food frequency questionnaire; NIH-AARP, National Institute of Health-American Association of Retired Persons; aMED, alternate Mediterranean Diet Score; HPFS, Health Professionals Follow-up Study; ULSAM, Uppsala Longitudinal Study of Adult Men; mMDS, modified Mediterranean Diet Score.
*gram, Median intake is expressed as gram/day; †serv, Median intake is expressed as servings/week; ‡cent, 25th or 75th centile is used instead of median intake; §greek, Greek referent population is used instead of Swedish population; ∥alt, Alternated MDS component focused on most traditional-based components.
DII
The DII was developed on the basis that diet may play a crucial role in chronic inflammation [19]. Through performing a literature review, DII has expanded to 45 food-parameters, and the overall inflammatory effect (pro, anti, and null) of each article was calculated using six inflammatory biomarkers: interleukin (IL)-1β, IL-6, tumor necrosis factor (TNF)-α, C-reactive protein, IL-4, and IL-10 [20]. The mean effects of each article are classified into three inflammatory status groups (pro, anti, and null), and through weighing each study design differently and calculating the net pro-inflammatory fractions, the food parameter-specific ‘overall inflammatory effect score’ was derived. [20]. By utilizing 11 food-consumption datasets as reference population databases for each food parameter, individual ‘centered percentile of Z-scores’ were derived [20]. By multiplying the ‘centered percentiles’ by the ‘inflammatory effect score’ and summing up all those food parameter-specific scores, the individual DII was derived, and a higher DII indicates a more pro-inflammatory diet [20].
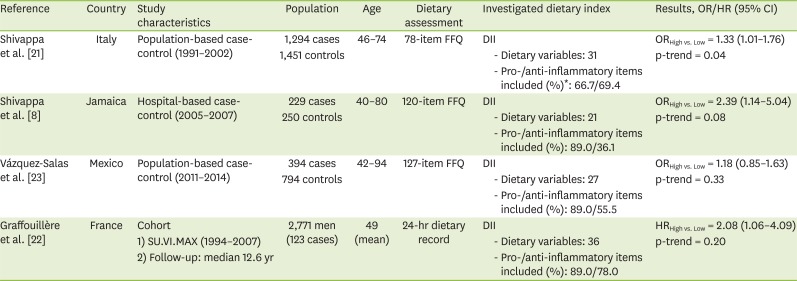
Table 2 describes the association between DII and the prostate cancer risk, including three case-control studies and one cohort study [8212223]. A study from Italy observed a possible role of diet in prostate cancer, which showed that Italian men with higher DII scores had a higher risk (odds ratio [OR], 1.33; 95% confidence interval [CI], 1.01–1.76; p-trend = 0.04) [21]. A Jamaican study also found a higher risk of prostate cancer in the highest quartile of DII, compared to the lowest quartile (OR, 2.39; 95% CI, 1.14–5.04) [8]. A cohort study in France also had increased risk of overall prostate cancer in the highest quartile of pro-inflammatory diet (hazard ratio [HR], 2.08; 95% CI, 1.06–4.09) [22]. However, in a Mexican study, no association was observed between DII after energy-adjustment and prostate cancer risk, and this trend remained after stratification by the Gleason score [23]. In summary, DII was significantly associated with increased risk of prostate cancer in 3 out of 4 studies.
Table 2
The association between the DII and prostate cancer risk
| Reference | Country | Study characteristics | Population | Age | Dietary assessment | Investigated dietary index | Results, OR/HR (95% CI) | |
|---|---|---|---|---|---|---|---|---|
| Shivappa et al. [21] | Italy | Population-based case-control (1991–2002) | 1,294 cases | 46–74 | 78-item FFQ | DII | ORHigh vs. Low = 1.33 (1.01–1.76) | |
| 1,451 controls | - Dietary variables: 31 | p-trend = 0.04 | ||||||
| - Pro-/anti-inflammatory items included (%)*: 66.7/69.4 | ||||||||
| Shivappa et al. [8] | Jamaica | Hospital-based case-control (2005–2007) | 229 cases | 40–80 | 120-item FFQ | DII | ORHigh vs. Low = 2.39 (1.14–5.04) | |
| 250 controls | - Dietary variables: 21 | p-trend = 0.08 | ||||||
| - Pro-/anti-inflammatory items included (%): 89.0/36.1 | ||||||||
| Vázquez-Salas et al. [23] | Mexico | Population-based case-control (2011–2014) | 394 cases | 42–94 | 127-item FFQ | DII | ORHigh vs. Low = 1.18 (0.85–1.63) | |
| 794 controls | - Dietary variables: 27 | p-trend = 0.33 | ||||||
| - Pro-/anti-inflammatory items included (%): 89.0/55.5 | ||||||||
| Graffouillère et al. [22] | France | Cohort | 2,771 men (123 cases) | 49 (mean) | 24-hr dietary record | DII | HRHigh vs. Low = 2.08 (1.06–4.09) | |
| 1) SU.VI.MAX (1994–2007) | - Dietary variables: 36 | p-trend = 0.20 | ||||||
| 2) Follow-up: median 12.6 yr | - Pro-/anti-inflammatory items included (%): 89.0/78.0 | |||||||
DII, Dietary Inflammatory Index; OR, odds ratio; HR, hazard ratio; CI, confidence interval; FFQ, food frequency questionnaire; SU.VI.MAX, SUpplémentation en VItamines et Minéraux AntioXydants cohort.
*Vázquez-Salas et al. calculated the proportion of components used for DII [23].
OBS AND OSS
Oxidative stress is defined as a condition of excessive reactive oxygen species (ROS) [24]. ROS have been known to be involved in diverse diseases and may also play a crucial role in prostate cancer development and progression [2526]. Individual antioxidants (e.g., selenium, lycopene, and vitamin) showed conflicting results in preventive measures, especially when the studies were taken together in a meta-analysis [6]. Thus, if multiple components are combined into a composite measure of OBS (OSS), it may be more closely associated with cancer risk than any other single factors [27]. OBS components include pro-oxidants (e.g., n-6 fatty acids, iron, saturated fat, alcohol use, smoking history, and body mass index), with higher exposure to lower score (0 point), and lower exposure to higher score (1 point); and anti-oxidants (e.g., α-carotene, β-carotene, β-cryptoxanthin, lycopene, lutein, vitamin C, vitamin E, selenium supplements, zinc, n-3 fatty acids, flavonoids, glucosinolates, physical activity, and regular nonsteroidal anti-inflammatory drug use), which had scores that were inverse of the anti-oxidants [28]. All the component points are added up to form the final score [28].
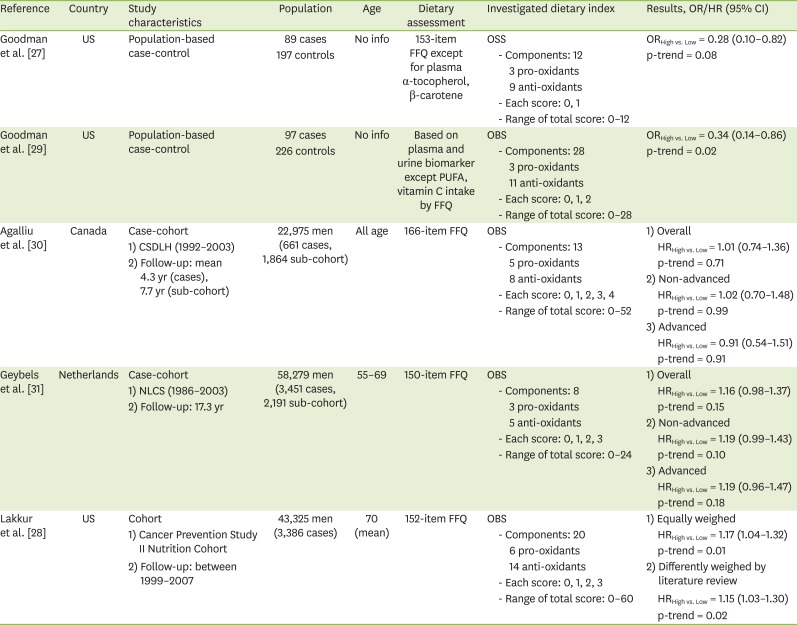
Table 3 describes the association between OBS/OSS and prostate cancer risk in 2 case-control studies, 2 case-cohort studies, and a cohort study [2728293031]. In a US case-control study conducted in 2007, a significant inverse association was observed (OR, 0.28; 95% CI, 0.10–0.82) [27]. When the study was modified (scores were divided into tertiles instead of a high-low dichotomy; PUFA was used instead of SFA; the urinary selenium level was used instead of food frequency questionnaire (FFQ); α-carotene and γ-tocopherol were added) and conducted again in 2010, the association was maintained (OR, 0.32; 95% CI, 0.14–0.86; p-trend = 0.01) [29]. However, in the case-cohort studies in Canada and Netherlands, no association was found between OBS and prostate cancer risk overall and in non-advanced and advanced cancer subgroups [3031]. The opposite tendency was observed in a US cohort, suggesting that people with a higher equally-weighted OBS increased the risk of developing overall prostate cancer (HR, 1.17; 95% CI, 1.04–1.32; p-trend = 0.01), and this tendency remained when OBS components was differently weighed by reflecting literature reviews (HR, 1.15; 95% CI, 1.03–1.30; p-trend = 0.02) [28]. In brief, out of 5 studies, higher OBS (OSS) was associated with decreased risk of prostate cancer in two case-control studies, whereas a cohort study showed increased risk of prostate cancer.
Table 3
The association between the OBS and prostate cancer risk
| Reference | Country | Study characteristics | Population | Age | Dietary assessment | Investigated dietary index | Results, OR/HR (95% CI) | |||
|---|---|---|---|---|---|---|---|---|---|---|
| Goodman et al. [27] | US | Population-based case-control | 89 cases | No info | 153-item FFQ except for plasma α-tocopherol, β-carotene | OSS | ORHigh vs. Low = 0.28 (0.10–0.82) | |||
| 197 controls | - Components: 12 | p-trend = 0.08 | ||||||||
| 3 pro-oxidants | ||||||||||
| 9 anti-oxidants | ||||||||||
| - Each score: 0, 1 | ||||||||||
| - Range of total score: 0–12 | ||||||||||
| Goodman et al. [29] | US | Population-based case-control | 97 cases | No info | Based on plasma and urine biomarker except PUFA, vitamin C intake by FFQ | OBS | ORHigh vs. Low = 0.34 (0.14–0.86) | |||
| 226 controls | - Components: 28 | p-trend = 0.02 | ||||||||
| 5 pro-oxidants | ||||||||||
| 11 anti-oxidants | ||||||||||
| - Each score: 0, 1, 2 | ||||||||||
| - Range of total score: 0–28 | ||||||||||
| Agalliu et al. [30] | Canada | Case-cohort | 22,975 men (661 cases, 1,864 sub-cohort) | All age | 166-item FFQ | OBS | 1) | Overall | ||
| 1) CSDLH (1992–2003) | - Components: 13 | HRHigh vs. Low= 1.01 (0.74–1.36) | ||||||||
| 2) Follow-up: mean 4.3 yr (cases), 7.7 yr (sub-cohort) | 5 pro-oxidants | p-trend = 0.71 | ||||||||
| 8 anti-oxidants | 2) | Non-advanced | ||||||||
| - Each score: 0, 1, 2, 3, 4 | HRHigh vs. Low = 1.02 (0.70–1.48) | |||||||||
| - Range of total score: 0–52 | p-trend = 0.99 | |||||||||
| 3) | Advanced | |||||||||
| HRHigh vs. Low = 0.91 (0.54–1.51) | ||||||||||
| p-trend = 0.91 | ||||||||||
| Geybels et al. [31] | Netherlands | Case-cohort | 58,279 men (3,451 cases, 2,191 sub-cohort) | 55–69 | 150-item FFQ | OBS | 1) | Overall | ||
| 1) NLCS (1986–2003) | - Components: 8 | HRHigh vs. Low = 1.16 (0.98–1.37) | ||||||||
| 2) Follow-up: 17.3 yr | 3 pro-oxidants | p-trend = 0.15 | ||||||||
| 5 anti-oxidants | 2) | Non-advanced | ||||||||
| - Each score: 0, 1, 2, 3 | HRHigh vs. Low = 1.19 (0.99–1.43) | |||||||||
| - Range of total score: 0–24 | p-trend = 0.10 | |||||||||
| 3) | Advanced | |||||||||
| HRHigh vs. Low = 1.19 (0.96–1.47) | ||||||||||
| p-trend = 0.18 | ||||||||||
| Lakkur et al. [28] | US | Cohort | 43,325 men (3,386 cases) | 70 (mean) | 152-item FFQ | OBS | 1) | Equally weighed | ||
| 1) Cancer Prevention Study II Nutrition Cohort | - Components: 20 | HRHigh vs. Low = 1.17 (1.04–1.32) | ||||||||
| 2) Follow-up: between 1999–2007 | 6 pro-oxidants | p-trend = 0.01 | ||||||||
| 14 anti-oxidants | 2) | Differently weighed by literature review | ||||||||
| - Each score: 0, 1, 2, 3 | HRHigh vs. Low = 1.15 (1.03–1.30) | |||||||||
| - Range of total score: 0–60 | p-trend = 0.02 | |||||||||
OTHER A PRIORI DIETARY INDICES
NNR
The NNR refers to the guidelines for dietary composition and recommended nutrient intake, which meet nutritional needs and prevent diet-associated chronic diseases in Nordic populations [32]. The nine reference values of NNR are carbohydrates, protein, and fat composition alcohol, fiber, salt, vitamins, minerals, and physical activity level [33]. Each dietary recommendation can receive 1 (perfect adherence) or 0 point (non-adherence), which are equally-weighed, resulting in a total score ranging from 0–9 points [3334].
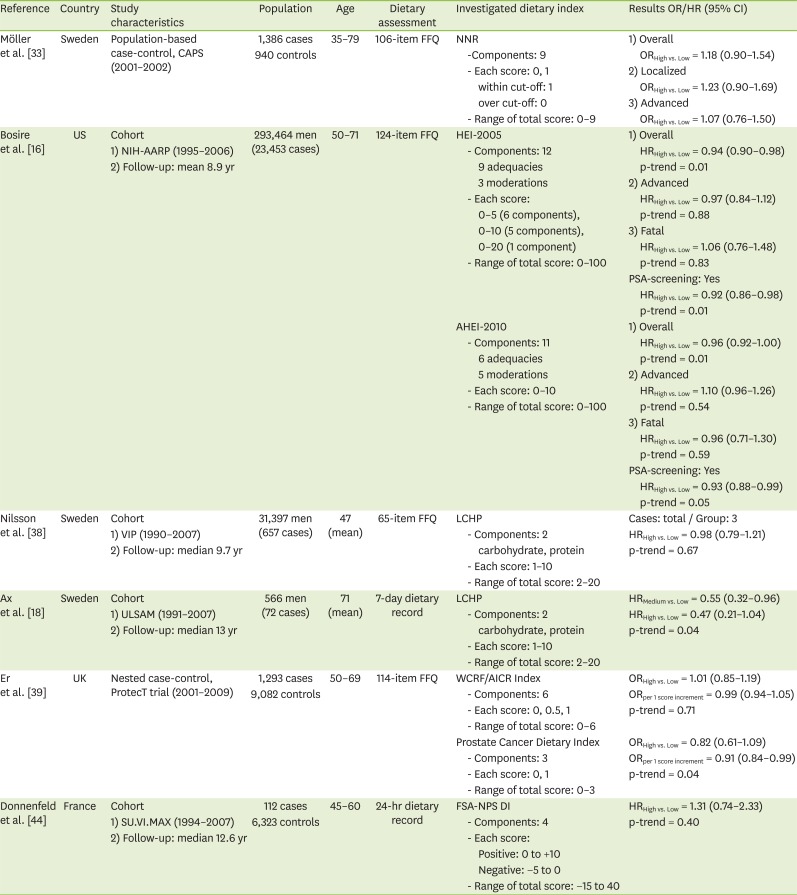
Table 4 shows the association between other a priori dietary indices, which had less than three researches, with the risk of prostate cancer. In a case-control study conducted in Sweden, NNR was not associated with prostate cancer risk [33].
Table 4
The association between other a priori dietary indices and prostate cancer risk
| Reference | Country | Study characteristics | Population | Age | Dietary assessment | Investigated dietary index | Results OR/HR (95% CI) | |||
|---|---|---|---|---|---|---|---|---|---|---|
| Möller et al. [33] | Sweden | Population-based case-control, CAPS (2001–2002) | 1,386 cases | 35–79 | 106-item FFQ | NNR | 1) | Overall | ||
| 940 controls | -Components: 9 | ORHigh vs. Low = 1.18 (0.90–1.54) | ||||||||
| - Each score: 0, 1 | 2) | Localized | ||||||||
| within cut-off: 1 | ORHigh vs. Low = 1.23 (0.90–1.69) | |||||||||
| over cut-off: 0 | 3) | Advanced | ||||||||
| - Range of total score: 0–9 | ORHigh vs. Low = 1.07 (0.76–1.50) | |||||||||
| Bosire et al. [16] | US | Cohort | 293,464 men (23,453 cases) | 50–71 | 124-item FFQ | HEI-2005 | 1) | Overall | ||
| 1) NIH-AARP (1995–2006) | - Components: 12 | HRHigh vs. Low = 0.94 (0.90–0.98) | ||||||||
| 2) Follow-up: mean 8.9 yr | 9 adequacies | p-trend = 0.01 | ||||||||
| 3 moderations | 2) | Advanced | ||||||||
| - Each score: 0–5 (6 components), 0–10 (5 components), 0–20 (1 component) | HRHigh vs. Low = 0.97 (0.84–1.12) | |||||||||
| - Range of total score: 0–100 | p-trend = 0.88 | |||||||||
| 3) | Fatal | |||||||||
| HRHigh vs. Low = 1.06 (0.76–1.48) | ||||||||||
| p-trend = 0.83 | ||||||||||
| PSA-screening: Yes | ||||||||||
| HRHigh vs. Low = 0.92 (0.86–0.98) | ||||||||||
| p-trend = 0.01 | ||||||||||
| AHEI-2010 | 1) | Overall | ||||||||
| -Components: 11 | HRHigh vs. Low = 0.96 (0.92–1.00) | |||||||||
| 6 adequacies | p-trend = 0.01 | |||||||||
| 5 moderations | 2) | Advanced | ||||||||
| -Each score: 0–10 | HRHigh vs. Low = 1.10 (0.96–1.26) | |||||||||
| -Range of total score: 0–100 | p-trend = 0.54 | |||||||||
| 3) | Fatal | |||||||||
| HRHigh vs. Low = 0.96 (0.71–1.30) | ||||||||||
| p-trend = 0.59 | ||||||||||
| PSA-screening: Yes | ||||||||||
| HRHigh vs. Low = 0.93 (0.88–0.99) | ||||||||||
| p-trend = 0.05 | ||||||||||
| Nilsson et al. [38] | Sweden | Cohort | 31,397 men (657 cases) | 47 (mean) | 65-item FFQ | LCHP | Cases: total / Group: 3 | |||
| 1) VIP (1990–2007) | -Components: 2 | HRHigh vs. Low = 0.98 (0.79–1.21) | ||||||||
| 2) Follow-up: median 9.7 yr | carbohydrate, protein | p-trend = 0.67 | ||||||||
| -Each score: 1–10 | ||||||||||
| -Range of total score: 2–20 | ||||||||||
| Ax et al. [18] | Sweden | Cohort | 566 men (72 cases) | 71 (mean) | 7-day dietary record | LCHP | HRMedium vs. Low = 0.55 (0.32–0.96) | |||
| 1) ULSAM (1991–2007) | -Components: 2 | HRHigh vs. Low = 0.47 (0.21–1.04) | ||||||||
| 2) Follow-up: median 13 yr | carbohydrate, protein | p-trend = 0.04 | ||||||||
| -Each score: 1–10 | ||||||||||
| -Range of total score: 2–20 | ||||||||||
| Er et al. [39] | UK | Nested case-control, ProtecT trial (2001–2009) | 1,293 cases | 50–69 | 114-item FFQ | WCRF/AICR Index | ORHigh vs. Low = 1.01 (0.85–1.19) | |||
| 9,082 controls | -Components: 6 | ORper 1 score increment = 0.99 (0.94–1.05) | ||||||||
| -Each score: 0, 0.5, 1 | p-trend = 0.71 | |||||||||
| -Range of total score: 0–6 | ||||||||||
| Prostate Cancer Dietary Index | ORHigh vs. Low = 0.82 (0.61–1.09) | |||||||||
| -Components: 3 | ORper 1 score increment = 0.91 (0.84–0.99) | |||||||||
| -Each score: 0, 1 | p-trend = 0.04 | |||||||||
| -Range of total score: 0–3 | ||||||||||
| Donnenfeld et al. [44] | France | Cohort | 112 cases | 45–60 | 24-hr dietary record | FSA-NPS DI | HRHigh vs. Low = 1.31 (0.74–2.33) | |||
| 1) SU.VI.MAX (1994–2007) | 6,323 controls | -Components: 4 | p-trend = 0.40 | |||||||
| 2) Follow-up: median 12.6 yr | -Each score: | |||||||||
| Positive: 0 to +10 | ||||||||||
| Negative: −5 to 0 | ||||||||||
| -Range of total score: −15 to 40 | ||||||||||
OR, odds ratio; HR, hazard ratio; CI, confidence interval; CAPS, Cancer of the Prostate in Sweden study; FFQ, food frequency questionnaire; NNR, Nordic Nutrition Recommendations; NIH-AARP, National Institute of Health-American Association of Retired Persons; HEI-2005, Healthy Eating Index-2005; PSA, prostate specific antigen; AHEI-2010, alternate Healthy Eating Index-2010; VIP, Vasterbotten Intervention Programme; LCHP, Low Carbohydrate, High Protein Diet; ULSAM, Uppsala Longitudinal Study of Adult Men; WCRF/AICR, World Cancer Research Fund International/American Institute for Cancer Research; SU.VI.MAX, SUpplémentation en VItamines et Minéraux AntioXydants cohort; FSA-NPS DI, Food Standards Agency Nutrition Profiling System Dietary Index.
HEI
HEI-2005 reflects MyPyramid, the key recommendations from the 2005 Dietary Guidelines for Americans, into the specific index by including all of the major food groups to ensure adequate nutrient intake [3536]. The index includes twelve components, with a total score ranging from 0–100 points: 6 components (total fruit, whole fruit, total vegetables, dark green and orange vegetables and legumes, total grains, and whole grains) are scored from 0–5 points; 5 components (milk, meat and beans, oils, saturated fat, and sodium) are scored 0–6 points; and 1 component (calories from solid fats, alcoholic beverages, and added sugars) is scored from 0–20 points [36]. A higher HEI indicating the healthier dietary intake [36]. Alternate HEI 2010 (AHEI-2010) was modified from HEI-2005 and incorporated current scientific evidence on diet and health, such as predictive dietary factors of chronic diseases (e.g., type 2 diabetes, cardiovascular disease, and coronary heart disease) [37]. Sodium, sugar-sweetened beverages, and n-3 fatty acids are included, and multivitamins are excluded, establishing 11 components that are scored equally 0–10 points, comprising a total score that ranges from 0–110 points [37].
In a US cohort, there were inverse associations between overall prostate cancer risk and both HEI-2005 (HR, 0.94; 95% CI, 0.90–0.98; p-trend = 0.01) and AHEI-2010 (HR, 0.96; 95% CI, 0.92–1.00; p-trend = 0.01) [16]. This association remained with the study subjects who reported PSA screening during preceding 3 years, in both HEI-2005 (HR, 0.92; 95% CI, 0.86–0.98; p-trend = 0.01) and AHEI-2010 (HR, 0.93; 95% CI, 0.88–0.99; p-trend = 0.05), but there was no association with advanced and fatal prostate cancer cases [16] (Table 4).
LCHP score
The LCHP score is independent of total energy intake, thus, it is not affected by the iso-caloric characteristics of carbohydrates and proteins, allowing separate consideration of the quality and quantity of fat consumption [38]. Participants with the highest decile of energy-adjusted carbohydrate intake were assigned to the lowest score (1 point), whereas the lowest decile was assigned to the highest score (10 point) [1838]. The reverse is applied to energy-adjusted protein intake, and the score of carbohydrate and protein are summed up, resulting in the total score ranging between 2–20 points [1838].
In a cohort study conducted in Sweden (mean age at baseline: 47), no significant association was observed between LCHP diet and the risk of prostate cancer [38]. However, another Swedish cohort (mean age at baseline: 71) found deceased risk of prostate cancer in the medium LCHP score group (HR, 0.55; 95% CI, 0.32–0.96; p-trend = 0.04) but not in the highest group [18] (Table 4).
WCRF/AICR Recommendations Index and Prostate Cancer Dietary Index
The WCRF/AICR recommendations are for overall cancer prevention, and are not particularly targeted at prostate cancer [739]. Thus, prostate cancer specific recommendations were developed from the general diet recommendations, which had significant evidence in WCRF/AICR second expert report: calcium as a positively associated factor, and selenium and lycopene-rich foods as a probably inversely associated factor [739]. In the WCRF/AICR Recommendations Index, 6 out of 8 components (body fatness, physical activity, energy-dense foods, plant foods, animal foods, and alcoholic drinks) were included, while two components (dietary supplements, preservation/processing/preparation) were excluded due to insufficient recommendations [39]. An adherence score of 1 (complete), 0.5 (partial), or 0 (no) was assigned to each component [39]. In the Prostate Cancer Dietary Index, calcium, tomato and tomato products, and selenium had a dichotomous score of the recommended amount of each food and nutrient: 1 (above), 0 (lower) [739].
In a nested case-control study conducted in the UK, the WCRF/AICR Recommendations Index was not significant overall and in subgroups divided by stage (localized, locally advanced) [39]. In the Prostate Cancer Dietary Index, the dose-response (per unit score) increase of index score demonstrated a borderline association between index score and decreased risk (OR, 0.91; 95% CI, 0.84–0.99; p-trend = 0.04), but this tendency disappeared when the score was classified into tertiles or stratified by cancer stage [39] (Table 4).
FSA-NPS DI
The FSA-NPS DI was first developed in the UK by the Food Standards Agency, and is one of the most scientifically-validated systems in Europe [4041]. This index has been developed and validated for the French food environment to suit French populations [42]. FSA score is computed by the nutrient content of foods and beverages per 100 g, adding 0–10 points for each of energy, total sugar, SFA, and sodium, and subtracting 0–5 points for fruits, vegetables, nuts, fibers, and proteins [43]. The score is then computed at the individual level by using energy-weighted means, and higher score indicates unhealthier food choices [42].
DISCUSSION
To the best of our knowledge, this is the first review to identify the association between diverse a priori dietary indices and prostate cancer risk. However, the results were controversial except for MDS and DII which had relatively consistent results among studies. MDS had no association between diverse a priori dietary indices and prostate cancer risk but DII showed positive association.
In MDS, none of the four studies (one case-control, three cohorts) were significant [15161718]. This null result for MDS might be affected by the blunt scoring method, which is insufficient to consider all dietary factors, or by counter-balancing the protective or promoting effect of each component when combined together [15]. However, within those diagnosed with non-metastatic prostate cancer at baseline, adherence to the Mediterranean diet was associated with lower overall mortality, suggesting possible beneficial effects [17]. Similarly, in a meta-analysis between MDS and prostate cancer risk including incidence and mortality, a significantly reduced risk was found (relative risk [RR], 0.96; 95% CI, 0.92–0.99; p = 0.03; I2 = 0.00) [45]. In this study, the relationship between the risk of mortality and incidence of overall, colorectal, and aero-digestive (esophageal, pharyngeal) cancer was significantly reduced, while breast, gastric, and pancreatic cancer were not associated [45]. MDS may also have protective effects in other chronic diseases, such as cardiovascular disease (CVD) [46] and type 2 diabetes mellitus (T2DM) [47].
For the DII, 3 out of 4 studies (2 case-control, 1 cohort) had an increased risk of 1.33–2.39 times, implicating a pro-inflammatory diet as a risk-factor for prostate cancer. These outcomes are consistent with the biological mechanism that cancer might originate from chronic inflammation [48]. Several other studies with different cancers also had significant association with a higher DII: colorectal [4950515253], gastric [54], pancreatic [55], esophageal squamous cell [5657], endometrial [58], and hepatocellular among men without infection history of hepatitis B/C [59]. The findings for breast cancer were controversial. A cohort study of Swedish women had a positive association between high DII and the risk of breast cancer [60], while case-control studies on German women had no association between them [61]. In other chronic diseases, a pro-inflammatory diet was also associated with dyspnea and radiological evidence of emphysema among heavy smokers [62], worsened asthma status [63], and elevated metabolic syndrome components (C-reactive protein, glucose intolerance) [64].
In OBS, out of 5 studies, two continuous case-control studies demonstrated 0.28 and 0.34 times decreased risk, whereas a cohort study had 1.17 times increased risk [2728293031]. The inconsistent results are expected to be due to differences in indices, such as different components and categorization [28]. Higher OBS was inversely associated with other chronic diseases: colorectal adenoma in case-control studies [6566] and a pooled-analysis from three US case-control studies [67], breast cancer risk [68], hypertension [69], and all-cause, cancer, and non-cancer mortality [70].
The high adherence to the NNR was not associated with prostate cancer, which might be due to generally high NNR score and its narrow distribution in the study population [33]. Additionally, other studies using the NNR index with upper respiratory tract infection (URTI) were not significant [34]. The adherence of the Nordic dietary pattern was not in concordance with the same index, as there was a different index named as Healthy Nordic Food Index (HNFI), which was consisted of six items that are part of traditional Nordic cuisine: fish, cabbage, rye bread, oatmeal, apples and pears, and root vegetables [71]. These items were scored according to adherence (0, 1 point per component), with a total score ranging from 0–6 points [71]. The association of HNFI with colorectal cancer risk in women was conflicting, where one study showed decreased risk [71], while another one had no association [72].
HEI-2005 and AHEI-2010 were both inversely associated with overall prostate cancer risk and those who underwent PSA screening during the previous three years, but the advanced and fatal cancer cases were not associated [16]. However, this outcome might be due to a higher history of PSA screening in men in the highest HEI quintile compared to the lowest [16]. Through PSA screening, non-advanced cancer cases might be detected, and the screened group may have a higher possibility of indolent, less severe cancer [16]. In other types of cancers, higher HEI-2005 was associated with decreased risk of colorectal cancer [117374] and pancreatic cancer [75], whereas ovarian cancer had no association [76]. In other chronic diseases, a higher AHEI-2010 was associated with the lower risk of chronic obstructive pulmonary disease (COPD) in both women and men [77], and a lower risk of T2DM in white men [78].
Among 2 Swedish cohort studies, only one study has identified the reduced risk of prostate cancer in the medium LCHP score group [1838]. However, the outcome is still conflicting because macronutrient dietary sources were not considered, and a higher selenium intake was concordant with LCHP score, disturbing the real association in this study [18]. Moreover, the mean age of subjects at baseline in each cohort studies differed considerably (Vasterbotten Intervention Programm [VIP] was 47-year, and Uppsala Longitudinal Study of Adult Men [ULSAM] was 71-year) [1838]. Further studies with stratification of baseline age might be required to look for the difference of association between LCHP and prostate cancer risk, within each age groups. Other types of cancers, such as overall, breast, endometrium, ovary, colorectal, stomach, pancreas, renal cell, urinary, non-Hodgkin's lymphoma, malignant melanoma, multiple myeloma, and leukemia were not associated, while LCHP score was associated with an increased risk of respiratory track cancer in the medium score group in men [38]. In other chronic diseases, a higher LCHP score was associated with increased risk of incident cardiovascular diseases [79], but the associations with mortality of all-cause, cancer, and cardiovascular disease were not clear [80].
The WCRF/AICR Recommendations Index and Prostate Cancer Dietary Index was not associated with prostate cancer [39]. However, this index showed a decreased risk in other cancers: postmenopausal breast cancer [8182], pancreatic cancer [83], head and neck cancer [84], and substantially reduced cancer-specific mortality in older adults [85]. The FSA-NPS DI and prostate cancer had no association, but overall cancer showed 8% increased risk per 1-point increment, especially in the moderate energy intake subgroup, which had a 10% increase [44]. In other chronic diseases, it was prospectively associated with the onset of metabolic syndrome [86], and cardiovascular risk especially for higher-risk populations who smoke, are physically inactive [87] or overweight [88].
The similarities in the index-based dietary patterns include high intake of plant-based foods that have healthier effects on humans, and the low intake of animal products. Higher total scores are considered to represent a healthy diet, except for DII and FSA-NPS DI, which are scored in the opposite way. Compared to the other indices, the LCHP score has distinctive characteristics that include only energy-adjusted carbohydrates and protein intake. The MDS, NNR, HEI, WCRF/AICR Recommendations Index, Prostate Cancer Dietary Index, and FSA-NPS DI are mostly focused on food items. The OBS and DII are relatively complex in that they include various individual nutrient components, such as polyphenols (e.g., anthocyanidins and flavones), vitamins, and minerals. The score components are equally or differently weighed. Scores can be differently weighed by setting different max-points for each component (e.g., HEI-2005 and FSA-NPS DI), by multiplying the magnitude of the association from meta-analysis [28], or by energy-weighing [44].
The strength of this study is that it has identified the association between diverse a priori dietary pattern indices with the risk for prostate cancer. As individual food cannot be consumed separately, it is more comprehensive to evaluate the overall dietary pattern. Moreover, a priori dietary methods might have a better capacity for comparisons between different populations compared to a posteriori methods, which are only specific to the study population.
There are several limitations in this study. First, each study had a different number of items included in the FFQ. For this reason, it is difficult to compare the studies accurately, and the possibility of a controversial outcome is higher. Second, a priori dietary indices lack generalizability and comparability. The differences between studies include the following: diverse versions or modifications of indices; various index components; scoring methods (e.g., cutoffs were specifically coordinated to each study population for the purpose of increasing statistical power, but reduced the comparability with other studies); score calculating procedures (e.g., weighing equally or differently); and score categorization criteria (e.g., dichotomous by mean/median, tertile, quartile, quintile, or continuous variables). Finally, a priori indices lack replicability in their association with prostate cancer. There are inconsistent results among studies; the literatures are deficient; and most of the studies were conducted in Europe and North America, indicating that the populations involved in the studies are relatively similar. Therefore, further studies are required to identify consistent a priori criteria for each of the indices, and should be conducted actively in various population from different countries.
CONCLUSION
This review indicates that there is insufficient evidence to support the association between the a priori indices and prostate cancer risk, except for the MDS and DII, which had relatively consistent results among studies. In further research, a priori indices should be consistent with the index version, index components, component scoring method, score calculating procedures, and score categorization criteria, and be actively conducted in various populations from different countries in order to improve the generalizability, comparability, and replicability of the outcomes.
 XML Download