

 PDF
PDF ePub
ePub Citation
 Print
Print


INTRODUCTION
For humans, vitamin C is an essential nutrient which is one of the most generally supplemented nutrients worldwide [1]. High dose vitamin C is frequently used as a dietary supplement [2], because many people believe that vitamin C supplement enhances health and improves performance [3]. However, there has been little research into effect of high dose vitamin C supplements on plasma and urinary vitamin C concentrations, and related health outcomes.
According to dietary reference intakes for Koreans, recommended nutrient intake (RNI) and upper limit (UL) of the daily vitamin C intakes for Korean adults (over 19 years) are 100 mg and 2,000 mg, respectively [2]. When compared with the reference level, actual vitamin C intakes from foods in Korean were 100%–115% of RNI for Koreans [4], indicating that the RNI of the daily vitamin C intakes is satisfied without vitamin C intakes from supplements. In previous studies, bioavailability of vitamin C was complete at 200 mg, and urinary excretion did not occur until the 100 mg dose, while nearly all absorbed vitamin was excreted at the 500 mg dose [56]. According to these studies, it appears that high dose of vitamin C supplementation shows little effect on plasma concentration of vitamin C, whereas high dose increases urinary excretion [56]. However, there has been minimal research regarding plasma and urine concentration by vitamin C supplementation for Korean, especially among women.
Therefore, it is necessary to exam plasma and urine levels of vitamin C in relation to vitamin C supplementation for a wide range of doses in Korean women. The aim of the study was to assess vitamin C supplementation at different doses of 100 mg (RNI), 2,000 mg (UL) on plasma vitamin C level and urinary vitamin C excretion. In addition, superoxide dismutase (SOD) activity and plasma thiobarbituric acid reactive substance (TBARS), and fatigue severity scale (FSS) were assessed in Korean women.
Go to : 
MATERIALS AND METHODS
Subjects and study design
Twenty-seven healthy female volunteers were recruited from community bulletin board of Kyung Hee University from March to April, 2014. Inclusion criteria were non-smoker, no vitamin and mineral supplements, non-pregnancy, non-alcoholism, no known medical illness, and women aged 20–49 years.
A total of 27 eligible participants were required to take vitamin C supplement or placebo for 4 weeks. All subjects are without any medications or supplements. Total of 27 subjects were divided into 3 groups of which were the placebo group (n = 9), supplementation group of 100 mg/day vitamin C (n = 9), and supplementation group of 2,000 mg/day vitamin C (n = 9) and 24 subjects completed all the necessary requirements. The supplement doses of 100 mg and 2,000 mg vitamin C are considered as safe for subjects. Synthetic vitamin C supplements were supplied from GNC Korea (Seoul, Korea). To be eligible for the study, all subjects agreed written informed consent for participation in the study. The research protocol was approved by the Institutional Review Board (IRB) of the Kyung Hee University (KHSIRB-13-040).
Anthropometric measurements
Information regarding the general characteristics of participants (age, history of disease, taking medication, and vitamin and/or mineral supplement) was collected by a trained researcher. Anthropometric measurements included body weight and height after the subjects had been instructed to wear light clothes but not to wear socks. Body mass index (BMI) was calculated as body weight (kg)/height squared (m2). Weight, height, and body fat mass (BFM) of the subjects measured with an Inbody 720 (Biospace Co., Seoul, Korea). Measurements were recorded to the nearest 0.1 cm or 0.1 kg. Blood pressure (BP) was measured twice with an automated oscillometric device (Biospace Co.).
Assessment of dietary intake
Dietary intake was determined by a dietitian. Dietary intake was assessed by three 24-hour recalls including 2 weekdays and 1 weekend day. Dietary data were coded by a trained dietitian and nutrient analysis was carried out using the computer aided nutritional analysis program 4.0 (CAN-Pro 4.0; The Korean Nutrition Society, Seoul, Korea).
Analysis of blood samples
Blood samples (7 mL) were collected by venipuncture after 12-hour overnight fast. Heparinized plasma samples were separated by centrifugation at 2,000 × g for 15 minutes at 4°C, then stored at −70°C in 0.5 mL aliquots until assayed for the measurement of plasma vitamin C concentration, SOD activity, and 0.1 mL aliquots until assayed for the measurement of TBARS levels.
Plasma vitamin C concentration was measured by high performance liquid chromatography (HPLC). Plasma SOD levels were measured using a commercially SOD assay kit (Cayman Chemical, Ann Arbor, MI, USA). Plasma TBARS levels were measured using the OxiSelect TBARS assay kit (Cell Biolabs, San Diego, CA, USA).
24-hour urine analysis
Urine samples for vitamin C were analyzed by HPLC with colorimetric electrochemical detection. Urine samples were stored on ice under the dark refrigerator until prepared for assay. One volume of urine was mixed with 4 volumes of 90% methanol/1 mM ethylenediaminetetraacetic acid (EDTA) in water and centrifuged at 2,000 × g for 15 minutes at 4°C. The supernatant was transferred to a new tube, immediately placed on dry ice for 10 minutes, and frozen at −70°C until assay.
FSS
Fatigue was measured with the original FSS developed by Krupp et al. [7]. Each item is scored on a 7-point Likert scale ranging from 1 “strongly disagree” to 7 “strongly agree.” The mean score of the 9 items has commonly been used to estimate fatigue interference.
Statistical analysis
Statistical analysis was performed using Statistical Package for the Social Sciences (SPSS version 20.0; SPSS Inc., Chicago, IL, USA) software. All results are expressed as means ± standard deviations (SDs). One-way analysis of variance (ANOVA) and Duncan's multiple range test were used to compare values among the 3 groups. Paired t-test was used for comparisons within groups. Statistical significance was defined as p < 0.05.
Go to :
RESULTS
Of those who completed the trial, age, height, weight, BMI, waist/hip ratio, BFM, % body fat, systolic blood pressure (SBP), and diastolic blood pressure (DBP) were similar among groups at pre- or post-intervention (Table 1). In addition, age and anthropometric measurements were nonsignificant within groups between pre- and post-intervention.
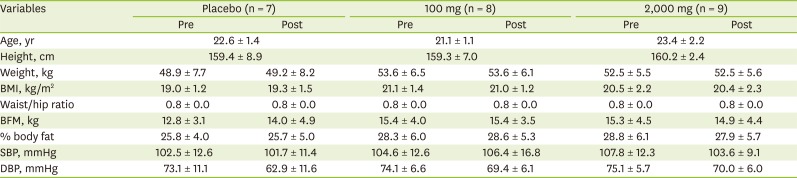
Table 1
Age and anthropometric measurements between pre- and post-intervention according to vitamin C supplementation
Data are mean ± SD. No significantly difference between pre- and post-intervention by paired t-test at p < 0.05. No significantly difference among groups by ANOVA and Duncan's multiple range test.
BMI, body mass index; BFM, body fat mass; SBP, systolic blood pressure; DBP, diastolic blood pressure; SD, standard deviation; ANOVA, analysis of variance.
![]()
Although there were statistically significant within-group increases for plasma vitamin C levels in the 100 mg and 2,000 mg of vitamin C supplementation (pre-intervention: 8.9 ± 2.0 mg/mL and 7.7 ± 1.8 mg/mL; post-intervention: 14.1 ± 2.5 mg/mL and 14.7 ± 3.5 mg/mL, respectively; p < 0.050), there were no significant differences among groups at post-intervention (Table 2).
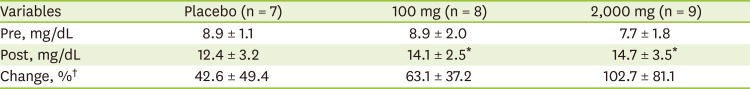
Table 2
Plasma vitamin C concentration between pre- and post-intervention according to vitamin C supplementation
| Variables | Placebo (n = 7) | 100 mg (n = 8) | 2,000 mg (n = 9) |
|---|---|---|---|
| Pre, mg/dL | 8.9 ± 1.1 | 8.9 ± 2.0 | 7.7 ± 1.8 |
| Post, mg/dL | 12.4 ± 3.2 | 14.1 ± 2.5* | 14.7 ± 3.5* |
| Change, %† | 42.6 ± 49.4 | 63.1 ± 37.2 | 102.7 ± 81.1 |
Data are mean ± SD. No significant difference among groups by ANOVA and Duncan's multiple range test.
SD, standard deviation; ANOVA, analysis of variance.
*Significantly different between pre- and post-intervention by paired t-test at p < 0.05. †Change (%) = (post − pre)/pre × 100.
![]()
Likewise, regarding to urinary vitamin C excretion within-group, 100 mg and 2,000 mg of vitamin C supplement groups were significantly increased (pre-intervention: 16.3 ± 24.5 mg/mL and 8.0 ± 11.9 mg/mL; post-intervention: 53.2 ± 36.4 mg/mL and 56.7 ± 42.1 mg/mL, respectively; p < 0.050), and the urinary vitamin C excretion levels of pre- and post-intervention were not significantly different among the groups (Table 3). While percent change (post-pre) of urinary excretion of vitamin C increased slightly with dose, there was no significant difference.
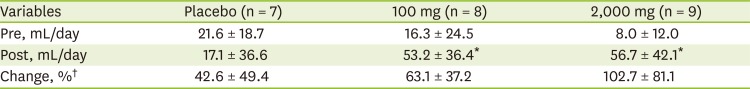
Table 3
Urinary vitamin C excretion between pre- and post-intervention according to vitamin C supplementation
Data are mean ± SD. No significant difference among groups by ANOVA and Duncan's multiple range test.
SD, standard deviation; ANOVA, analysis of variance.
*Significantly different between pre- and post-intervention by paired t-test at p < 0.05. †Change (%) = (post − pre)/pre × 100.
![]()
The SOD activity and TBARS levels at pre- and post-intervention were not significantly different among the groups (Table 4). However, there was significantly difference within-group decreases for SOD activity in all groups (placebo: from 11.5 ± 2.3 U/mL to 9.2 ± 2.3 U/mL; 100 mg: from 12.7 ± 1.97 U/mL to 9.09 ± 3.03 U/mL; and 2,000 mg: from 10.7 ± 1.8 U/mL to 6.9 ± 1.8 U/mL, respectively). On the other hand, TBARS levels after 100 mg of vitamin C supplementation were significantly increased (3.4 ± 2.7 U/μM to 4.0 ± 2.9 U/μM; p < 0.050), whereas TBARS levels after 2,000 mg of vitamin C supplementation were significantly decreased (1.7 ± 0.7 U/μM) compared with pre-intervention (3.6 ± 3.6 U/μM; p < 0.050).
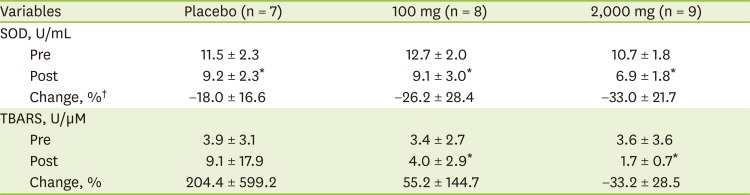
Table 4
Oxidative stress biomarkers between pre- and post-intervention according to vitamin C supplementation
Data are mean ± SD. No significant difference among groups by ANOVA and Duncan's multiple range test.
SOD, superoxide dismutase; TBARS, thiobarbituric acid reactive substance; SD, standard deviation; ANOVA, analysis of variance.
*Significantly different between pre- and post-intervention by paired t-test at p < 0.05. †Change (%) = (post − pre)/pre × 100.
![]()
There were significantly within-group decreases for dietary intakes of energy, cholesterol in placebo, and cholesterol and vitamin C intake in 100 mg of vitamin C supplementation group (Table 5). However, mean dietary intakes were not significantly different among groups.
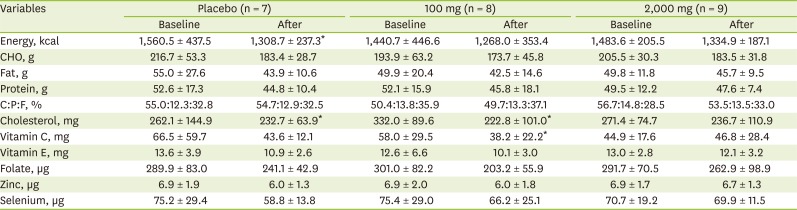
Table 5
Nutrient intakes between pre- and post-intervention according to vitamin C supplementation
Data are mean ± SD. No significant difference among groups by ANOVA and Duncan's multiple range test.
CHO, carbohydrate; C:P:F, carbohydrate:protein:fat; SD, standard deviation; ANOVA, analysis of variance.
*Significantly different between pre- and post-intervention by paired t-test at p < 0.05.
![]()
The FSS at pre- and post-intervention was not significantly different among groups (Table 6). However, The FSS was significantly decreased (pre-intervention: 2.9 ± 1.3; post-intervention: 3.4 ± 1.2) within 100 mg of vitamin C supplement group (p < 0.050).
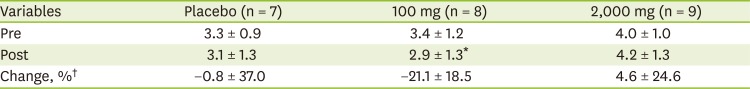
Table 6
FSS between pre- and post-intervention according to vitamin C supplementation
| Variables | Placebo (n = 7) | 100 mg (n = 8) | 2,000 mg (n = 9) |
|---|---|---|---|
| Pre | 3.3 ± 0.9 | 3.4 ± 1.2 | 4.0 ± 1.0 |
| Post | 3.1 ± 1.3 | 2.9 ± 1.3* | 4.2 ± 1.3 |
| Change, %† | −0.8 ± 37.0 | −21.1 ± 18.5 | 4.6 ± 24.6 |
Data are mean ± SD. FSS total score range from 1 to 7; higher scores indicate greater problems with fatigue [7]. No significant difference among groups by ANOVA and Duncan's multiple range test.
FSS, fatigue severity scale; SD, standard deviation; ANOVA, analysis of variance.
*Significantly different between pre- and post-intervention by paired t-test at p < 0.05. †Change (%) = (post − pre)/pre × 100.
![]()
Go to :
DISCUSSION
In this study, we found that plasma vitamin C concentration and urinary excretion of vitamin C significantly increased in 100 mg/day or 2,000 mg/day of vitamin C supplement groups, and the differences were nonsignificant between groups for 4 weeks. In addition, SOD activity was significantly decreased in all groups, and plasma levels of TBARS was increased in 100 mg, but decreased in 2,000 mg of vitamin C supplement group. The FSS significantly was decreased in 100 mg of vitamin C supplement group.
The present study showed plasma vitamin C levels were increased after 100 mg and 2,000 mg of vitamin C supplementation, and plasma vitamin C levels were not significantly different between groups after supplementation. These findings are consistent with other interventions in which supplementation of 30 to 2,500 mg increased plasma vitamin C concentration [289]. Though vitamin C supplementation increased plasma vitamin C concentration, intake only within 30 and 100 mg/day may affected vitamin C availability to tissue. Doses above 500 mg/day resulted in little further increase in plasma vitamin C concentration [56], and absorbed doses were almost entirely excreted in the urine.
In the present study, while urinary vitamin C excretion was increased after vitamin C supplementation of 100 mg and 2,000 mg, urinary vitamin C excretion was not significantly different between groups after supplementation. Earlier vitamin C study reported that 100 mg of vitamin C as a single dose intake was detected in urine excretion, whereas 60 mg/day vitamin C supplement intake was not urinary vitamin C excretion [4]. In addition, dose above 400 mg/day were almost excreted in the urine, and not stored in the body [10].
Since oxidative stress is associated with increased vitamin C requirements [11], we detected SOD activity was significantly decreased in all groups after supplementation. Vitamin C has been shown to react directly with superoxide, hydroxyl radicals, and singlet oxygen [11]. Lim and Kim [12] reported that SOD activity was not significantly affected by 500 mg of vitamin C supplementation for 35 days among adolescents. Gultekin et al. [13] reported that SOD activity was significantly reduced by a high dose of vitamin C and vitamin E administration to erythrocytes, and it suggested that at low- and medium-dose vitamin C and vitamin E did not have any direct inhibitory effect on SOD activity. On the other hand, TBARS level was used for diagnostic indices of the occurrence and extent of lipid peroxidation [14]. In this study, TBARS level was increased in 100 mg vitamin C supplement group and was decreased in 2,000 mg of vitamin C supplement group. In accordance with our data, Yoon and Lee [15] reported 55 mg vitamin C supplement increased TBARS level after 1 month, but decreased after 2 months. Moreover, 1,500 mg vitamin C intake was decreased after 1 to 2 months, but increased after 4 months. A possible explanation for the rise in TBARS level is increased production of prostaglandin endoperoxide from vitamin C supplementation [15]. However, we cannot conclude the antioxidant effect of vitamin C supplement by measuring only TBARS level.
It is also intriguing that FSS was significantly decreased after 100 mg of vitamin C supplementation. By comparison with our result, twelve weeks of oral antioxidant supplement including 150 mg vitamin C is generally safe, whereas they could not find evidence of any beneficial effect on fatigue [16]. With regard to effect of vitamin C on fatigue, it is reported that the effect depended on the route of administration, not oral intakes of vitamin C but high dose of intravenous vitamin C [17]. Nevertheless, this result suggested that 100 mg of vitamin C supplementation moderated fatigue.
There were also some limitations in this study. First, our foods records might under or overestimate vitamin C and other nutrients. Second, there was the potential for unexpected bias of the researcher. Third, it would be safe to conclude the antioxidant effect of vitamin C supplement by including other antioxidant enzyme activity. Findings from this study should not be generalized and should be interpreted cautiously. In addition, our study involved free living subjects, whereas, most previous studies housed subjects in the metabolic ward [18]. Nonetheless, this study is one of few randomized trials to clarify concentration of vitamin C by different dose of vitamin C in Korean women. The study is unique because: 1) we compared the plasma levels and urinary excretion of vitamin C after supplementation by 100 mg/day and 2,000 mg/day for Korean women; 2) in study period, subjects were controlled to avoid consumption of fruit and vegetables rich in vitamin C and supplement; and 3) comprehensive outcomes were included, such as oxidative stress biomarkers and fatigue scores as well as plasma and urine vitamin C concentrations.
In conclusion, our findings complement the accumulating body of evidence demonstrating that significant increasing plasma level and urine excretion of vitamin C can be induced by supplementation of vitamin C, and there was no significant effect of vitamin C concentrations in plasma and urine according to dose of supplementation for 4 weeks among Korean women. In addition, the FSS was decreased in 100 mg of supplementation. Additional clinical trial is needed to investigate the vitamin C concentrations in plasma and urinary excretion by vitamin C supplementation for a wide range of doses among Korean.
Go to :
 XML Download