

 PDF
PDF ePub
ePub Citation
 Print
Print


INTRODUCTION
Approximately 13% of the adult population over the age of 18 is obese and has been reported that it has increased more than twice in the past 30 years [12]. Over the next decade, more than half of the world's adult population will be obese [3].
Likewise, in Korea, it has been reported that the rate of obesity has increased by about 13% over the last 20 years. It has been reported that weight gain due to westernized dietary habits and lifestyle is a risk factor for diabetes, cardiovascular disease, various cancers, premature death, and psychological and social problems [567]. Especially for women, weight gain increases with age and the prevalence of obesity has increased rapidly after menopause [4].
A significant amount of research is being conducted, to study and evaluate various effective methods of weight maintenance, for the prevention of obesity as well as for its treatment [8910]. Existing research indicates that self-perceived levels of obesity and the number of attempts to lose weight, among obese individuals, are on the rise [4]. However, in spite of these efforts, the limitations of weight loss remain [11]. Uninformed attempts to lose weight do lead to weight loss accompanied by body fat loss, but as the result lowered basal metabolism rates thereby shift the body into a state in which it can easily gain weight [12]. This vicious weight cycling (WC) results in changes in the body composition, leading to more severe forms of obesity, which consequently have adverse effects on the risk factors pertaining to obesity and, ultimately, mortality.
Failure to maintain weight at the reduced level leads to repeated attempts to control weight, and previously conducted research indicates that weight gain that occurs after multiple failed attempts to lose weight is more harmful to overall health than obesity itself [1314]. A study, pertaining to the regaining of weight after a cycle of weight loss, indicated that one-third of individuals, who lose weight after a 6–12 month-long effort, regain the weight within 1 year [15]. Another study indicated that regaining weight increases abdominal fat, raising the risk of chronic diseases and mortality [16]. To prevent such phenomena, long-term, proactive attempts are required. Research indicates that longer periods of weight maintenance, following weight loss, lead to a reduced probability of weight gain [17].
While multiple factors influence weight loss and its maintenance thereafter, many studies have stressed on the importance of dietary habits of the majority of studies suggest that weight loss is more dependent on diet than exercise [9]. However, during attempts to lose and maintain weight, diet control is as low as 25% [1819]. While earlier studies have analyzed and evaluated the factors that influence weight loss and the maintenance periods, there is still a lack of research on the influence of adherence levels to the diet as well as acting in accordance with education on nutrition, on weight loss and maintenance.
The purpose of this study was to reveal the possibility of solving the limitations through the importance of intensive nutrition intervention to those who frequently attempt to lose weight and consequently go through a vicious cycle of weight recycling.
MATERIALS AND METHODS
Study period and participants
The study period was performed from December 2015 to September 2016 with the approval of Kyung Hee University Bioethics Review Committee (IRB No. KHSIRB 2015-029).
The participants of this study were healthy 20–40 years women living in Suwon city, who did not attempt to lose weight through regular physical activity or diet within the last 6 months. Women with body mass index (BMI) 25 kg/m2 and more than 30% of body fat were recruited. If any of them have experienced orthopedic injuries for the past 6 months or have diabetes, hypertension, hyperlipidemia, musculoskeletal and cardiovascular disease, or were judged not suitable from the PAR-Q & YOU questionnaire (Canadian Society for Exercise Physiology, Ottawa, Canada), were excluded from this study.
After thoroughly explaining the purpose of the study, contents, procedures, and precautions, the applicant voluntarily participated in the study after receiving the consent form from the applicant.
A total of 43 applicants applied to the study, but 4 applicants who did not meet the selection criteria were excluded and 39 participants started the study. They were classified into the WC (≥ ±5% of the original body weight) group and the non-weight cycling (NWC) group during the study intervention, 9 (4 in WC group and 5 in NWC group) of the initial 39 participants were dropped out due to difficulties in time adjustment, health problems, and personal circumstances. Therefore, the data were finally used in the analysis of a total of 30 individuals (18 in WC group and 12 in NWC group).
Study design
This intervention study consisted of nutritional and exercise interventions which were conducted on all 30 participants, for the first 12 weeks; and was discontinued in the last 12 weeks. In the initial 12-week dietary and exercise intervention period, 7 sessions of individual nutritional education were provided to all the participants (week 0, 2, 4, 6, 8, 10, and 12) and exercise sessions were conducted 3 times a week. On week 24, surveys and individual interviews were conducted, to evaluate the state of maintenance after weight loss.
All the measurement items were measured thrice; 1) prior to the study (week 0; before the start of the intervention), 2) in the middle of the study (week 12; after the intervention had ended), and 3) after the study (week 24; after the study period had ended). The measurement included dietary intake details (24-hour recall) through food diaries, demographic details through surveys, dietary habits, level of knowledge on sodium intake, frequency of sodium intake, quality of life (QOL), weight, height, waist and hip measurements (physically measured), body fat and skeletal muscle (Karada scan, Omron, Japan), level of hormones relating to energy metabolism and stress, insulin, leptin, thyroid stimulating hormone (TSH, measured through blood sampling), and level of stress hormones — saliva cortisol. In addition, through a face-to-face counselling session with a professional nutritionist, the levels of adherence to dietary prescriptions and nutritional education, behavioral changes, and self-efficacy were measured.
Intervention
1) Dietary intervention
In the initial 12-week nutritional and exercise intervention period, 7 sessions of individual nutritional education were provided to all the participants (week 0, 2, 4, 6, 8, 10, and 12) in 30-minute sessions. Prior to the beginning of the study, face-to-face individual interviews were conducted with each participant to identify dietary intake details, and a survey was conducted to identify basic details such as dietary habits, level of knowledge on sodium intake, frequency of sodium intake and QOL. Dietary prescriptions were in accordance with the guidelines for clinical nutrition management published by the Korean Dietetic Association [20] depending on the age, height, weight, and level of activity of each participant, assigning recommended nutrient intake (RNI). Individual diet consumptions were prescribed at 70% of the RNI, following individual counselling sessions after the collection of the food diaries.
To ensure uniformity in the educational content, a protocol was developed using guidelines for obesity treatment, dietary habits and meal development based on the content of the protocol (Table 1), the participants were asked to prioritize the items requiring behavioral adjustments, and tailored education was offered to each participant, depending on the compliance and the level of acceptance of the educational content.
Table 1
Nutrition education intervention contents

![]()
The content of the protocol was developed into a leaflet, to be used as educational material; before each education session, the content from the prior session was confirmed and reinforced, and changes were evaluated by comparison with the past sessions. In addition, participants were educated on the diagnosis and causes of obesity, and the units of food exchange using a food model. Information on the individual daily consumption allowance, mealtime considerations and knowledge on eating out was provided, along with providing cookbooks that focus on reducing abdominal fat. Various methodologies on setting realistic goals were proposed, and behavioral changes and consistency in dieting were encouraged.
2) Exercise control
All participants performed routine exercise at all visit, under the supervision of a professional trainer for about 70 minutes, 3 times a week. At each visit, sessions started with simple stretching and 30 minutes of indoor bike (75XLII; Combi, Tokyo, Japan) and 30 minutes of treadmill (Taeha IT-6025; Taeha Mechatronics Co., Ltd., Anyang, Korea) exercise was performed.
Statistical analysis
All data were analyzed using the Statistical Package for the Social Science (SPSS) version 23.0 (IBM, Seoul, Korea) and the continuous variables were expressed as the mean and standard deviation (SD), and the discrete variable is denoted by No. (%). The change values before, during, and after the study were analyzed using the repeated measure design 2-way analysis of variance (ANOVA). Individual analyses that showed significant differences were performed using the non-parametric independent and dependent test method (Mann-Whitney) and least significant difference (LSD) was used for the post hoc test. The significance of discontinuous frequencies was analyzed using the χ2 test. All statistical analysis results were verified to be significant at p < 0.05 level.
RESULTS
General characteristics, anthropometrics
The general characteristics are listed in Table 2. The average age of the participants was 36.3 ± 8.5 years.
Table 2
Change in anthropometry and body composition, hormonal measurement between 2 groups

Values are mean ± SD.
NWC, non-weight cycling; WC, weight cycling; BMI, body mass index; WHR, waist circumference/hip circumference ratio; TSH, thyroid stimulating hormone; SD, standard deviation; ANOVA, analysis of variance.
Significantly different between at WC and NWC by repeated measures ANOVA *p < 0.05, †p < 0.01, ‡p < 0.001.
![]()
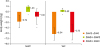
Dietary and exercise interventions at 12 weeks significantly reduced body weight in both groups, and increased again at week 24, with a more positive change in the WC group than in the NWC group. Significant interaction and main effects were observed between the groups at each time point (p = 0.002). There was also a significant difference between the groups in terms of time (p < 0.001).
Similarly, changes in BMI also showed more positive change in the WC group than in the NWC group. Significant interaction and main effects were observed between the groups at each time point (p = 0.032). There was also a significant difference between the groups in terms of time (p < 0.001) (Table 2, Figure 1).
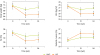 | Figure 1Change in body weight, BMI, fat and skeletal muscle between NWC and WC.
BMI, body mass index; NWC, non-weight cycling; WC, weight cycling.
*Significant interaction effect and main effect between NWC and WC by time. †Significantly different from 12 week. ‡Significantly different from 24 weeks.
|
Changes in waist circumference, hip circumference, waist circumference/hip circumference ratio (WHR) also showed the same pattern, with a more positive change in the WC group than in the NWC group. Significant interaction and main effects were observed between the groups at each time point (p = 0.003). There was also a significant difference between the groups in terms of time (p < 0.001).
Twelve weeks of intervention significantly reduced body fat in both groups, and increased again at week 24, with a more positive change in the WC group than in the NWC group. On the other hand, skeletal muscle was increased in both groups, and decreased again at week 24. There was no significant difference between groups at each time point, but there was a significant difference between groups in terms of time (p = 0.018) (Table 2, Figure 1).
Hormonal changes
Dietary and exercise interventions at 12 weeks significantly reduced insulin in both groups, with a rebound at week 24. There was no significant difference between groups at each time point, but there was a significant difference between groups in terms of time (p < 0.001).
Change in leptin also showed the same pattern, with a more positive change in the WC group than in the NWC group. There was no significant difference between groups at each time point, but there was a significant difference between groups in terms of time (p < 0.001) (Table 2).
Nutritional intake
The mean calorie intake before intervention in both groups exceeded the average daily caloric intake of 1,764 kcal/day of Korean people, which was published in the National Health and Nutrition Examination Survey in 2014. However, after 12 weeks of life-style improvement, both the NWC group and the WC group showed decreased intake level and again increased at week 24 but did not exceed the original level. There was no significant difference between the groups at each time point, but there was a significant difference between the groups (p < 0.001), and the difference between the groups was significant (p < 0.001).
Carbohydrate protein and fat intake were reduced after 12 weeks of intervention. There was no significant difference in the carbohydrate intake and protein intake between the groups at each time point, but there was a significant difference between the groups (p < 0.001), and the difference between the groups excluding the time was significant (p = 0.003).
Change in sodium intake was twice as much as the maximum intake of 2,000 mg, which was suggested by the Korean Dietary Reference Intake [30]. In the NWC group, after about 12 weeks, the intake was reduced by about half, which did not deviate significantly from that of the Korean Dietary Reference Intake, but increased to about the same level as before the intervention for 24 weeks. In the WC group, the intake was similar to that of Korean nutrition intake after 12 weeks, and increased after 24 weeks, but decreased significantly compared to before intervention. There was no significant difference between the groups at each time point, but there was a significant difference between the groups (p < 0.001), and the difference between the groups excluding the time was significant (p = 0.002).
Fiber intake was less than 20–25 g of daily dietary fiber intake of Koreans in both groups. In the NWC group, dietary fiber intake was abundant at week 0, but decreased steadily until week 24. In the WC group, the nutritional intervention effect was increased by increasing the intake after 12 weeks, but decreased again after 24 weeks. There was no significant difference between the groups at each time point, but there was a significant difference between the groups (p < 0.001), and the difference between the groups excluding the time was significant (p = 0.002) (Table 3, Figure 2).
Table 3
Change in food intake between NWC and WC
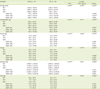
Values are mean ± SD.
NWC, non-weight cycling; WC, weight cycling; R, repeated measures ANOVA; M, Mann-Whitney test; W0, baseline; W12, week 12; W24, week 24; Δ, changes; SD, standard deviation; ANOVA, analysis of variance.
Significantly different between at WC and NWC by Mann-Whitney and repeated measures ANOVA *p < 0.05, †p < 0.01, ‡p < 0.001.
![]()
Eating habit
Except for the regularity items of meal time (p = 0.005), there were no significant differences between groups in the other questionnaire.
Sodium intake index score
Sodium intake index score in both groups were reduced at week 12 and increased again at week 24, with a more positive change in the WC group than in the NWC group. There was no significant difference between groups at each time point, but there was a significant difference between groups in terms of time (p < 0.001).
QOL
The QOL in both groups was significantly reduced, and increased again at week 24. There was no significant difference between groups at each time point, but there was a significant difference between groups in terms of time (p = 0.001).
Adherence to the diet prescription
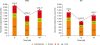
Dietary and exercise interventions at 12 weeks significantly reduced calorie intake in both groups, and increased again at week 24, with a more positive change in the WC group than in the NWC group. There was a significant difference between the groups (p < 0.001), and the difference between the groups excluding the time was significant (p < 0.001) (Table 4, Figure 3).
Table 4
Change in percent of intake to RNA between NWC and WC

Values are mean ± SD (%).
RNI, recommended nutrient intake; NWC, non-weight cycling; WC, weight cycling; SD, standard deviation; ANOVA, analysis of variance.
Significantly different between at WC and NWC by repeated measures ANOVA *p < 0.001.
![]()
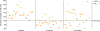
Comparison of weight loss
The degree of weight loss in NWC group and WC group showed significant difference between 12 and 0 weeks (2.7 ± 2.2 vs. 6.2 ± 2.8 kg) at p = 0.001 level. The differences between 24 and 12 weeks were 1.4 ± 1.2 and 0.5 ± 1.9 kg, which there was no significant difference. The differences between 24 and 0 weeks were 1.3 ± 1.8 and 5.7 ± 3.4 kg, which there was significant different (p < 0.001) (Figure 4).
DISCUSSION
This study examined the effect of 12-week intensive dietary and exercise intervention program on body composition and stress-related hormones in obese women and to examine the residual effect after the intervention.
The subjects of this study were 30 obese women in their 20s, 30s, and 40s, with a BMI of over 25 kg/m2 and over 30% in body fat; the variance of their original weight was ≥ ± 5%, based on their previous weight loss attempts. They were divided into two groups: the WC group, comprising 18 women, and the NWC group, comprising 12 women. The 2 groups were subject to a 12-week nutritional/exercise intervention. This study also investigated the influence of consistent adherence to improved lifestyles on WC after the cessation of the nutritional/exercise intervention for 12 weeks.
Throughout the 12-week nutritional/exercise intervention, the physical measurements, body composition, hormones, meal intake details, dietary habits, and QOL changed positively in both the groups; the level of these changes was higher in the WC group compared to the NWC group. The cessation of the 12-week nutrition/exercise intervention resulted in WC in both groups; however, the level of weight regain was lower in the WC group compared to the NWC group. All the positive effects in the WC group appear to be attributable to the higher level of adherence to a diet of 70% of the RDA.
A study by Shinkai et al. [21], which focused on the changes in physical measurements and body composition following weight loss, indicated that a 12-week exercise program and dietary restrictions show positive results in the body composition of obese women. A study of 72 obese adults who went through an 8-week nutrition/exercise intervention [22] indicated significant reductions in weight, body fat ratio, BMI, and waist circumference. The results of the present study also indicate that there are significant reductions in both the WC and NWC groups, in terms of the physical measurements and body composition results, with the WC group displaying a greater reduction.
When we look at changes in energy metabolism and stress-related hormones that affect weight loss, the general physiology of insulin is to regulate glucose in the blood, increase absorption of amino acids related to protein and fat metabolism, and promote protein and lipid synthesis [23]. Ahn et al. [24] reported that diabetic women improved their dietary habits for 12 weeks and showed significantly decreased insulin levels. The general physiology of leptin secreted by adipocytes plays an important role in controlling appetite, including controlling food intake and energy consumption.
Levels of leptin generally change with long-term dietary control and exercise [2526]. Kim et al. [27] reported that 12-week nutrition and exercise intervention for obese middle-aged women resulted in a significant decrease in leptin due to decreased energy consumption and increased body fat. In the present study, the insulin and leptin levels were significantly decreased in both groups, consistent with the results of previous studies. In the case of hormones associated with energy metabolism, there is also a correlation with increases and decreases in body fat and skeletal muscle [28]. In the case of insulin, it is believed that carbohydrates are stored in liver and muscle to lower blood sugar and have a positive effect on metabolic diseases [29]. In addition, leptin has a function to regulate the human appetite and fat metabolism, so that the body fat is reduced through exercise and the concentration of leptin in the blood is decreased.
The average calorie intake of this study's participants (both the groups), prior to the intervention, was over 1,764 kcal/day, which is close to the average daily calorie intake for females as proposed by the 2014 National Health and Nutrition Study. However, through lifestyle improvements, this figure reduced to below the standard levels, after 12 weeks, in both the NWC and WC groups. While there were increases after the non-intervention period had ended, a below-standard calorie intake was observed in the WC group.
The NWC and WC groups obtained fewer calories from carbohydrates compared to the corresponding results of the 2014 National Health and Nutrition Survey of 63.8:14.6:21.6, and the proportion of calories absorbed from fat increased over time. Lifestyle change resulted in lower calorie intakes, with lower consumption of carbohydrate and a higher consumption of protein and fat. These results indicate that the energy shortfall was compensated by the consumption of protein and fat. Based on the results of previously conducted research, which indicated that low-carbohydrate-high-protein diets are more effective in weight reduction and maintenance when compared to diets in which other nutrients are restricted, it is suggested that a consistent decline in carbohydrate intake might affect weight loss [30]. In terms of sodium intake, both the groups were found to consume approximately twice the amount of the daily maximum recommended sodium intake (2,000 mg) proposed by Korean Dietary Reference Intake [30]. The sodium intake in both the groups were reduced by about half, staying within the range of the recommended sodium intake. At week 24, this figure increased again. However, in the case of the WC group, there was a reduction of about 650 mg compared to the consumption levels prior to intervention. Excessive consumption of sodium increases the activity of the microorganisms involved in the formation of fat, increases the size of the fatty cells, and results in lipid metabolism disorders [31]. Kim et al. [32] indicated a link between higher rates of obesity and higher sodium intakes. When the participants in that study were divided into 5 groups based on sodium intake, and adjusted for age, calorie intake, chronic diseases, and health behavior variables, the group than consumed less than 2,000 mg of sodium had reduced rates of obesity compared to the groups that consumed more than this amount. The reduction in the sodium intake of the WC group in this study goes hand-in-hand with reduced frequencies of sodium intake; this appears to influence the magnitude of weight reduction as well as the weight maintenance after reduction in the WC group, when compared to the NWC group.
In relation to the dietary fiber intake of the participants, the intake levels were lower than the standard intake level of 20–25 g. In the case of the NWC group, the dietary fiber intake was high in week 0; however, this consistently decreased until week 24. This appears to result from the consistent reductions in the meal intake. In the case of the WC group, the nutritional intervention results were visible between week 0 and 12; however, this figure reduced again at week 24, after the period of non-intervention. Going by the results of a study, which reported that increased dietary fiber intakes inhibit the absorption of fat and protein, and reduce calorie intake, thereby influencing weight reduction [33], the increase in dietary fiber intake appears to have played an effective role in weight reduction in our study.
Based on the aforementioned information, both the NWC and WC groups experienced weight loss following a 12-week period of lifestyle improvements; the magnitude of weight loss was larger in the WC group. In addition, throughout the 12-week non-intervention period, both the groups displayed a trend of weight gain; however, in the WC group, the weight gain was not as high as in the NWC group, indicating a weaker WC phenomena. Frequent and repeated weight loss/regain ultimately leads to a vicious cycle involving a lower base metabolism and activity level [34]. In spite of this, the WC group showed more positive results compared to the NWC group, in this study. This appears to be a consequence of the level of nutritional intervention adherence.
The level of adherence to nutritional intervention is the response level to the intervened recommendations, including the level of study participation, individual participants' will to lose weight and the presence of efforts. High participation rates, proactive self-monitoring, and dedication to making lifestyle changes have been pointed out as critical factors in successful weight loss [35].
On reviewing groups' adherence to dietary prescriptions, during the 12-week intervention period, the NWC group had an intake of 120.2% ± 16.7% compared to the prescribed diet (70% of the RDA) and the WC group had an intake of 84.6% ± 17.3%, with the latter exhibiting higher adherence levels; this is thought to have led to a larger reduction in weight. At week 24, after the cessation of nutritional intervention, both groups displayed increased intake levels compared to the intervention periods; however, as the WC group remained at about 100% of the prescribed diet, it appears that the participants in this group put more effort into preventing WC, by adhering to the prescribed diet in the weight maintenance period. The results relating to dietary habits indicate that the regularity of meals improved with time, suggesting that adhering to customized nutritional intervention has positive effects on weight reduction.
Exercise independently also plays a very important role in weight loss as well as nutritional intervention. Aerobic exercise is a representative method for effectively reducing body fat and preventing cardiovascular disease [36]. In a study of obese middle-aged women, weight, BMI, and body fat percentage were significantly reduced by aerobic exercise 3 times a week for 12 weeks [37] and Kim et al.'s study [38], weight, BMI, body fat percentage, waist circumference, and WHR were significantly decreased. In addition, Choi et al. [39] reported that obesity male middle school students who had aerobic exercise 4 times a week for 8 weeks showed a significant decrease in insulin and leptin levels showing that exercise increased basal metabolic rate and energy maintenance homeostasis. Our study strictly controlled the level and frequency of exercise in each individual, so that the result of our study can point out the effect of dietary modification.
Obesity has negative effects on physical and mental health and lowers the overall QOL of obese people [40]. Therefore, the QOL of obese patients is an important consideration for obesity treatment and management [41]. In the study of obesity-related QOL, high-level obesity group had lower QOL in physical health, work and housework, and daily life than the overweight group or the mild obesity group. In the study of Chaung and Kim [42] and as well as a study by Chun [43], obesity-related QOL of female college students in Korea was found to be lower than that of normal group in physical health, sexuality, and food-related QOL. Similarly, in this study, weight loss related to obesity was associated with an increase in the QOL scores in both groups, suggesting that weight loss may also improve the QOL of obese.
This study is significant as it explores the extent to which adherence to lifestyle improvement programs can influence weight loss and subsequent maintenance, as well as the related factors. The strong points of this study include supervised 60-minute exercise sessions conducted 3 times a week, weight checks, as well as biweekly one-on-one nutritional education sessions. The present study sought to propose a method for resolving the vicious cycle of weight swings, for individuals who have experienced WC due to frequent weight loss efforts. Improving meal habits by adhering to a prescribed diet and acting in accordance with the attained nutritional knowledge was found to positively influence weight reduction and subsequent maintenance, indicating that they may help prevent WC. As the changes took place voluntarily, the long-term continuation of this program will not only impact weight loss, but also the prevention of chronic diseases relating to obesity and mental health. Considering that the effects were pronounced in the group with a higher level of adherence to nutritional intervention, future studies should focus on the factors influencing the level of adherence to nutritional intervention and the methods to increase the levels of such factors.
CONCLUSION
In summary, the results of this study suggest that the life-style improvement methods through dietary and exercise intervention have significant effects on body anthropometry, body composition, hormones, dietary intake, and QOL, it was confirmed that the effect of obesity after weight loss was effective for obese who experienced a large change in body weight due to the yo-yo. The results of this study showed that intensive nutrition intervention in obese subjects with yo-yo experience still can have significant weight loss and maintain the lifestyle even after the discontinuation of the program. In the future, it will be necessary to investigate the individual factors influencing the degree of adherence to nutritional intervention and to study ways to improve it.
 XML Download