

 PDF
PDF ePub
ePub Citation
 Print
Print


INTRODUCTION
Homeostasis is a state which body maintains physical functions and internal environments within a normal range, and the ability to keep homeostasis is generally decreased with aging [1]. This aging-accompanied change is a natural phenomenon, and reduced homeostatic control does not always contribute to the development of diseases. Normal range of aging homeostasis should be set in a different range from that of homeostasis in young adults. Altered conditions with healthy aging homeostasis are distinguishable from pathophysiological conditions because those are in part reversible and controlled [2].
Sirtuin (SIRT) is a well-known regulator of nutrients (glucose and lipid) metabolism and aging processes in nicotinamide adenine dinucleotide (NAD)+-dependent (as protein deacetylase and/or mono adenosine diphosphate [ADP] ribosyltransferase) and -independent ways [34]. Among 7 SIRTs, SIRT1 was extensively investigated, and its regulatory roles and working mechanisms were identified relating to the effect of caloric restriction on life span [567].
SIRT1 exerts its effects by activating down-stream targets (e.g. forkhead box O1, peroxisome proliferator-activated receptor (PPAR) gamma, coactivator 1 alpha, and PPAR gamma), which differed by types of target tissues and stimulus [8910]. Although the implication that SIRT1 can be a probable biomarker of aging is evident, little evidence was reported to support the hypothesis in human studies.
Enormous efforts were invested to identify metabolic biomarkers of aging utilizing the up-to-date technologies. Several models for estimating biological age (e.g. vessel/vascular age and hormonal age) were already introduced and applied in clinical setting [1112131415]. A recent remarkable work developed the metabolic age score, the way to measure biological age via metabonomics [16]. Considering the significance of SIRT in aging, research should focus to apply SIRT to reflect aging and its related physiological/pathophysiological processes. However, evidence has not yet reported to validate serum SIRT activity as a biomarker of aging.
Therefore, we hypothesized that SIRT is a potential biomarker reflecting aging. To test this hypothesis, we identified the pattern of serum SIRT1 activity according to age and sex, and investigated how serum SIRT1 activity was correlated with other metabolic parameters in Korean adults. Because aging homeostasis is different from normal metabolic homeostasis, we need to identify the appropriate biomarkers for aging homeostasis, and try to provide evidence to address whether serum SIRT activity may be utilized as a biomarker of aging homeostasis.
MATERIALS AND METHODS
Study subjects
Fasting serum samples and a subset of data from 250 healthy adults (122 men and 128 women) were provided by the Biobank of Jeju National University Hospital, a member of the Korea Biobank Network. Serum samples were collected from subjects who visited the healthcare center of Jeju National University Hospital from 2009 to 2015. Fifty subjects for each age group (20's, 30's, 40's, 50's, and over 60's) were randomly selected and provided for analysis. The current research involving human participants has been reviewed by the Institutional Review Board (IRB) of Seoul Women's University (IRB-2015A-10).
Measurements
A subset of routine laboratory data was provided by the Biobank of Jeju National University Hospital. The aspartate aminotransferase (AST)/alanine aminotransferase (ALT) ratio (AAR), atherogenic index (AI), and low-density lipoprotein-cholesterol (LDL-C) were calculated by the following equations [17]:
And basal metabolic rate (BMR) was estimated by Harris and Benedict equation as follow [18]:
SIRT1 activity
SIRT1 activity was measured using a SIRT1 assay kit from Abcam (Cambridge, UK). Serum samples were mixed with specific substrates, NAD, and developed at room temperature. Then, SIRT1 activity was measured using a fluorometric microplate reader at 340/440 nm.
Statistical analysis
All statistical analyses were performed using SPSS Statistics 23 (SPSS Inc., Chicago, IL, USA). Data were expressed as means ± standard deviation (SD). Student's t-test was performed to compare the differences in means between two groups, and 1-way analysis of variance (ANOVA) was performed to assess the differences in means across the age groups. Correlations between SIRT1 activity and other parameters were analyzed by Pearson's correlation analysis. Statistical significance was defined as p < 0.05.
RESULTS
Subject characteristics were given in Table 1. Men and women differed descriptively in a number of variables, including age, height, body weight, body mass index (BMI), waist circumference (WC), systolic blood pressure (SBP), diastolic blood pressure (DBP), AI, and BMR. Also, serum levels of blood urea nitrogen (BUN), creatinine, AST, ALT, AAR, gamma-glutamyl transferase, TG, HDL-C, and LDL-C were different between men and women.
Table 1
Subject characteristics

Data are expressed as mean ± SD; p values for comparisons of means (2-sided t-tests) between men and women.
BMI, body mass index; WC, waist circumference; HbA1c, hemoglobin A1c; SBP, systolic blood pressure; DBP, diastolic blood pressure; BUN, blood urea nitrogen; AST, aspartate aminotransferase; ALT, alanine aminotransferase; AAR, AST/ALT ratio; γ-GTP, gamma-glutamyl transferase; TG, triglyceride; TC, total cholesterol; HDL-C, high-density lipoprotein-cholesterol; LDL-C, low-density lipoprotein-cholesterol; AI, atherogenic index; BMR, basal metabolic rate; SIRT, sirtuin; SD, standard deviation.
![]()
Tables 2 and 3 showed age-related alterations of anthropometric and metabolic parameters in men and women. Height was significantly decreased with age in men and women, and WC was significantly altered with age in only women. Serum levels of BUN, AST activity, AAR, and LDL-C were significantly different among age groups in men. AST activities were significantly higher in men in their fifties than the other age groups. Men aged older than 60 years had high AAR. AI score was getting higher from twenties to fifties in men. BMR decreased with age and was significantly lower in their fifties and older compared with men in their twenties. Serum levels of hemoglobin A1c (HbA1c), SBP, DBP, BUN, AST activity, TG, TC, and LDL-C were significantly different among age groups in women. Women in their thirties had the highest levels of WC and DBP, even though body weight and BMI did not differ significantly by age groups in women. HbA1c showed age-dependent increases in women. TG, TC, BUN, and AI score were higher in women more than 60 years of age. BMR was significantly lower in women in their forties and older compared with women in their twenties. SIRT1 activities were altered by age and sex. Women in their thirties show the highest SIRT1 activities, even though SIRT1 activities were lower in their thirties than the other age groups in men.
Table 2
Aging-related alterations of variables in men
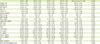
Data are expressed as mean ± SD; p values from 1-way ANOVA to assess the differences in means across the age groups.
BMI, body mass index; WC, waist circumference; HbA1c, hemoglobin A1c; SBP, systolic blood pressure; DBP, diastolic blood pressure; BUN, blood urea nitrogen; AST, aspartate aminotransferase; ALT, alanine aminotransferase; AAR, AST/ALT ratio; γ-GTP, gamma-glutamyl transferase; TG, triglyceride; TC, total cholesterol; HDL-C, high-density lipoprotein-cholesterol; LDL-C, low-density lipoprotein-cholesterol; AI, atherogenic index; BMR, basal metabolic rate; SIRT, sirtuin; SD, standard deviation; ANOVA, analysis of variance.
![]()
Table 3
Aging-related alterations of variables in women
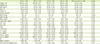
Data are expressed as mean ± SD; p values from 1-way ANOVA to assess the differences in means across the age groups.
BMI, body mass index; WC, waist circumference; HbA1c, hemoglobin A1c; SBP, systolic blood pressure; DBP, diastolic blood pressure; BUN, blood urea nitrogen; AST, aspartate aminotransferase; ALT, alanine aminotransferase; AAR, AST/ALT ratio; γ-GTP, gamma-glutamyl transferase; TG, triglyceride; TC, total cholesterol; HDL-C, high-density lipoprotein-cholesterol; LDL-C, low-density lipoprotein-cholesterol; AI, atherogenic index; BMR, basal metabolic rate; SIRT, sirtuin; SD, standard deviation; ANOVA, analysis of variance.
![]()
Correlation analysis displayed that SIRT1 activity was positively correlated with serum TG concentrations in men, and with WC, SBP, DBP, and serum TG in women (Table 4). SIRT1 activity was negatively correlated with a hepatic function marker, AAR in women (r = −0.183, p = 0.039). Positive correlation was observed between SIRT1 activity and BMR in women (r = 0.222, p = 0.027), but not in men (r = −0.012, p = 0.903).
Table 4
Correlation of each parameter with serum SIRT1 activity

r = correlation coefficient.
SIRT, sirtuin; BMI, body mass index; WC, waist circumference; HbA1c, hemoglobin A1c; SBP, systolic blood pressure; DBP, diastolic blood pressure; BUN, blood urea nitrogen; AST, aspartate aminotransferase; ALT, alanine aminotransferase; AAR, AST/ALT ratio; γ-GTP, gamma-glutamyl transferase; TG, triglyceride; TC, total cholesterol; HDL-C, high-density lipoprotein-cholesterol; LDL-C, low-density lipoprotein-cholesterol; AI, atherogenic index; BMR, basal metabolic rate.
![]()
DISCUSSION
Chronological age is a representative counting of aging; however, it often does not correspond to the biological age of the individual. The biological age may be affected by genetic and environmental factors including diet, activity level, and metabolic/hormonal changes. SIRT is a key regulator of aging-related metabolic changes [5192021], and may be a potent biomarker of aging. However, practical application of SIRT as a biomarker of aging has not yet evidently reported or been available. The present results revealed that aging-related alterations of SIRT1 activity are distinct especially in women and that SIRT1 activity is significantly correlated with several anthropometric and metabolic parameters including BMR in women.
To test the hypothesis that serum SIRT1 activity may be used as a biomarker of aging, serum samples were provided via the Korean Biobank Network. Total 250 serum samples and a subset of data for 5 different age groups were provided. In general, several values of anthropometric and metabolic parameters were lower in women compared with those in men except HDL-C. Height loss with age displayed in men and women. Age-related differences in height have been observed in various studies including the Baltimore longitudinal study of aging [22]. Circulating levels of TG, TC, LDL-C, and AI were significantly increased at 60 years and over in women, but not in men. Alterations in lipid profiles are known features in postmenopausal women. Men aged more than 60 years showed the highest AAR. Previous study regarding the effect of aging on the liver in healthy male subjects demonstrated negative correlations between age and both liver volume and liver blood flow [23]. SIRT1 activity did not differ significantly between men and women.
Most human studies on SIRT1 investigated the effects of calorie restriction on SIRT1 rather than identifying the direct effects of SIRT1 on aging. Caloric restriction induces SIRT1 activation in human [24]. As in the above-mentioned study, human studies related to SIRT1 focused on the effects of caloric restriction on aging-related metabolic alterations. From these findings, the plausible explanation regarding SIRT1 and aging is that SIRT1 and its agonists contribute to the extension of lifespan by mimicking the effects of caloric restriction. Recent approaches to investigate the role of SIRT1 on aging have utilized single nucleotide polymorphisms (SNPs) to study the relationship between SIRT1 and longevity in human. The association between SIRT1 SNPs and longevity in healthy subjects was significant [25]. However, another study showed that common variants in SIRT1 were not associated with longevity in the Chinese population [26]. Collectively, there are limited evidences to explain the role of SIRT1 in human aging and aging process related to changes in BMR, WC, and other parameters, and further studies are needed.
In this study, a sex-dependent pattern was observed. Serum SIRT1 activity peaked at forties in men and at thirties in women. After the peaks, the SIRT1 activities were reduced with age, especially in women. Also, correlation between SIRT1 activity and BMR was significant only in women, and the direction of the correlation between the 2 parameters was opposite even though the correlation was significant only in women. Previous studies on SIRT activities suggested a sex-specific pattern of the SIRT activity [27]. Negative correlation was shown between SIRT1 deacetylase activity and age in men but not in women, and the SIRT1 activity was measured in skin tissues samples obtained from non-sun exposed areas of the pelvic region [27]. Besides this, it is hard to find the evidence regarding the sex-specific pattern of SIRT activity or serum SIRT activity in human. Therefore, current findings are meaningful in that they provide evidence that serum SIRT1 activity can be successfully measured and that the sex-dependent pattern of serum SIRT1 activity exists.
Another interesting finding is that the correlation between serum SIRT1 activity and BMR is sex-dependent. Positive correlation between the 2 parameters was observed only in women. So far, evidence was not reported regarding the direct regulation of SIRT1 on BMR. However, various experiments using SIRT1 activators (e.g. resveratrol, S17834, and SRT1720) demonstrated that SIRT1 regulates energy expenditure by activating adenosine monophosphate (AMP)-activated protein kinase, which senses changes in AMP/adenosine triphosphate (ATP) ratio [282930]. Also, resveratrol treatment in mice increased energy expenditure accompanying by increases in oxygen consumption and the expressions of thermogenesis-related markers in brown adipose tissue [31]. Considering that BMR is the main component of daily energy expenditure, these mechanisms may support the observed positive correlation between SIRT1 activity and BMR. We cannot explain why the correlation was not observed in men at this point. Age-stratified analysis may be useful to explain the sex-dependent differences in the correlation between SIRT1 activity and BMR. In addition, BMR values used in this study are from the estimation by Harris and Benedict equation [18] utilizing body weight, height, age, and sex. The indirect estimation of BMR may influence the correlation between BMR and other parameters, and cause misinterpretation.
Although an age-related pattern of serum SIRT1 activity and the positive correlation between serum SIRT1 activity and BMR have been observed in women, it is difficult to firmly conclude that serum SIRT1 activity is a reliable biomarker of aging and to generalize this finding to general population. It is possible that findings in this study reflect regional characteristics because serum samples were provided from Jeju National University Hospital. Nonetheless, we propose that SIRT1 activity can be successfully measured in human serum and that serum SIRT1 activities have an aging-related distinct pattern, which suggests the possibility that serum SIRT1 activities may be utilized as a biomarker of aging. In addition, positive correlation between SIRT1 activity and BMR in women suggests that serum SIRT1 activity may reflect energy expenditure well in human. Taken together, these findings will enable the application of serum SIRT1 activity to estimate biological age of an individual.
 XML Download