

 PDF
PDF ePub
ePub Citation
 Print
Print


Introduction
Residual chemicals are the traces of a certain chemical or its breakdown products that remain in food products. The main concern is when residual chemicals are detected as unacceptable levels, which indicates that chemicals may not have been used in accordance with health control standard. In order to minimize the risks of health in consumers, it is important to manage the amount of residual chemicals to be the safe levels of intake [12].
Ministry of Food and Drug Safety in Korea (MFDS Korea) established maximum residue limit (MRL) of residual chemicals such as pesticide for food commodities, and the MRLs are multiplied by the food commodity intakes to assess the exposure to residual chemicals [34]. The MRL is the maximum concentration of a chemical residue that is legally permitted to be remained in agricultural, animal, and marine food. This concentration is expressed in milligrams of chemical residue per kilogram of the food (mg/kg). The acceptable daily intake (ADI) for humans is defined as an estimate of the amount of a chemical that can be ingested daily over a lifetime without appreciable risk to health. The ADI is used widely to describe safe levels of intake; other terms used are the reference dose (RfD) and tolerable intakes that are expressed on either a daily (TDI or tolerable daily intake) or weekly basis. MRL values of various chemicals are set up for corresponding food products domestically and globally to prevent the estimated intake of residues from exceeding the ADI and other toxicological values [567]. And comparing the estimated intake of toxic chemicals through diet with toxicity reference values (TRVs) like ADI is one of the most commonly used methods for chemical hazard analysis. It can be presented as a reliable reference because there is a direct relation between those values and the health risks [8].
In order to establish the standards for MRL of toxic chemicals, consumption data of food commodities such as agricultural, animal, and marine foods originated from raw ingredients are needed. The Korea diet databases built by one-day recall survey in Korea National Health and Nutrition Examination Survey (KNHANES) are good resources to estimate intakes of various food commodities. A limitation of the KNHANES databases, however, is that the food intakes surveyed are not based on commodities but ingredients and their mixtures. Therefore, it is needed to standardize the reasonable calculation method of food commodity intakes.
Apples are a cheap fruit, easy to store and transport, abundantly present and marketed all year, thereby being one of popular fruits in the world. Consumption of apples, a rich source of many different bioactive phenolic compounds was found to have association with a reduced risk of various cancers in the lung, colon-rectum, oral cavity, digestive tract and breast [9]. Apple fiber is one of dietary fiber products commonly consumed in the market, and is a water-insolube dietary material which has been reported to increase the fecal weight and promote colon motility [10]. Apple flavonoids improve the availability of nitric oxide and protect the endothelial cells from apoptosis thereby preventing the process of endothelial dysfunction and reducing blood pressure and oxidative stress [11].
In this study, apple and their processed food products were chosen as a model food to accurately calculate food commodity intakes using recently developed Korea food commodity intake calculation software (KFCIC software, Sejong university, Seoul, Korea). Apple (Malus pumila Miller) chosen as one of the agricultural foods is a fruit of deciduous tree in the rose family which has been cultivated as a fruit tree in Korea. Koreans consume apples in a variety of forms such as fresh fruit, juice, nectar, jam, vinegar, and so on [12131415].
The aims of this study were to develop strategies and algorithms of calculating food commodity intake suitable for exposure assessment of residual chemicals by using the food intake database of the KNHANES. Average daily intakes of apples by total respondent, gender, and respondent at 5% upper limit were estimated in this study. In addition, the estimated intake of apples were compared with intakes data in the Korea Health Statistics managed by Korea Centers for Disease Control and Prevention (KCDC). KCDC is an agency that manages the KNHANES, and Korea Health Statistics are national statistics that summarizes the results of KNHANES.
Materials and Methods
Food intake database of the KNHANES
The database of the KNHANES represents food intakes in Korea. The KNHANES was performed every three years from 1998 to 2005, but it was changed to annual survey from 2007. In this study, the food intake databases of the KNHANES in 2008 (4th secondary), 2009 (4th third), 2010 (5th primary), 2011 (5th secondary), and 2012 (5th third) were used to develop calculation strategies for the food commodity intake appropriate to exposure assessment of residual chemicals [1617]. The food intake databases of the KNHANES were collected by survey method asking personal food intakes during the last 24 hours. This method surveys whole foods that were consumed last day, and personal information such as gender, age, and area of residence as well as individual dietary behavior such as types, volumes, and amounts of foods consumed. The food intake databases of KNHANES have encoded food data such as food name (n_fname), food code (n_fcode), food intake (nf_intk) of respondents. In this study, databases were obtained from the KNHANES database (http://knhanes.cdc.go.kr) managed by KCDC. KNHANES dataset is available to the public and approved by the Institutional Review Board (IRB) of the KCDC.
Food recipe data
The food intake databases of the KNHANES include 10 different apple products such as 'Apple, Raw, Fuji', 'Apple, Raw, Aorie', 'Apple, Raw, Hongok', 'Apple, Juice, Concentrated', 'Apple, Juice, Raw (Sweetened)', 'Apple, Juice, Raw (Unsweetened)', 'Apple, Juice, Canned', 'Apple, Jam', 'Apple, Nectar', and 'Apple vinegar'. Among them, many types of 'Apple, Juice', 'Apple, Jam', 'Apple, Nectar', and 'Apple vinegar' are the processed foods made of apple, lemon, salt, sugar, vinegar and so on. In order to calculate intake of raw apple, contents of seasonings such as salt, sugar, vinegar, and so on should be excluded from contents of the apple products. In addition, for reliability for calculation, it was necessary to collect food recipe data based on only verified sources. In this study, the food recipe data were collected from the Korea traditional food portal at the Korean Intellectual Property Office (KIPO), the Korea Food Research Institute (KFRI), the Korea Rice Foodstuffs Association (KRFA), the What We Eat In America - Food Commodity Intake Database (WWEIA-FCID), research papers, food recipes from companies, package labels of processed foods in Korea, and so on.
Average daily intake of participants in the KNHANES
In this study, average daily intake of participants in the KNHANES was calculated by using recently developed Korea food commodity intake calculation software (KFCIC software).
In case of apple, the average daily intakes of 10 different apple products by participants in the KNHANES were calculated through dividing the sum of intakes of apple products by the number of participants in the KNHANES as shown below. In order to estimate the intake of apples within the apple products (mixtures) such as 'Apple, Juice', 'Apple, Jam', 'Apple, Nectar', and 'Apple vinegar', each apple products in the food intake database of the KNHANES were multiplied with the ratio of the apple in the standard recipe.
Average daily intake of respondents who consumed food products
To estimate average daily intake of respondents who consumed food products in the KNHANES accurately, populations of respondents who consumed food products are needed. Total number of people who consumed food products was calculated by gathering data of each respondent in the food intake database of the KNHANES.
In case of apple, the way for calculating the average daily intake of respondents who consumed apple products was developed through dividing the sum of intake of apple products by the total number of respondents who consumed apple products. The sum of intakes of apple products was the same quantity which was used when the average daily intake of apples by participants in the KNHANES was calculated.
Average daily intake by gender
To estimate average daily intake of respondents who consumed food products by gender basis, populations of respondents who consumed food products sorted by gender are needed. Therefore, an algorithm to calculate the number of people who consumed food products sorted by gender was developed. The food intake database of the KNHANES assigned a gender code "1" and "2" for men and women, respectively. The algorithms for counting the number of men and women who consumed food products were developed using the gender code.
The average daily intakes by men were calculated through dividing the sum of intake of food products by men by the number of the men who consumed food products. For women's ADI calculation, similar algorithms were designed.
Average daily intake at 5% upper limit
Algorithms to calculate average daily intake at 5% upper limit were developed. Algorithms of calculating numerical values at 5% borderline of upper intake limit by respondents were designed.
Demographic analysis of food intakes
Demographic parameters of food intakes such as total number of participants in the KNHANES (Table 1), number of people who ate food products, average daily intake of participants in the KNHANES, and average daily intake of respondents who ate food products were calculated by analyzing data from the proper fields of the food intake databases using the Microsoft Excel [18]. Average daily intake of foods were calculated by gender and 5% upper intake limit [1920]. In detail, average daily intake by men, women, and respondent at 5% upper intake limit, respectively were calculated to investigate raw food intakes from its products. Especially, 95% confidence interval, standard deviation of 5% upper intake of food products, and probability density functions were used for calculating 5% upper intake limit (Table 2).
The average daily intake of apples were represented by 4 parameters as follows: 1) the average daily intake by participants in the KNHANES, 2) the average daily intake by respondents who ate food products, 3) the average daily intake by men and women (by gender) who ate food products, and 4) the borderline of average daily intake at 5% upper limit.
Results
Demographic analysis of average daily intakes of apple products
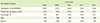
The results of analysis on the average daily intake of apple products by participants in the KNHANES are shown in Table 2. The average amount of daily intake of apple products by participants in the KNHANES were ranged between 28.12 g in 2012 and 38.30 g in 2010, and its mean value was approximate 32.45 g. The ratios of number of consumers who ate all apple products were ranged between 18.3% in 2008 and 25.5% in 2010. It may indicate that one of 4 or 6 people daily consumed at least one apple product. Based on Table 1 and 2, women were found to more consume apple products than men in all periods. The average daily intake of apple products by respondents was 4.50-fold higher than that by the KNHANES participants. The average daily intake by men, women, and respondent at 5% upper limit, respectively were also shown in Table 2. If the ratio of the respondents to the whole participants approached up to 1, their average daily intake might mark almost the same value. Actually, although it kept increasing, the ratio of the average daily intake by the respondents to that of the whole participants is far from 1. The average daily intake by respondents was highest in 2009 (164.97 g), and have tended to decrease over recent years.
The average daily intake by women was 1.13-fold higher than that by men, but recently became similar between men and women. Borderline of daily intake at 5% upper intake limit has been continuously decreased since 2009.
Discussion
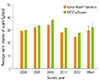
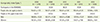
The aims of this study were to develop strategies and algorithms of calculating food commodity intake suitable for exposure assessment of residual chemicals by using the food intake database of the KNHANES. In this study, apple and their processed food products were chosen as a model food to accurately calculate food commodity intakes through the recently developed Korea food commodity intake calculation software (KFCIC software). The result of comparing the estimated average daily intake of apples in this study with those in Korea Health Statistics managed by KCDC was shown in Figure 1. Korea Health Statistics determined the ranking of average daily intake from 1 to 30 on a weight basis (g/day) in the KNHANES. Apples were ranked from 7 to 12 as commonly consumed food from 2008 to 2012. The average daily intake of total apples in Korea Health Statistics were 29.60 g in 2008, 32.40 g in 2009, 34.30 g in 2010, 28.10 g in 2011, and 24.60 g in 2012. The average daily intake of apples by KFCIC software in this study was 2.65 g higher than that by Korea Health Statistics. This difference may be due to the differences between food database used by KFCIC software and Korea Health Statistics. The calculation of average daily intake of apples by KFCIC software includes not only commodity-type foods but also mixed and processed foods based on the standard recipe in the database. On the other hand, the food intake data by Korea Health Statistics have less reflected the intake of apple from mixed and processed foods than KFCIC software has. These results can affect outcome of risk assessment for residual chemicals in foods. Therefore, the accurate estimation of the average daily intake of food commodities is very important.
Conclusion
This study suggests that the use of KFCIC software is reasonable for the calculation of food commodity intake, because it contains all components of apple products including their mixed and processed foods which can be converted into food commodity levels. The calculation strategies can overcome the limitations of existing methods which have calculation errors and are not based on commodities. In addition, if the calculation strategies are connected to the body weight by age and gender, and concentration of residual chemicals in each food in KNHANES, setting the standard for residual chemicals through foods such as MRL and ADI would be more reasonable. The calculation strategies can be expanded to estimate the food commodity intake of all food products, which are suitable for the regulation of residual chemicals and safety assessment.
A gap between the truly representative food intake data of Korean and the data in this study, however, may exist because it was not possible to include the entire food intake data in KNHANES. Moreover, the food recipes in this study may not reflect the actual recipes of foods and even if they were the same product, the recipe was different depending on the reference. Therefore, more data for food intakes and recipes have to be applied to improve the quality of data. This study can contribute to the predictive estimation of exposure to possible residual chemicals and subsequent analysis for their potential risks.
 XML Download