

 PDF
PDF ePub
ePub Citation
 Print
Print


Introduction
Folate (vitamin B9), vitamin B12, and homocysteine (HCY) are involved in one-carbon transfer pathways. In particular, folate plays a key role in the pathways as an acceptor or donor of one-carbon units, and vitamin B12 acts as a coenzyme in the conversion of HCY to methionine by adding methylene from the methylated form of folate. These pathways in turn lead to the biosynthesis of purine and pyrimidine nucleotides, as well as to the methylation of DNA, RNA, proteins, and other molecules [12]. Thus, it has been hypothesized that folate deficiency or vitamin B12 deficiency, accompanied by elevated levels of HCY, may disrupt genomic stability and the normal methylation state of genes [34].
Many epidemiological studies have examined the associations of circulating folate, vitamin B12, and HCY levels with leukocyte telomere length (LTL) [56789101112], which is considered a biomarker of cellular aging [13]. Several mechanisms have been suggested to underlie this association. For example, one proposal is that deficiencies of folate and vitamin B12 influence genomic instability, which results in the attrition of telomere length. Another is that elevated levels of HCY increase oxidative stress independent of vitamin B12 status, which accelerates the attrition of telomere length [314]. Both of these mechanisms have been confirmed in experimental studies [1516], although epidemiological studies have shown inconsistent results regard to the associations of plasma or serum folate and HCY levels with LTL [567891011]; even no association has been found between plasma vitamin B12 levels and LTL [58]. The association between circulating folate levels and LTL has variously been found to be U-shaped [5], positive [11], and null [8910]. Similarly, circulating HCY levels and LTL have been shown to be an inverse [6710], positive [5], and null association [8]. Such inconsistencies in data may be partly due to different characteristics or conditions of subjects among those studies, such as age, the presence of chronic disease, and nutritional status of folate and vitamin B12 (deficiency, adequacy, or overload). Indeed, a recent study suggested that a lack of association between plasma folate levels and LTL may be due to the adequate folate status of study participants [9]. A significant positive association between serum folate level and LTL was observed in a study involving patients with hypertension [12]. In addition, a case-control study involving patients with atherosclerosis showed that serum folate and high sensitive C-reactive protein (hs-CRP) levels modify the association between HCY levels and LTL [11]. In a study of subjects stratified by age group, an inverse association between circulating HCY levels and LTL was observed only in older men [7].
In a population-based study comprising men and women aged 55 years and over, we evaluated the associations of serum folate, vitamin B12, and HCY levels with LTL, taking into account hs-CRP levels and the presence of diabetes mellitus, hypertension, and dyslipidemia. Furthermore, we examined these associations when stratified according to serum folate and hs-CRP levels.
Materials and Methods
Study design and population
We performed a cross-sectional study embedded within the population-based cohort of the Korean Genome Epidemiology Study, which is an ongoing longitudinal investigation. Detailed information regarding enrollment of cohort members and study procedures is available elsewhere [17]. Briefly, 5015 cohort members aged 40-69 years were enrolled between June 18, 2001, and January 29, 2003. Since baseline, they have been followed up biennially, undergoing both a comprehensive health examination and an on-site interview at the Korea University Ansan Hospital. As part of the health examination, cohort members provided blood specimens for biochemical assays, as well as undergoing anthropometric and clinical evaluations. They also participated in questionnaire-based interviews administered by trained personnel to collect information regarding socio-demographics, medical history, health conditions, and lifestyle factors. At each visit, participants signed an informed consent form approved by the Human Subjects Review Committee at the Korea University Ansan Hospital (ED0624).
Between May 2009 and November 2012, 1156 of the cohort members provided blood samples for LTL assays and biochemical assessments of serum folate, vitamin B12, HCY, and hs-CRP levels. Among these participants, individuals with hs-CRP levels > 10 mg/L or outlying values of biomarker (> mean + 5SD) (n = 43) and those with age < 55 years at the follow-up interview (n = 315) were excluded. After this exclusion, 798 participants aged 55 years or older were included in the present study.
LTL measurement
Relative LTL was measured using quantitative real-time polymerase chain reaction [18]. Peripheral blood samples were collected during the 10-year follow-up, and leukocyte genomic DNA was extracted using a QIAamp™ DNA blood mini kit (Qiagen, Hilden, Germany). Purified DNA samples were diluted and quantified using a NanoDrop™ 1000 spectrophotometer (Thermo Fisher Scientific, Wilmington, DE, USA). The ratio of the telomere-repeat-copy number to the single-copy gene (36B4, which encodes acidic ribosomal phosphoprotein) copy number was determined in order to calculate the relative LTL using an iQ Multi-Color Real-Time Polymerase Chain Reaction Detection System (Bio-Rad, Hercules, CA, USA). The final composition of the polymerase chain reaction mixture was 1× SYBR Green SuperMix (Bio-Rad, Hercules, CA, USA), 50 ng DNA, 0.2 µM telomere primers (forward, 5'-GGTTTTTGAGGGTGAGGGTGAGG GTGAGGGTGAGGGT-3'; reverse, 5'-TCCCGACTATCCCTATCCCTATCCCTATCCCTATC CCTA-3'), and 0.3 µM 36B4 primers (forward, 5'-CAGCAAGTGGGAAGGTGTAATCC-3'; reverse, 5'-CCCATTCTA TCATCAACGGGTACAA-3'). The reactions were performed in the 96-well plate, and each plate included a reference DNA sample. A four-point standard curve was established to allow a conversion of the cycle threshold into nanograms of DNA. A validity test showed that the Pearson correlation coefficients were 0.78 (intra-assay) and 0.69 (inter-assay) when 25 samples were run in triplicate.
Biochemical assessment
All participants fasted for at least 8 h before blood collection. Blood samples were collected and delivered to the Seoul Clinical Laboratories (Seoul, Korea) for assays of serum folate, vitamin B12, HCY, and hs-CRP levels. These biomarkers were assessed using the ADVIA Centaur™ immunoassay kits (Siemens Healthcare Diagnostics Inc., Deerfield, IL, USA).
Potential confounding variables
Information was collected regarding potential confounding variables, which were selected on the basis of previous studies [5678910], during the health examination and questionnaire-based interview. Such information comprised age, sex, body mass index (BMI), smoking status, alcohol consumption, and physical activity level, as well as the presence of diabetes mellitus, hypertension, or dyslipidemia. According to a standardized protocol for anthropometric measurements, height (cm) and body weight (kg) were measured to the nearest 0.1 cm or 0.1 kg, respectively, without footwear, and the body mass index (BMI, kg/m2) was subsequently calculated. To calculate the daily amount of alcohol consumed (g/day), information was gathered regarding alcohol consumption during the past year; this included the average frequency of drinking occasions, the amount of alcohol consumed on a typical occasion, and the volume of one standard drink for each alcoholic beverage. Information regarding physical activity level was obtained using 5 categories of activity intensity, with open-ended questions about the hours spent in a typical day at each level of intensity. A total metabolic equivalent (MET-h) score was calculated by multiplying the hours spent at a particular activity intensity by given MET values (1.0 for sleep or sedentary, 1.5 for very light activity, 2.4 for light activity, 5.0 for moderate activity, and 7.5 for vigorous activity); these values were determined on the basis of given examples of activities in each category. The presence of diabetes mellitus was confirmed if the fasting plasma glucose level of ≥ 120 mg/dL, or if the post-prandial glucose level of ≥ 200 mg/dL. Hypertension was identified when antihypertensive medications were used, or if systolic blood pressure (BP) was ≥ 140 mmHg or diastolic BP of ≥ 90 mmHg. Dyslipidemia was confirmed when hypolipidemic medications were used, or when serum total cholesterol levels were ≥ 240 mg/dL, or when serum high-density lipoprotein (HDL)-cholesterol levels were < 50 mg/dL (in women) or < 40 mg/dL (in men), or when serum triglyceride levels were ≥ 150 mg/dL. BP was measured in a sitting position using mercury sphygmomanometers after a rest period of at least 5 min. Repeated BP measurements were performed at approximately 30-s intervals and recorded to the nearest 2 mmHg. The mean of 4 measurements (2 in each arm) was calculated for both systolic and diastolic BP.
Statistical analyses
Descriptive statistics of the study participants' characteristics were obtained according to the quartiles of serum folate levels. The chi-square test and analysis of variance were used to analyze data, where appropriate. In order to evaluate the associations of LTL with serum folate, vitamin B12, and HCY levels, LTL was transformed using the natural logarithm function, to minimize the effect of outliers, and fitted as a dependent variable in linear regression models. In multiple linear regression models, the following covariates were included: age (continuous), sex, BMI (continuous), smoking status (non-smoking, moderate smoking [1-20 cigarettes/day], heavy smoking [≥ 21 cigarettes/day]), alcohol consumption (non-drinking, alcohol consumption of 1-15 g/day, of 16-30 g/day, and of > 30 g/day), physical activity (MET-h quartiles), as well as the presence of diabetes mellitus, hypertension, or dyslipidemia. Multiple linear regression analyses were stratified on the basis of both serum folate levels (< 5.4 ng/mL and ≥ 5.4 ng/mL) and CRP levels (< 2 mg/L and ≥ 2 mg/L). All statistical analyses were performed using SAS™ software (SAS 9.1.3, SAS Institute, Cary, NC, USA).
Results
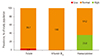
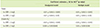
This cross-sectional study included 798 men (57%) and women (43%). As reported during the interview, none of the participants had been diagnosed with either cancer or cardiovascular disease. Thirty-one participants (3.9%) were deficient in serum folate (< 3.4 ng/mL). None were deficient in serum levels of vitamin B12 while 64.2% had mild hyperhomocysteinemia (> 12 µmol/L) and none had severe hyperhomocysteinemia (≥ 50 µmol/L) (Figure 1).
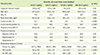
The characteristics of the study participants were compared across the quartiles of serum folate levels (Table 1). Men, smokers, alcohol drinkers, and individuals with hypertension were likely to have lower serum folate levels. Those with lower serum folate levels also were likely to have lower levels of vitamin B12 and higher levels of HCY (Table 1).
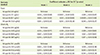
Table 2 shows the coefficient estimates and standard errors obtained from the linear regression analyses of the associations between LTL and serum folate, vitamin B12, and HCY levels. After adjustment for potential confounding variables, including the presence of metabolic diseases and serum hs-CRP levels, no significant association was found between LTL and serum folate, vitamin B12, and HCY levels among all participants (Table 2).
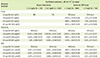
Table 3 presents the results stratified on the basis of serum folate and HCY levels. Because of the trivial proportion of individuals with a folate deficiency, we used 5.4 ng/mL as a cut-off point. Among those with serum folate levels < 5.4 ng/mL, there was no significant association of LTL and serum vitamin B12 and HCY levels. When data were stratified on the basis of serum hs-CRP levels, an inverse association was observed between HCY levels and LTL among those with hs-CRP ≥ 2 mg/L, a value that is used as a cut-off point for older adults (p for trend < 0.05). Similarly, there was an inverse association between vitamin B12 levels and LTL in the same stratum (p for trend < 0.05).
When the associations of serum biomarkers were assessed, HCY level was found to be inversely associated with both folate and vitamin B12 levels among those with hs-CRP levels < 2 mg/L (p < 0.001), whereas it was positively associated with vitamin B12 levels (p = 0.08) and inversely associated with folate levels (p < 0.01) among those with hs-CRP levels ≥ 2 mg/L (Table 4).
Discussion
We observed no significant association between LTL and serum folate, vitamin B12, and HCY levels in older adults who showed adequate folate and vitamin B12 status, as well as normal or moderately elevated serum HCY levels. However, we did find a weak inverse association between serum HCY levels and LTL in those with elevated levels of serum hs-CRP, a biomarker of low-grade systemic inflammation [19]. In these participants, we also observed a weak inverse association between serum vitamin B12 levels and LTL. Thus, we suggest that moderately elevated serum HCY levels may influence the attrition of LTL in older adults with low-grade inflammation, even when they have adequate folate and vitamin B12 levels.
Telomeres consist of repeating hexameric DNA sequences (TTAGGG in humans), which cap the ends of each chromosome. They function to prevent end-to-end fusion and deterioration of chromosomes, as well as to ensure genomic stability. The attrition of telomeres occurs naturally during cell division, but its rate differs among individuals. It has been hypothesized that telomere attrition is accelerated by aberrant formation and methylation of DNA, by oxidative stress, and by inflammation [4142021]. These hypotheses have been further linked to one-carbon transfer pathways involving folate, vitamin B12, and HCY [2322]. The degradative pathways of some amino acids produce carbon units, which are in turn transferred to tetrahydrofolate (THF). Subsequently, THF is converted to methylene-THF and methyl-THF. Methylene-THF is involved in the conversion of deoxyuridine monophosphate to deoxythymidine monophosphate for pyrimidine biosynthesis. In folate deficiency, deoxyuridine monophosphate accumulates and uracil is incorporated into DNA in place of thymine. Such misincorporation results in aberrant DNA formation, thus accelerating the DNA strand breakage by excision-repair enzymes as they remove uracil bases. Meanwhile, methyl-THF, in concert with vitamin B12, donates methylene to generate methionine from HCY. Methionine serves as a methyl donor for the maintenance of proper methylation of DNA, RNA, and proteins. However, deficiencies in folate and vitamin B12 result in aberrant methylation and HCY accumulation [2322]. Recently, HCY has been suggested as a potential determinant of oxidative and inflammatory stress [23]. Two HCY molecules, each of which contains a reactive sulfhydryl group, form a disulfide bond and a superoxide radical in the presence of oxygen. Indeed, even modestly elevated HCY levels have been reported to increase oxidative stress in rats [24], as well as in humans [25]. Moreover, it has been hypothesized that HCY-induced oxidative stress triggers pro-inflammatory responses [26], although data are still limited.
The circulating HCY level is determined by both genetic and nutritional factors, as well as by physiological characteristics such as age, sex, and race, and the presence of cancer or metabolic diseases. Regarding nutritional factors, deficient intake of folate, vitamin B12, or vitamin B6, as well as excessive intake of methionine-rich proteins, is known to raise circulating HCY levels [27]. In present study, we included Korean older adults who were free of cancer and cardiovascular disease, and took into account age, sex, and the presence of metabolic diseases in our association analyses, although we were unable to consider genetic factors. Approximately 2 thirds of the study participants showed modestly elevated HCY levels, but most of them showed adequate folate status and all participants showed adequate vitamin B12 status. Therefore, we hypothesize that the mild hyperhomocysteinemia seen in some subjects may be partly due to methionine-rich protein intake rather than B-vitamin deficiency. Excessive consumption of beef, pork, poultry, and fish, major sources of methionine-rich protein and vitamin B12, was reported in previous studies to raise circulating HCY levels [2829]. The finding of a positive association between serum HCY levels and vitamin B12 among individuals with elevated hs-CRP levels seems to support this hypothesis. However, other nutritional mechanisms, as well as non-nutritional mechanisms, cannot be ruled out in explaining these findings.
The strengths of our study include the use of data from a general population and the consideration of a broad range of confounding factors. However, some study limitations should be taken into account when interpreting our findings. Because the study design was cross-sectional, a causal relationship between serum HCY levels and LTL remains undetermined, and this should be investigated in future studies. In addition, because we were unable to measure consumption of protein or specific amino acids, whether methionine-rich protein intake has an effect on hyperhomocysteinemia of the study participants remains undetermined. Similar to other studies, our study used leukocytes instead of somatic cells to assess telomere length. Because the attrition rates of telomeres are reportedly similar between leukocytes and somatic tissues [30], LTL seems to be a reasonable biomarker reflecting telomere length of somatic tissues. Our findings may be generalizable to East Asian adults aged 55 years and over, but not to other ethnicities and age groups.
Conclusion
In this study, we observed that serum HCY levels are inversely associated with LTL under conditions of low-grade systemic inflammation (indicated as serum hs-CRP levels) and adequate folate and vitamin B12 status. Given these findings, we suggest that circulating HCY and hs-CRP levels should be strictly maintained below their normal ranges to delay biological aging for healthy adults, and that the reduction of circulating HCY and hs-CRP levels via lifestyle modification should be investigated in future studies.
 XML Download