

 PDF
PDF ePub
ePub Citation
 Print
Print


Introduction
According to the World Health Organization and the Centers for Disease Control and Prevention, the prevalence of cerebro-cardiovascular diseases is increasing progressively, resulting in the increased costs for treatment and management of the diseases [123]. The Statistics Korea reported that cerebro-cardiovascular diseases, particularly cerebrovascular disease, had the highest mortality rate for a single disease in 2013 [4]. The majority of cerebro-cardiovascular diseases are caused by risk factors that can be controlled, treated, or modified (i.e. hypertension, hyperlipidemia, hyperglycemia, physical inactivity, unhealthy and unbalanced diet, heavy smoking, and obesity) [123]. However, there are some major risk factors that cannot be controlled (i.e. age, gender, and family history) [123].
Many prospective, longitudinal cohort studies and cross-sectional studies have reported a relationship between glycemic status and the risk of stroke, independent of other prognostic factors [5678]. For example, Tanne et al. [5] reported that fasting glucose is closely associated with the risk of ischemic cerebrovascular events (ICEs), which showed a J-shaped association: the risk for ICEs was increased in the individuals with an fasting plasma glucose (FPG) level > 100 mg/dL as well as in those with an FPG level < 90 mg/dL than in those with a FPG level of 90-99 mg/dL [5]. Nielson et al. showed that the prevalence of ischemic attack or stroke was significantly higher in the individuals with impaired fasting glucose status compared with that in those with normal blood glucose levels [6].
A possible mechanism by which higher fasting glucose levels affect cerebrovascular risk may be explained by several experimental reports showing that higher blood glucose levels result in the production of advanced glycation end products (AGEs) in the blood stream [91011121314]. Increased AGEs may lead to the intracellular generation of reactive oxygen species (ROS) and oxidative stress, resulting in elevated inflammatory responses and consequent endothelial malfunction [91011121314]. However, there are few studies on the relationship between fasting glycemic status and cerebrovascular risk in non-diabetic individuals.
Therefore, we hypothesized that fasting glycemic status even in non-diabetic condition may sensitively reflect cerebrovascular risk in non-diabetic Koreans. To test the hypothesis, we aimed to investigate the relationship of fasting glycemic status to cerebrovascular risk parameters including classical parameters, oxidative and inflammatory markers in non-diabetic Koreans (healthy control and stroke patients).
Materials and Methods
Subjects and study design
All the study subjects were recruited from Dong-A University Hospital between January and March 2014. Patients with stroke were recruited from the Busan-Ulsan Regional Cardiocerebrovascular Center at Dona-A University Hospital. They were all diagnosed for stroke and were under management by routine check-up every 2 months. The average time since being diagnosed for stroke was 4.66 ± 0.85 years. They did not have any diagnosis of diabetes, renal disease, liver disease, thyroid disease, or acute or chronic inflammatory disease. Control individuals were recruited during routine health checkups at the Health Promotion Center at Dong-A University Hospital. They did not have any history of stroke or diabetes. Exclusion criteria for the control individuals were orthopedic limitations, ~10% weight loss/gain over the previous 6 months, or any diagnosis of vascular disease, cancer (clinically or by anamnesis), renal disease, liver disease, thyroid disease, or acute or chronic inflammatory disease. In addition, subjects with fasting glucose levels less than 125 mg/dL were included in the analysis. The study participants were interviewed regarding their smoking and drinking behavior and medications. All the participants were provided with detailed information of the study and provided written informed consent. The study protocol was approved by the Institutional Review Board of Dong-A University and was carried out in accordance with the Helsinki Declaration. Finally, 41 patients with stroke and 112 control individuals were included in the study.
Anthropometric parameters, blood pressure, and blood collection
Height and body weight were measured. Body mass index (BMI) was calculated as body weight divided by height (kg/m2). Blood pressure (BP) was obtained from the left arm of seated individuals with an automatic BP monitor (HEM-7220, OMRON, Matsusaka, Japan) after a short rest. After an overnight fast, venous blood specimens were collected in EDTA-treated tubes or plain tubes. The tubes were immediately placed on ice until they arrived at the analytical laboratory (1-3 h). The blood specimens were separated into plasma and serum and stored at -80℃ until analysis.
Fasting glucose, glycated hemoglobin (HbA1C) and lipid profiles
Fasting glucose was measured using a glucose oxidase method (Glucose Analyzer Beckman Instruments, Irvine, CA, USA) as described in a previous report [15]. Glycated hemoglobin (HbA1C) was measured using Variant II Turbo HbA1C kit- 2.0 (Bio-Rad, Hercules, CA, USA) ON Variant (Variant II TURBO, Bio-Rad, Hercules, CA, USA). Serum total cholesterol, triglyceride, and low-density lipoprotein (LDL) cholesterol levels were measured using commercially available kits on a Hitachi 7150 Auto-analyzer (Hitachi Ltd., Tokyo, Japan), as described previously [16]. The intra-assay and inter-assay coefficients of variance in triglyceride level were 1.50% and 1.80%, respectively, and those of variance in total cholesterol level were 0.80% and 1.70%, respectively. After precipitating the serum chylomicrons, LDL-cholesterol, and very low-density lipoprotein with dextran sulfate-magnesium, the high-density lipoprotein (HDL) cholesterol left in the supernatant was measured by a previously described enzymatic method [16].
Serum high-sensitivity C-reactive protein, plasma interleukin-6, and tumor necrosis factor-α
Serum high-sensitivity C-reactive protein (hs-CRP) was measured with an ADVIA 1650 system (Bayer, Tarrytown, NY, USA) using a commercially available, hs- CRP-Latex(II) X2 kit (Seiken Laboratories Ltd., Tokyo, Japan) that allows the detection of CRP in the range of 0.001-31 mg/dL, as described in a previous report [16]. The intra-assay and inter-assay coefficients of variance were 1.87% and 1.89%, respectively. Plasma concentrations of interleukin-6 (IL-6) and tumor necrosis factor-a (TNF-α) were measured using the Quantikine® HS ELISA Kit (RnD systems, Inc., Minneapolis, MN, USA) according to the manufacturer's instructions. The resulting color reaction was measured using the iMark™ microplate absorbance reader (Bio-Rad Laboratories, Hercules, CA, USA). The wavelength correction was set to 490 nm and 560 nm.
Plasma oxidized low density lipoprotein and malondialdehyde
Plasma oxidized LDL (ox-LDL) was measured using an enzyme immunoassay (Mercodia, Uppsala, Sweden) [15]. The resulting color reaction was measured using the iMark™ microplate absorbance reader (Bio-Rad Laboratories, Hercules, CA, USA). The wavelength correction was set to 450 nm and 540 nm. The intra-assay and inter-assay coefficients of variance were 6.30% and 8.20%, respectively. Plasma malondialdehyde (MDA) was measured from thiobarbituric acid-reactive substances using the TBARS Assay Kit (Cell Biolabs, Inc. Sand Diego, CA, USA) [17]. The resulting color reaction was measured at a wavelength of 530 nm using the iMark™ microplate absorbance reader (Bio-Rad Laboratories, Hercules, CA, USA).
Liver and kidney functions, blood hemoglobin, and platelet counts
Serum aspartate aminotransferase and alanine aminotransferase levels were measured by a Modified IFCC UV method. Serum creatinine was measured by a kinetic colorimetric assay (Jaffe). Serum blood urea nitrogen concentrations were measured by a Kinetic UV Assay. Hemoglobin and platelet counts in whole blood were determined using the HORIBA ABX diagnostic (HORIBA ABX SAS, Parc Euromedicine, Montpellier, France).
Assessment of dietary intake
Information about habitual food intake was obtained using a 24-hour recall method and a semi-quantitative food frequency questionnaire, which was previously validated [18]. We used the former to carry out analyses and the latter to determine whether the data collected by the recall method were representative of the dietary patterns. A registered dietitian gave all the participants written and verbal instructions on how to complete a 3-day (two weekdays and one weekend day) dietary record. Dietary energy values and nutrient content from the 3-day food records were calculated using the Computer Aided Nutritional Analysis program (CAN-pro 3.0, Korean Nutrition Society, Seoul, Korea). Total energy expenditure (TEE, kcal/day) was calculated from activity patterns including the basal metabolic rate and physical activity over 24 h [19] and considering the thermic effect of food. The basal metabolic rate for each participant was calculated using the Harris-Benedict equation [20].
Statistical analysis
Statistical analyses were performed with Win SPSS ver. 21.0 (SPSS Inc., Chicago, IL, USA). Differences in continuous variables among subgroups were tested using an independent t-test or a one-way ANOVA followed by Bonferroni corrections. Non-continuous variables were tested with a chi-square test. A general linear model analysis (post-hoc multiple comparison tests) followed by a Bonferroni correction was also used to compare subgroups with adjustment for confounders (i.e., age, gender, cigarette smoking, alcohol drinking, and/or BMI). Pearson and partial correlation analyses were performed for the relationships among the variables. Multiple regression analysis was used to find the major determinants for cerebrovascular risk. Skewed variables were log transformed for statistical analysis. For descriptive purposes, mean values were presented using untransformed values. Results were expressed as means ± SE or percentages. A two-tailed p-value < 0.05 was considered statistically significant.
Results
General characteristics of study participants
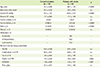
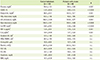
Table 1 presents the general characteristics of the study participants. The patients with stroke were older, had higher systolic BP and consumed less protein, and higher polyunsaturated fatty acid to saturated fatty acid ratio (PUFA/SFA) compared with the control individuals (p < 0.001 for each factor). The patients with stroke had a higher proportion of males and a lower proportion of current alcohol drinkers compared with the control individuals (p < 0.0001). All of the patients with stroke were taking an antiplatelet agent, and 75.6% of them were taking antihypertensive and lipid-lowering drugs. The other parameters such as BMI, diastolic BP, proportions of cigarette smoking and obesity, total energy expenditure to total energy intake ratio (TEE/TEI), percent energy intake derived from carbohydrates and fats, and fiber intake were not significantly different between the two groups.
Basic biochemical parameters, lipid profiles, oxidative stress, and inflammatory markers
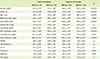
The patients with stroke had higher fasting levels of glucose, HbA1c (%), and triglyceride and lower levels of HDL-, LDL-, and total cholesterol compared with the control individuals (Table 2). The lipid-lowering drugs that the patients with stroke consumed might influence the levels of LDL- and total cholesterols. The levels of inflammatory markers (hs-CRP, TNF-α, and IL-6) were significantly higher in the patients with stroke than in the control individuals, but the levels of oxidative stress markers (ox-LDL and MDA-TBARS) were not significantly different between the two groups, which may be also related with the effect of lipid lowering drugs. In addition, other basic biochemical parameters such as hemoglobin, platelet counts, liver functions (aspartate aminotransferase and alanine aminotransferase), and kidney functions (creatinine and blood urea nitrogen) were not significantly different between the patients with stroke and the control individuals.
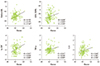
Relationship between fasting glucose and oxidative stress/inflammatory markers
Figure 1 presents the correlations of fasting glucose level with oxidative stress and inflammation status. The fasting glucose level was positively correlated with the levels of ox-LDL (r0 = 0.172, p < 0.05) and MDA (r0 = 0.246, p < 0.001). These relationships were maintained after adjustments for age and gender (r1 = 0.173, p < 0.05 for ox-LDL; r1 = 0.251, p < 0.001 for MDA). The statistical significances were still maintained (r2 = 0.200, p < 0.05 for MDA) and at least turned to a trend (r2 = 0.164, p < 0.1 for ox-LDL) after further adjustments for cigarette smoking, alcohol consumption, and BMI (Figure. 1). In addition, the fasting glucose level was positively correlated with the levels of hs-CRP (r0 = 0.301, p < 0.0001), TNF-α (r0 = 0.233, p < 0.001), and IL-6 (r0 = 0.240, p < 0.001). The statistical significance was maintained (r1 = 0.310, p < 0.0001 and r2 = 0.293, p < 0.001 for hs-CRP) and at least turned to a trend (r1 = 0.153, p < 0.1 and r2 = 0.143, p < 0.1 for TNF-α; r1 = 0.167, p < 0.1 and r2 = 0.158, p < 0.1 for IL-6) after adjustment for confounding factors (Figure 1).
Association of fasting glycemic status with cerebrovascular risk by multiple regression analysis
A multiple stepwise regression analysis was performed to identify the association of fasting glycemic status with cerebrovascular risk. Input factors were age, gender, BMI, BP, triglyceride, total cholesterol, LDL-cholesterol, HDL-cholesterol, fasting glucose, HbA1C, hs-CRP, TNF-α, IL-6, ox-LDL, malondialdehyde, dietary PUFA/SFA, TEE/TEI, cigarette smoking and alcohol consumption which were closely related with metabolic syndrome, cardio- and cerbro-vascular diseases. Fasting glucose and HbA1C were found main contributors to cerebrovascular risk (adjusted β-coefficients [β'] for fasting glucose: 0.284, p < 0.0001; for HbA1C [%] : 0.149. p < 0.044), together with age, systolic BP, total cholesterol, hs-CRP, BMI, dietary PUFA/SFA intake (r2 = 0.634, p = 0.044).
Basic parameters and lipid profiles according to fasting glucose status
Based on the above results, the study participants were subdivided by fasting glucose status (normal fasting glucose [NFG: 70-99 mg/dL]; higher fasting glucose [HFG: 100-125 mg/dL]), resulting in four groups: control-NFG (n = 91), control-HFG (n = 21), stroke-NFG (n = 27), and stroke-HFG (n = 14). The average time since being diagnosed with stroke was not statistically different between the stroke-NFG and stroke-HFG groups (4.73 ± 0.83 years and 4.54 ± 0.89 years, respectively). Among the control individuals, the HFG group showed higher levels of BMI, triglyceride, LDL-cholesterol, and total cholesterol and lower levels of HDL-cholesterol compared with the NFG group. Among the patients with stroke, the HFG group showed significantly higher levels of LDL-cholesterol and consumed a lower dietary PUFA/SFA compared with the NFG group. In addition, serum triglyceride and total cholesterol levels tended to be higher in the stroke-HFG group compared with those in the stroke-NFG group, but those differences did not reach a statistical significance (Table 3).
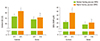
Association of fasting glucose with oxidative stress
Figure 2 shows the fasting glucose-associated plasma levels of ox-LDL and MDA after adjustments for age, gender, cigarette smoking, alcohol consumption, and BMI. Plasma levels of ox-LDL (p < 0.05) and MDA (p < 0.01) were significantly higher in the control-HFG group than in the control-NFG group. The levels of ox-LDL and MDA tended to be higher in the stroke-HFG group compared with those in the stroke-NFG group (p < 0.1 for each), but the differences did not reach statistical significance.
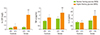
Association of fasting glucose with inflammation status
Figure 3 presents the fasting glucose-associated inflammatory status (hs-CRP, TNF-α, and IL-6 levels) in the control individuals and the patients with stroke after adjustments for age, gender, cigarette smoking, alcohol consumption and BMI. Plasma levels of hs-CRP, TNF-α and IL-6 were not significantly different between control-NFG group and stroke-NFG group (Figure. 3). The plasma levels of hs-CRP and TNF-α were significantly higher in the HFG groups compared with those in the corresponding NFG groups (p < 0.05 for each comparison in the control individuals, p < 0.001 for each comparison in the patients with stroke). The IL-6 levels were significantly higher in the stroke-HFG group compared with those in the stroke-NFG group (p < 0.01), but they were not significantly different between the control-HFG and control-NFG groups. In addition, all the inflammatory levels were remarkably the highest in the stroke-HFG group among the four subgroups.
Discussion
The aim of this present study was to investigate the association between fasting glycemic status and cerebrovascular risk parameters including classical parameters, oxidative and inflammatory markers in non-diabetic Koreans. Multiple regression analysis revealed that fasting glycemic status particularly, fasting glucose was found a main contributor to cerebrovascular risk. We also found evidences that oxidative stress and inflammation status might mediate the mechanisms by which fasting glucose increases the cerebrovascular risk. As initially hypothesized, our results suggest that fasting glucose status may be a useful indicator for cerebrovascular risk in non-diabetic Koreans.
Several cohort and cross-sectional studies have reported an association between glucose levels and cerebrovascular risk [5678212223], which demonstrates the importance of glycemic control for the prevention of cerebro-cardiovascular diseases and provides evidence for the benefits of tighter glucose control for primary stroke prevention [212223]. Prospective cohort studies have shown a close association between fasting glucose levels and the risk of stroke in patients with diabetes and impaired fasting glucose status [5678212223]: for example, the findings of the Northern Manhattan Study show a strong relationship between fasting glucose levels and increased risk of stroke in diabetic patients even after adjustments for other vascular risk factors [7]. Rundek et al. reported that insulin resistance estimated by the homeostasis model assessment could be used as a marker for increased risk of ischemic stroke [8].
A higher concentration of blood glucose results in the production of ROS [9], and the reaction of glucose with blood proteins forms glycation end products, which can also trigger the production of ROS [910]. Consequently, the ROS can initiate a chain reaction leading to an increased inflammatory response, the chemical modification of lipoproteins, and a reduction of nitric oxide availability, thereby increasing the risk of atherogenesis in the blood vessels and brain [9101112]. Several in vitro studies have demonstrated the increased expression of oxidative stress markers in cells exposed to fluctuating glucose concentrations [101112]. Clinical trials also reported that a greater frequency and magnitude of glycemic excursions in conventionally treated patients compared with those in intensively treated patients might increase glycemic variability, generating more ROS and leading to inflammation and vascular damage [910].
In our study, the inflammatory status expressed by hs-CRP, IL-6, and TNF-α were higher in patients with stroke than in control individuals. On the other hand, oxidative stress expressed by ox-LDL and MDA was not statistically significantly different between the two groups, which may be affected by lipid-lowering drugs (i.e., statins) that strongly attenuate not only lipid levels in blood but also lipid oxidation. Nevertheless, the correlation analyses revealed that those inflammatory and oxidative stress parameters were positively correlated with fasting glucose levels and those relationships were statistically significant after adjustments, although some of the significant results were reduced to trends. Furthermore, even though all of the individuals were non-diabetic, those with HFG showed higher oxidative stress levels and inflammation status than their counterparts with NFG. In particular, the patients with stroke and HFG had the highest inflammatory levels among the four subgroups. Those results suggest that fasting glycemic control is important not only for non-diabetic individuals with no history of stroke but also for non-diabetic individuals with a history of stroke who are using medication to prevent the recurrence of stroke or further complications.
In addition, we found that control individuals and patients with stroke had different patterns of dietary protein intake and PUFA/SFA. Stroke patients consumed a lower proportion of protein and a higher PUFA/SFA compared with control individuals. It is possible that, acting on the advice of dietitians since being diagnose with stroke, the patients with stroke paid more attention to their dietary intake in order to manage their health status and prevent recurrence of their diseases or complications, and therefore consumed less protein- and SFA-sourced foods (mainly animal-sourced foods) and more PUFA-sourced foods (mainly fish and plant-sourced foods). In fact, many studies have reported an association between dietary intake and glycemic control, insulin resistance, oxidative stress, and inflammatory processes, and consequently the risk or development of diseases [16242526]. Recent studies have reported protective effects of blood or dietary PUFAs, particularly n-3 PUFAs on cardiovascular health, although the results are still controversial [24252627]. In our previous studies, PUFAs, particularly docosahexaenoic acid (DHA), helped to suppress vascular proliferation and inflammation [16], and serum phospholipid DHA composition were inversely associated with the risk of intracranial atherosclerotic stenosis [26], suggesting that sufficient amounts of DHA in the plasma or in the diet could reduce the risk of intracranial atherosclerotic stenosis. In a sub-analysis in our current study, the patients with stroke and NFG were consuming a higher ratio of PUFA/SFA and showed significantly lower inflammatory levels compared with their counterparts with HFG. Interestingly, the inflammatory levels in the individuals with stroke and NFG were similar to those in the controls with no history of stroke, but the inflammatory levels in the patients with stroke and HFG were the highest among the four subgroups. Based on those results, we assumed that dietary intake, and particularly PUFA intake, might be involved in fasting glycemic control and partly contribute to the regulation of oxidative stress and inflammation.
One limitation of this study is that it did not allow for the sequential assessment of a direct association between fasting glucose and cerebrovascular risk in non-diabetic individuals, because the exposure and outcome data were collected at a single time point. Further investigation through longitudinal studies will help confirm the status of fasting glycemic control as an early predictor of cerebrovascular risk, in association with oxidative stress and inflammatory status in non-diabetic control individuals, and with complications or recurrence of stroke in patients with a prior history of stroke. In addition, a dietary intervention study is needed to further elucidate the effects of dietary modification on the relationship between early glycemic control and cerebrovascular risk.
 XML Download