

 PDF
PDF ePub
ePub Citation
 Print
Print


INTRODUCTION
Obesity is one of the biggest public health problems around the world. Obesity is a result from an excessive accumulation of body fat [1]. According to a result from the 2013–2014 National Health and Nutrition Examination Survey (NHANES) in United States, the prevalence of obesity in adults men and women was 37.7% and 35.0%, respectively [2]. Also, according to the World Health Organization (WHO), 52% of population aged 18 years and over was either overweight or obese in 2014 [3]. In addition, the prevalence of obesity among children and adolescents as well as adults has increased [456]. Recently, the prevalence of obesity in Koreans has been quickly increasing because of westernized diets and changes in lifestyle [7]. According to a result from the Korean Nutritional Health and Nutrition Examination Survey (KNHANES) from 2007 to 2013, the prevalence of obesity aged 19 years and over had been maintained between 31% and 32%. [8910]. Genetic and various environment factors are the causes of obesity. In environment factors, there are excess caloric intake, lack of physical activity, stress, and so on [11]. Based on an identical twins study indicating that genes only had 20% to 30% influence on obesity, the development of obesity is affected by eating habits and lifestyle factors rather than by genetic factors [12]. Along with obesity rate increases, the incidence of obesity-related diseases such as hypertension, diabetes, metabolic syndrome, and dyslipidemia also rapidly increases, thus leading to medical expenditure [131415]. So, we need to have effective strategies and management plans for prevention of obesity in order to reduce medical costs. Dyslipidemia is related to atherosclerotic diseases [1617].
Dyslipidemia is defined as increased triglycerides (TG) or low-density lipoprotein cholesterol (LDL-C) levels, or decreased high-density lipoprotein cholesterol (HDL-C) levels [18]. According to the result data from the KNHANES from 2007 to 2013, the prevalence of high-cholesterol and high-TG in population aged over 30 years had increased. The data in 2013 showed that the each prevalence rate was 14.9% and 17.1%, respectively [8910]. Dyslipidemia has associations with age, eating habits, blood pressure, physical activity, stress, and heredity as well as obesity [19]. Especially, dietary habits have a big influence on obesity and dyslipidemia. Therefore, improvement of dietary habits is necessary to prevent and manage these diseases for public health.
Recently, several domestic and international papers studied on the relationship between nutrient intakes and various diseases have been reported. Among them, some papers showed the intake of food with high calorie, high fat, high sugar, and high sodium was directly or indirectly associated with the development of obesity [20212223].
In a study of the adult Spanish population, people with a high urinary sodium excretion presented a higher body mass index (BMI) than people with low urinary sodium excretion [24], and a study targeting children and adolescents showed an association between dietary salt intake and body weight status [25].
Also, a Korean children-based study presented that a group with the highest sodium density, calculated by sodium intake/energy intake (mg/g), had higher rate of obesity and abdominal obesity than a group with the lowest sodium density [22], and a Korean adults-based study showed a positive association between high sodium intake and increased risk of being overweight [21]. Koreans particularly consume excessive sodium because of eating Korean traditional foods such as kimchi, pickled fish, soup, stew and so on. According to 1998–2010 KNHANES, the survey represented that average daily sodium intake among Koreans was 4,573–5,499 mg during the past 13 years. Koreans consumed 4,546 mg of sodium/day on average in 2012 [89262728]. Salt consumption in Koreans is much higher than the recommended salt consumption of 2,000 mg/day by the WHO [29].
Also, it has been proposed that obesity is related to intake of fast foods, sugar-sweetened beverages (SSBs), and unhealthy snacks containing high fat and sugar besides sodium [3031]. Since fat is a major source of calorie as well as essential fatty acid and fat-soluble vitamins, it is an essential nutrient to maintain good health. However, excessive intake of fat, especially saturated fat, is related to chronic degenerative diseases such as dyslipidemia, diabetes, and blood pressure [32]. Fat intake if Koreans has been quantitatively and qualitatively changed in the last 30 years, and these changes are significantly associated with rising obesity rate and chronic diseases. Therefore, it is necessary to have an attention on types of fat as well as dietary fat percentage of total calories.
It is widely known that excessive intake of sugar is correlated with chronic diseases such as obesity, coronary heart disease (CHD), and diabetes [33]. According to 1998–2011 KNHANES, average sugar intake of Korean was 48.4 g/day in 1998, 54.9 g/day in 2007, and 61.4 g/day in 2008–2011 [343536]. These increased amount of sugar intake calls for attention.
There have been studies on an association between obesity and sodium, fat, or sugar intake. But, there is no a qualitative systematic review on associations between obesity and integrated dietary factors including sodium, fat, and sugar. So far, information on associations between obesity or dyslipidemia and dietary factors in Korean populations is limited. Therefore, this qualitative systematic review was conducted to provide nutritional information that could be used to establish a scientific basis and prepare a policy to prevent obesity and dyslipidemia.
MATERIALS AND METHODS
Definition of dyslipidemia
Coronary artery disease is a leading cause of death and dyslipidemia is one of coronary artery’s risk factors [37]. According to the National Cholesterol Education Program-Adult Treatment Panel III (NCEP-ATP III), dyslipidemia is a group of health conditions that accompany one or more of the symptoms of hypercholesteremia total cholesterol (TC ≥ 240 mg/dL), low HDL-C (male: HDL-C ≤ 40 mg/dL, female: HDL-C ≤ 50 mg/dL), high LDL-C (LDL-C ≥ 160 mg/dL) [38].
Definition of abdominal obesity
Abdominal obesity is a state of the excessive fat accumulation in the belly and is thought to contribute to diabetes and cardiovascular disease. Waist circumference (WC) is an important marker commonly used for determining abdominal obesity. The study of the WC cut-off points for defining abdominal obesity in Koreans was performed by the Korean society for the study of obesity. In the Korean population, the cutoff value of abdominal obesity was defined as WC is 90 cm (35.4 inch) or above in male and 85 cm (33.5 inch) or above in female [3940].
Continuous metabolic syndrome score (cMetS)
cMetS was calculated using principal component analysis (PCA). The relative weights of the metabolic components of cMetS using WC, TG, HDL-C, glucose, and mean arterial blood pressure (MABP) was reflected by the PCA method [4142]. A high cMetS indicates comparatively high values of WC, TG, fasting blood sugar (FBS) and MABP as well as comparatively low HDL-C values.
Search strategy and study selection
A qualitative systematic review was performed to identify associations of obesity and dyslipidemia with intake of sodium, fat, and sugar. A literature review was performed from June 7 to June 17, 2016 using the Korean database of KMbase (kmbase.medric.or.kr), KoreaMed (www.koreamed.org), NDSL (www.ndsl.kr), DBpia (www.dbpia.co.kr), RISS (www.riss.kr), KISS (kiss.kstudy.com).
Duplicated literature was excluded using reference management software (EndNote; Thomson Reuters, New York, NY, USA) and excel program (Microsoft Excel; Microsoft Corporation, Redmond, WA, USA). Searching keywords included “sugar intake,” “sodium intake,” and “fat intake,” published. Published studies in 2016 were excluded from the search. According to above mentioned keywords, we obtained a list of 979 (sugar intake), 1,823 (sodium intake), 8,444 (fat intake) studies. After removing, we obtained the same number of studies. We selected primary studies based on titles and abstracts according to above mentioned criteria. Studies that could not be determined by titles and abstracts were reviewed using full-text regarding: 1) investigating on the association of nutrient intake (sodium, fat, sugar) and obesity; 2) investigation on the association of nutrient intake (sodium, fat, sugar) and dyslipidemia; and 3) investigation on nutrient intake that adversely affect the obesity and dyslipidemia. Finally, we carried out a qualitative systemic review with 11 studies (7 sodium studies, 2 sugar studies, 2 fat studies). The extracted data were study name, author’s name, year of publication, characteristics of participants, sample size, age range, BMI, serum lipids, and nutrient intakes.
RESULT
General characteristics
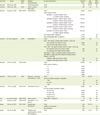
Table 1 shows general characteristics of 11 reviewed studies. Of the 11 studies, 7 were related to sodium intake, 2 had a relation to fat intake, and 2 were associated with sugar intake. Of the all studies, 5 studies used KNHANES data. Studies related to sodium intake had groups classified by daily sodium intake or 24-hour urine sodium excretion. Except one study, the target of all other studies were adults. Only one study was conducted on women participants. In the study done by Song et al. [21], total 5,955 subjects (2,765 men, 3,190 women) were divided into 5 quartiles based on daily sodium intake, and total 1,536 subjects (827 men, 709 women) were classified as overweight. In the case of Lim and Yang [45], groups were classified based on daily sodium intake and presence of diabetes. Kim et al. [46] evaluated the risk of obesity of 5 groups divided by daily sodium intake. Oh et al. [4748] identified the sodium intake by measurement of sodium excretions. Kim et al. [51] compared sugar intake of coffee-mix drinkers with that of non-drinkers. Coffee-mix is a mixture of instant coffee, sugar, and coffee-creamer. Hur et al. [52] specifically focused on children who participated in the 4th year (2008) of the Korean Child-Adolescent Cohort Study (KoCAS).
Table 1
General characteristics of 11 studies included for the current systematic review
| Nutrient | Study | Study year | Subject characteristics | Group classification | Sample size | Age range | BMI, kg/m2 | |
|---|---|---|---|---|---|---|---|---|
| Sodium | Rhie et al. [43] | - | Rural housewives | Total | 30 | 26–57 | 22 | |
| Sodium | Choi et al. [44] | 2004 | Rural, coastal, and urban | Total | 354 | ≥ 20 | 25 | |
| Sodium | Song et al. [21] | 2007–2009 | KNHANES Ⅳ | Total | 5,955 | 19–64 | - | |
| Daily sodium intake | ||||||||
| Quintile 1 (≤ 3,564.9 mg for men) | 139,145 | - | ||||||
| (≤ 2,394.4 mg for women) | ||||||||
| Quintile 2 (3,565.0–4,931.7 mg for men) | 170,137 | - | ||||||
| (2,394.4–3,293.1 mg for women) | ||||||||
| Quintile 3 (4,936.0–6,248.3 mg for men) | 158,133 | - | ||||||
| (3,293.5–4,370.9 mg for women) | ||||||||
| Quintile 4 (6,248.9–8,230.3 mg for men) | 170,140 | - | ||||||
| (4,372.2–5,879.1 mg for women) | ||||||||
| Quintile 5 (≥ 8,230.6 mg for men) | 190,154 | - | ||||||
| (≥ 5,880.3 mg for women) | ||||||||
| Overweight (BMI ≥ 25kg/m2) | 1,536 | 27 | ||||||
| Non-overweight (BMI < 25 kg/m2) | 4,419 | 22 | ||||||
| Sodium | Lim and Yang [45] | 2010 | KNHANES V | Total | 4,475 | ≥ 30 | - | |
| FBG < 100 mg/dL & daily sodium intake ≤ 5,335 mg | ||||||||
| Normal with low sodium intake | 1,949 | 23 | ||||||
| Normal with high sodium intake | 1,142 | 24 | ||||||
| 100 ≤ FBG < 126 mg/dL & daily sodium intake ≤ 5,335 mg | ||||||||
| Pre-diabetes with low sodium intake | 535 | 25 | ||||||
| Pre-diabetes with high sodium intake | 345 | 25 | ||||||
| 126 mg/dL < FBG or received medical treatment for diabetes or diagnosed with diabetes & daily sodium intake ≤ 5,335 mg | ||||||||
| Diabetes with low sodium intake | 341 | 25 | ||||||
| Diabetes with high sodium intake | 163 | 25 | ||||||
| Sodium | Kim et al. [46] | 2010–2012 | Total | 14,694 | ≥ 19 | - | ||
| Daily sodium intake, g | ||||||||
| < 2 | 1,957 | - | ||||||
| 2–4 | 5,149 | - | ||||||
| 4–6 | 3,685 | - | ||||||
| 6–8 | 2,005 | - | ||||||
| ≥ 8 | 1,898 | - | ||||||
| Sodium | Oh et al. [47] | 2015 | Obese (n = 60) and non-obese (n = 60)* | Total | 120 | 19–60 | - | |
| 24-hour sodium excretion, mEq/day | ||||||||
| < 110 | 21 | 26 | ||||||
| 110–180 | 42 | 27 | ||||||
| > 180 | 29 | 30 | ||||||
| Sodium | Oh et al. [48] | 2008–2011 | KNHANES IV and V | Total | 18,146 | ≥ 20 | - | |
| 24-hour sodium excretion, g/day | ||||||||
| 2.7 (2.3–3.1) | 4,536 | 23 | ||||||
| 3.7 (3.4–4.1) | 4,537 | 24 | ||||||
| 4.6 (4.1–5.0) | 4,537 | 24 | ||||||
| 5.9 (5.2–6.5) | 4,536 | 25 | ||||||
| Fat | Lee and Kim [49] | 1999–2000 | Obese adults | Total (BMI ≥ 25 kg/m2) | 51 | ≥ 18 | 30 | |
| Fat | Park et al. [50] | 1998–2007 | KNHANES I, II, III, and IV | Total | 15,804 | ≥ 20 | 24 | |
| Sugar | Kim et al. [51] | 2011–2012 | Gangneung, Samcheok | Total | 218 | 30–79 | - | |
| Coffee-mix drinkers† | 104 | 26 | ||||||
| Non-drinkers | 114 | 25 | ||||||
| Sugar | Hur et al. [52] | 2008 | Children who participated in KoCAS 4th (baseline) | Total | 770 | 9–10 | 18 | |
KNHANES, The Korea National Health and Nutrition Examination Survey; BMI, body mass index; FBG, fasting blood glucose; KoCAS, The Korean Child-Adolescent Cohort Study.
*Obese group: BMI ≥ 25 kg/m2; Non-obese group: 18.5 kg/m2 ≤ BMI < 23 kg/m2; †Coffee-mix is a mixture of instant coffee, sugar, and coffee-creamer.
![]()
Concentration of serum lipids of the subjects
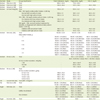
Concentrations of serum lipids of the subjects were shown in Table 2. In Rhie et al. [43], values of HDL-C were not shown. Values of TC, TG, and HDL-C in groups named “total” in Song et al. [21] and Lee and Kim [49] was not investigated.
Table 2
Concentration of serum lipids of the subjects in each studies
| Nutrient | Study | Group classification | Total cholesterol, mg/dL | Triglyceride, mg/dL | HDL-C, mg/dL | |
|---|---|---|---|---|---|---|
| Sodium | Rhie et al. [43] | Total | 169.0 ± 24.9 | 70.6 ± 25.0 | - | |
| Sodium | Choi et al. [44] | Total | 182.9 ± 36.6 | 147.3 ± 82.5 | 43.4 ± 10.0 | |
| Sodium | Song et al. [21] | Total | - | - | - | |
| Sodium | Lim and Yang [45] | Total | 191.6 ± 0.7 | 139.6 ± 2.2 | 48.0 ± 0.2 | |
| FBG < 100 mg/dL & daily sodium intake ≤ 5,335 mg | ||||||
| Normal with low sodium intake | 189.6 ± 1.1 | 120.1 ± 2.3 | 49.3 ± 0.3 | |||
| Normal with high sodium intake | 190.5 ± 1.3 | 124.4 ± 3.1 | 48.8 ± 0.4 | |||
| 100 ≤ FBG < 126 mg/dL & daily sodium intake ≤ 5,335 mg | ||||||
| Pre-diabetes with low sodium intake | 199.3 ± 2.0 | 158.9 ± 6.2 | 47.2 ± 0.7 | |||
| Pre-diabetes with high sodium intake | 199.2 ± 3.3 | 205.5 ± 15.7 | 45.4 ± 0.7 | |||
| 126 mg/dL < FBG, received medical treatment for diabetes, or diagnosed with diabetes & daily sodium intake ≤ 5,335 mg | ||||||
| Diabetes with low sodium intake | 186.7 ± 2.5 | 177.6 ± 8.2 | 44.2 ± 0.8 | |||
| Diabetes with high sodium intake | 190.0 ± 3.9 | 191.9 ± 16.3 | 43.5 ± 1.0 | |||
| Sodium | Kim et al. [46] | Total | 189.62 ± 0.30 | 130.09 ± 0.85 | 52.66 ± 0.11 | |
| Daily sodium intake, g | ||||||
| < 2 | 182.95 ± 2.14 (Men) | 149.74 ± 6.93 (Men) | 48.14 ± 0.61 (Men) | |||
| 194.44 ± 1.00 (Women) | 127.07 ± 2.75 (Women) | 53.65 ± 0.33 (Women) | ||||
| 2–4 | 185.18 ± 0.87 (Men) | 142.52 ± 2.46 (Men) | 48.98 ± 0.32 (Men) | |||
| 190.82 ± 0.61 (Women) | 112.63 ± 1.22 (Women) | 54.85 ± 0.22 (Women) | ||||
| 4–6 | 188.95 ± 0.86 (Men) | 154.47 ± 3.05 (Men) | 49.59 ± 0.29 (Men) | |||
| 189.79 ± 0.81(Women) | 112.19 ± 1.65 (Women) | 55.35 ± 0.28 (Women) | ||||
| 6–8 | 186.85 ± 1.13 (Men) | 153.98 ± 4.09 (Men) | 49.59 ± 0.35 (Men) | |||
| 190.85 ± 1.17 (Women) | 111.86 ± 2.34 (Women) | 56.06 ± 0.43 (Women) | ||||
| ≥ 8 | 189.36 ± 1.00 (Men) | 161.79 ± 4.08 (Men) | 49.56 ± 0.33 (Men) | |||
| 190.71 ± 1.33 (Women) | 110.17 ± 2.47 (Women) | 55.68 ± 0.47 (Women) | ||||
| Sodium | Oh et al. [47] | Total | - | 162.5 ± 9.67 (Obese) | 50.7 ± 1.54 (Obese) | |
| 62.6 ± 9.59 (Non-obese) | 44.0 ± 1.52 (Non-obese) | |||||
| 24-hour sodium excretion, mEq/day | ||||||
| < 110 | - | 86.4 ± 30.47 | 42.6 ± 4.22 | |||
| 110–180 | - | 139.9 ± 27.15 | 48.5 ± 3.76 | |||
| > 180 | - | 148.1 ± 28.32 | 52.6 ± 3.92 | |||
| Sodium | Oh et al. [48] | Total | - | - | - | |
| 24-hour sodium excretion, g/day | ||||||
| 2.7 (2.3–3.1) | 188.6 ± 35.8 | 123.6 ± 92.7 | 53.4 ± 13.0 | |||
| 3.7 (3.4–4.1) | 189.0 ± 36.0 | 131.4 ± 112.5 | 52.7 ± 12.8 | |||
| 4.6 (4.1–5.0) | 189.4 ± 36.1 | 136.9 ± 112.8 | 52.5 ± 12.8 | |||
| 5.9 (5.2–6.5) | 191.0 ± 36.8 | 147.5 ± 123.3 | 52.0 ± 12.5 | |||
| Fat | Lee and Kim [49] | Total (BMI ≥ 25 kg/m2) | - | - | - | |
| Fat | Park et al. [50] | Total | 159.30 ± 1.64 (Men) | 188.73 ± 0.58 (Men) | 45.72 ± 0.42 (Men) | |
| 114.99 ± 0.90 (Women) | 186.57 ± 0.54 (Women) | 51.42 ± 0.52 (Women) | ||||
| Sugar | Kim et al. [51] | Total | 185.1 ± 4.4 (Men) | 116.9 ± 6.5 (Men) | 48.6 ± 1.5 (Men) | |
| 188.3 ± 2.9 (Women) | 105.2 ± 4.1 (Women) | 52.8 ± 1.0 (Women) | ||||
| Coffee-mix drinkers* | 185.8 ± 5.6 (Men) | 118.8 ± 9.5 (Men) | 47.2 ± 2.0 (Men) | |||
| 182.1 ± 4.4 (Women) | 109.1 ± 5.9 (Women) | 50.7 ± 1.5 (Women) | ||||
| Non-drinkers | 183.0 ± 7.0 (Men) | 111.7 ± 11.4 (Men) | 51.1 ± 2.5 (Men) | |||
| 193.1 ± 3.8 (Women) | 102.9 ± 5.1 (Women) | 54.2 ± 1.3 (Women) | ||||
| Sugar | Hur et al. [52] | Total | 169.8 ± 26.4 | 63.0 | 58.8 ± 11.2 | |
Values are presented as mean ± standard deviation.
FBG, fasting blood glucose; HDL-C, high-density lipoprotein cholesterol; BMI, body mass index.
*Coffee-mix is a mixture of instant coffee, sugar, and coffee-creamer.
![]()
Variables related to sodium intake
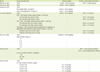
Table 3 presents levels of sodium intake or 24-hour urine sodium excretion. Studies of Rhie et al. [43], Lim and Yang [45], and Oh et al. [48] presented levels of sodium intake and urinary sodium excretion. In Lim and Yang [45], average daily sodium intake and total 24-hour urinary sodium excretion were 5,393.1 mg and 130.5 mmol/L, respectively. Normal, pre-diabetic, and diabetic subjects with low sodium intake had lower urinary sodium excretion than subjects with high sodium intake.
Table 3
Variables related to sodium intake in reviewed studies
| Study | Group classification | Sodium intake | 24-hour urine sodium excretion | |
|---|---|---|---|---|
| Rhie et al. [43] | Total | 4,330 ± 1,779.2 mg/day | 4,370 ± 2,289 mg/day | |
| Choi et al. [44] | Total | 3,776.1 ± 1,910.3 mg/day | - | |
| Song et al. [21] | Total | - | - | |
| Overweight (BMI ≥ 25 kg/m2) | 5,490.5 ± 93.8 mg/day | - | ||
| Non-overweight (BMI < 25 kg/m2) | 5,051.7 ± 43.9 mg/day | - | ||
| Lim and Yang [45] | Total | 5,393.1 ± 75.2 mg/day | 130.5 ± 1.1 mmol/L | |
| FBG < 100 mg/dL & daily sodium intake ≤ 5,335 mg | ||||
| Normal with low sodium intake | - | 127.3 ± 1.6 mmol/L | ||
| Normal with high sodium intake | - | 134.2 ± 2.2 mmol/L | ||
| 100 ≤ FBG < 126 mg/dL & daily sodium intake ≤ 5,335 mg | ||||
| Pre-diabetes with low sodium intake | - | 127.9 ± 2.2 mmol/L | ||
| Pre-diabetes with high sodium intake | - | 138.3 ± 3.7 mmol/L | ||
| 126 mg/dL < FBG, received medical treatment for diabetes, or diagnosed with diabetes & daily sodium intake ≤ 5,335 mg | ||||
| Diabetes with low sodium intake | - | 121.4 ± 2.9 mmol/L | ||
| Diabetes with high sodium intake | - | 135.4 ± 5.7 mmol/L | ||
| Kim et al. [46] | Total | 4,866.02 ± 27.03 mg/day | - | |
| Daily sodium intake, g | ||||
| < 2 | - | - | ||
| 2–4 | - | - | ||
| 4–6 | - | - | ||
| 6–8 | - | - | ||
| ≥ 8 | - | - | ||
| Oh et al. [47] | Total | - | 189.7 ± 7.69 mEq/day (Obese) | |
| 114.8 ± 9.38 mEq/day (Non-obese) | ||||
| 24-hour sodium excretion, mEq/day | ||||
| < 110 | - | - | ||
| 110–180 | - | - | ||
| > 180 | - | - | ||
| Oh et al. [48] | Total | - | - | |
| 24-hour sodium excretion, g/day | ||||
| 2.7 (2.3–3.1) | 4.7 ± 3.2 g/day | - | ||
| 3.7 (3.4–4.1) | 4.9 ± 3.2 g/day | - | ||
| 4.6 (4.1–5.0) | 5.1 ± 3.3 g/day | - | ||
| 5.9 (5.2–6.5) | 5.1 ± 3.3 g/day | - | ||
Values are presented as mean ± standard deviation.
BMI, body mass index; FBG, fasting blood glucose.
![]()
Variables related to fat intake
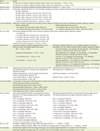
In reviewed articles, variables related to fat intake are presented in Table 4. The variables are fat intake, saturated fatty acid (SFA), monounsaturated fatty acid (MUFA), and polyunsaturated fatty acid (PUFA).
Table 4
Variables related to fat intake in reviewed studies

| Study | Group classification | Fat intake, g/day | SFA, g/day | MUFA, g/day | PUFA, g/day |
|---|---|---|---|---|---|
| Lee and Kim [49] | Total (BMI ≥ 25 kg/m2) | 54.7 ± 47.3 | 7.2 ± 7.3 | 9.2 ± 7.7 | 10.8 ± 9.1 |
| Park et al. [50] | Total | 38.94 ± 0.44 (Men) | 9.50 ± 0.14 (Men) | 15.73 ± 0.22 (Men) | 8.85 ± 0.09 (Men) |
| 29.88 ± 0.31 (Women) | 7.46 ± 0.09 (Women) | 12.03 ± 0.16 (Women) | 6.82 ± 0.07 (Women) |
Values are presented as mean ± standard deviation.
SFA, saturated fatty acid; MUFA, monounsaturated fatty acid; PUFA, polyunsaturated fatty acid; BMI, body mass index.
![]()
Variables related to sugar intake
Table 5 includes variables related to sugar intake. Kim et al. [51] studied the relationship between coffee-mix intake containing sugar and HDL-C. This study showed carbohydrate intake, coffee-mix intake, and coffee-mix’s contributions to energy in coffee-mix drinkers dwelling in Gangneung and Samcheok. Hur et al. [52] showed amounts of daily sugar intake in milk, fruit, beverages, and others. In the Hur et al. [52] study, intake of sugar from SSBs and continuous value of the metabolic syndrome scores at baseline had a significant positive relationship.
Table 5
Variables related to sugar intake of reviewed studies

| Study | Group classification | Carbohydrate intake, g/day | Coffee-mix intake, g/day | Coffee-mix’s contribution to energy, % | Total sugar*, g | % energy from total sugar | Sugar intake, g | |||
|---|---|---|---|---|---|---|---|---|---|---|
| Milk | Fruit | Beverage | Other† | |||||||
| Kim et al. [51] | Total | - | 8.9 ± 10.0 | - | - | - | - | - | - | - |
| Coffee-mix‡ drinkers | 13.4 ± 6.1 (Gangneung) | 16.6 ± 7.6 (Gangneung) | 3.4 ± 1.5 (Gangneung) | - | - | - | - | - | - | |
| 17.1 ± 8.8 (Samcheok) | 21.2 ± 10.9 (Samcheok) | 4.7 ± 2.5 (Samcheok) | ||||||||
| Hur et al. [52] | Total | - | - | - | 34.5 | 8.3 | 0.0 | 5.4 | 0.4 | 21.8 |
Values are presented as mean ± standard deviation.
*Total sugar category contained food source such as fruit, milk, beverages, and other sugar;
†
Other sugar was defined as total sugar excluded from fruit, milk, beverages, and contained sweets (chocolate, caramels, candies, jellies, gum), sweetened grains (cakes, doughnuts, waffles and pancakes), sweetened dairy products (flavored yogurt, flavored milk), syrup, and natural sugar from grains and vegetables; ‡Coffee-mix is a mixture of instant coffee, sugar, and coffee-creamer.
![]()
Relationship of nutrient intake with obesity or dyslipidemia-related factors
The relationship of nutrient intake with increased prevalence of obesity or dyslipidemia-related factors is presented in Table 6. The results are as follows. Rhie et al. [43] showed that dietary sodium intake had a positive correlation with the levels of TG (r = 0.361, p < 0.05) and B-lipoprotein (r = 0.413, p < 0.05). Choi et al. [44] presented that dietary sodium intake and serum HDL-C had a negative correlation (r = −0.11, p < 0.05). Based on Song et al.’s study [21], men in the 4th and 5th quintiles had higher risk of being overweight than men in the lowest quintile. Men in the 4th and 5th quintile had higher odds of being obese with odds ratios (ORs) of 1.37 (95% confidence interval [CI], 1.02–1.82) and 1.67 (95% CI, 1.23–2.27), respectively. In men, a significant trend of ORs in each quintile was found (p = 0.003). In women, p value for trend of ORs in each quintile was 0.058. Lim and Yang [45] reported association of WC with dietary sodium intake according to the presence of diabetes. In subject with pre-diabetes, WC had was a positive association with sodium intake. Kim et al. [46] proved that men with high sodium intake had a positive association with obesity. Compared to men with less than 2 g of sodium intake, ORs was 1.40 for 4–6 g intake (95% Cl, 1.07–1.85), 1.41 for 6–8 g intake (95% CI, 1.05–1.89), and 1.61 (95% CI, 1.19–2.18) for more than 8 g intake group. In men, the p value for trend of ORs in each group was 0.02. This study suggested more than 2 g of daily sodium intake may be independently associated with increased risk of obesity in men. In the Oh et al.’s study [47], 24-hour urine sodium excretion had significant correlations with increased BMI, abdominal circumference, computed tomography (CT) subcutaneous fat, and CT visceral fat. Compared to the lowest sodium excretion group (24-hour sodium intake < 110 mEq/day), the highest sodium group (24-hour sodium intake > 180 mEq/day) had an increased abdominal obesity, high TG, and high blood pressure with ORs of 44.76 (95% CI, 5.29–378.68), 32.79 (95% CI, 2.43–442.62), and 6.60 (95% CI, 1.29–33.68), respectively. Also, the sodium excretion group (100 mEq/day ≤ 24-hour sodium intake ≤ 180 mEq/day) had greater odds for having high TG with an ORs of 39.09 (95% CI, 2.74–556.92). The result of Oh et al. [48] showed systolic blood pressure, diastolic blood pressure, WC, body fat percentage, and body fat mass had positive relationship with 24-hour urine sodium excretion (p < 0.001 for trend). The relationship between 24-hour urine sodium excretion and TG or glucose was linear (p < 0.005). However, HDL-C had inversely related to 24-hour urine sodium excretion.
Table 6
Relationship of nutrient intake with obesity or dyslipidemia-related factors in each study
| Study | Result | |||
|---|---|---|---|---|
| Rhie et al. [43] | The Pearson’s correlation coefficient between dietary sodium and triglyceride: r = 0.361, p < 0.05 | |||
| The Pearson’s correlation coefficient between dietary sodium and B-lipoprotein: r = 0.413, p < 0.05 | ||||
| Choi et al. [44] | The Pearson’s correlation coefficients between dietary sodium and HDL-C: r = −0.11, p < 0.05 | |||
| Song et al. [21] | Multivariate-adjusted OR (95% CI) of risk of being overweight according to quintile of dietary sodium intake by logistic regression | |||
| Quintile 1: Reference | ||||
| Quintile 2 (Men, Women): 1.35 (1.03–1.78), 1.02 (0.77–1.35) | ||||
| Quintile 3 (Men, Women): 1.22 (0.92–1.61), 1.03 (0.77–1.37) | ||||
| Quintile 4 (Men, Women): 1.37 (1.02–1.82), 1.10 (0.82–1.48) | ||||
| Quintile 5 (Men, Women): 1.67 (1.23–2.27), 1.31 (0.96–1.79) | ||||
| p value for trend (Men, Women): p = 0.0033, p = 0.058 | ||||
| Lim and Yang [45] | Association of waist circumference with dietary sodium intake according to the presence of diabetes by logistic regression analysis | |||
| Model 1 (unadjusted) | Model 2 (adjusted for age and sex) | |||
| - Pre-diabetes with low sodium intake: Reference | - Pre-diabetes with low sodium intake: Reference | |||
| - Pre-diabetes with high sodium intake: 1.479 (1.042–2.099) | - Pre-diabetes with high sodium intake: 1.590 (1.109–2.280) | |||
| Kim et al. [46] | Multivariate-adjusted ORs (95% CI) for obesity according to daily sodium intake by logistic regression analysis | |||
| < 2 g: Reference | ||||
| 2–4 g (Men, Women): 1.27 (0.97–1.67), 1.01 (0.87–1.17) | ||||
| 4–6 g (Men, Women): 1.40 (1.07–1.85), 1.04 (0.87–1.23) | ||||
| 6–8 g (Men, Women): 1.41 (1.05–1.89), 1.02 (0.82–1.26) | ||||
| ≥ 8 g (Men, Women): 1.61 (1.19–2.18), 1.21 (0.96–1.54) | ||||
| p value for trend (Men, Women): p = 0.020, p = 0.494 | ||||
| Oh et al. [47] | Spearman correlation coefficient between 24-hour urine sodium excretion and obesity-related risk indices | Multivariate-adjusted ORs (95% CI) of metabolic syndrome risk factors according to 24-hour sodium excretion levels by logistic regression analysis | ||
| BMI: r = 0.49, p < 0.001 | Abdominal obesity (< 110 mEq/day, 110–180 mEq/day, > 180 mEq/day): reference, 5.30 (0.90–31.16), 44.76 (5.26–378.68) | |||
| Abdominal circumference: r = 0.44, p < 0.001 | High triglyceride (< 110 mEq/day, 110–180 mEq/day, > 180 mEq/day): reference, 39.09 (2.74–556.92), 32.79 (2.43–442.62) | |||
| CT subcutaneous fat: r = 0.38, p < 0.001 | Low HDL-C (< 110 mEq/day, 110–180 mEq/day, > 180 mEq/day): reference, 0.22 (0.05–0.95), 0.18 (0.04–0.79) | |||
| CT visceral fat: r = 0.44, p < 0.001 | High fasting glucose (< 110 mEq/day, 110–180 mEq/day, > 180 mEq/day): reference, 0.45 (0.02–9.40), 4.09 (0.27–61.93) | |||
| High blood pressure (< 110 mEq/day, 110–180 mEq/day, > 180 mEq/day): reference, 0.34 (0.06–2.03), 6.60 (1.29–33.68) | ||||
| Oh et al. [48] | Adjusted associations between 24-hour urine sodium excretion and metabolic syndrome components after adjusting for multiple covariates | Adjusted association between 24-hour urine sodium excretion and body fat after adjusting for multiple factors | ||
| Positive relationship (p < 0.001 for trend): Systolic blood pressure, diastolic blood pressure, WC | Body fat percentage (p < 0.001 for trend) | |||
| Linear relationship (p < 0.005): TG, glucose | Body fat mass (p < 0.001 for trend) | |||
| Inverse relationship (p < 0.001): HDL | ||||
| Lee and Kim [49] | The association of many types of fat intake with % body fat estimated from a standard multivariate model for energy adjustment for obese adults | |||
| Total fat (g): beta (0.065), p value (0.010) | ||||
| Saturated fat (g): beta (1.148), p value (0.009) | ||||
| Monounsaturated fat (g): beta (−1.498), p value (0.005) | ||||
| Polyunsaturated fat (g): beta (0.680), p value (0.002) | ||||
| Total energy (kcal): beta (−0.001), p value (0.215) | ||||
| Park et al. [50] | Multivariate-adjusted ORs (95% CI) associated with dietary fatty acid on LDL hypercholesterolemia by logistic regression analysis in men | Multivariate-adjusted ORs (95% CI) associated with dietary fatty acid on HDL hypocholesterolemia by logistic regression analysis in men | ||
| TFA (≤ 13.76 g/day): Reference | SFA (≤ 2.84 g/day): Reference | |||
| TFA (> 41.29 g/day): 1.274 (1.028–1.578) | SFA (> 11.36 g/day): 1.299 (1.067–1.581) | |||
| MUFA (≤ 5.66 g/day): Reference | PUFA (≤ 4.01 g/day): Reference | |||
| MUFA (> 19.13 g/day): 1.295 (1.050–1.597) | PUFA (> 10.76 g/day): 1.221 (1.006–1.483) | |||
| PUFA (≤ 4.01 g/day): Reference | LNA (≤ 0.37 g/day): Reference | |||
| PUFA (> 10.76 g/day): 1.282 (1.042–1.578) | LNA (> 1.50 g/day): 1.281 (1.067–1.537) | |||
| LNA (≤ 0.37 g/day): Reference | n-3 fatty acid (≤ 0.64 g/day): Reference | |||
| LNA (> 1.52 g/day): 1.253(1.031–1.523) | n-3 fatty acid (> 2.42 g/day): 1.288 (1.074–1.545) | |||
| EPA (≤ 0.02 g/day): Reference | n-6 fatty acid (≤ 3.13 g/day): Reference | |||
| EPA (> 0.28 g/day): 1.211 (1.003–1.462) | n-6 fatty acid (> 8.63 g/day): 1.217 (1.002–1.480) | |||
| n-3 fatty acid (≤ 0.65 g/day): Reference | ||||
| n-3 fatty acid (> 2.48 g/day): 1.248 (1.025–1.519) | ||||
| Kim et al. [51] | Correlation coefficient between daily coffee-mix intake and HDL-C: r = −0.13152, p = 0.0661 | |||
| Correlation coefficient between coffee-mix’s contribution to energy intake (% kcal) and HDL-C: r = −0.14627, p = 0.0408 | ||||
| Hur et al. [52] | Multiple linear regression of total energy, total sugar, and sub-group sugar at baseline (9–10 years) on CVD risk factors | |||
| Association between beverage sugar and continuous value of the metabolic syndrome scores (beta: 0.04, p < 0.05) | ||||
OR, odds ratio; CI, confidence interval; BMI, body mass index; HDL, high-density lipoprotein; LDL, low-density lipoprotein; CT, computed tomography; WC, waist circumference; TG, triglycerides; TFA, total fatty acid; SFA, saturated fatty acid; MUFA, monounsaturated fatty acid; PUFA, polyunsaturated fatty acid; LNA, linolenic acid; EPA, eicosanoic acid; CVD, cardiovascular disease.
![]()
There were two results of reviewed articles linked to fat intake. One by Lee and Kim [49] indicated association between various types of fat intake and % body fat estimated from a standard multivariate model for energy adjustment for obese adults. Intakes of total fat, saturated fat, and polyunsaturated fat were positively associated with % body fat. The other study found that in men, intakes of total fatty acid (TFA), MUFA, PUFA, linolenic acid (LNA), n-3 fatty acid, and n-6 fatty acid were positively associated with the risk of high LDL-C and HDL hypocholesterolemia had positive associations with intakes of SFA, PUFA, LNA, n-3 fatty acid, and n-6 fatty acid [50]. However, in women, there was an association between intake of fatty acids and % body fat.
There were two reviewed studies related to sugar intake. In Kim et al. [51] sugar-sweetened coffee drink study, coffee-mix’s contributions to energy was negatively correlated with HDL-C (r = 0.14627, p < 0.05). Additionally, Hur et al. [52] presented that sugar intake from SSBs had a positive relationship with cMetS at baseline (beta = 0.04, p = 0.02).
DISCUSSION
Adverse health consequences of obesity include dyslipidemia, the metabolic syndrome, CHD, type 2 diabetes mellitus, and hypertension [5354555657].
The aim of this present systemic review was to identify the associations of obesity and dyslipidemia with intake of nutrients among Korean population based on Koreans database. We found that significant associations of obesity and its related diseases with intake of nutrients such as sodium, fat, and sugar.
First, high sodium intake contributed to increased TG, HDL hypocholesterolemia, a risk of being overweight, waist circumference, body mass index, abdominal obesity, blood pressure, and body fat percentage. According to previous researches, sodium intake was linked to obesity [2122232425]. A study reported that salty foods stimulate brain’s reward response, and the increased calorie intake augments the incidence of overeating and obesity-related diseases [58]. Although there are few review studies published in the literature, this present study using data from Koreans systematically showed the same result of aforementioned researches. However, more studies are needed to identify relations between high sodium and obesity or dyslipidemia among Korean population.
Fat intake contributed to increased body fat, LDL hypercholesterolemia, and HDL hypocholesterolemia. For example, body fat had positive associations with TFA, SFA, and MUFA intake in Lee and Kim’s study [49]. Furthermore, Park et al. [50] indicated positive associations between LDL hypercholesterolemia or HDL hypocholesterolemia and fatty acid. LDL hypercholesterolemia was positively associated with excessive intake of TFA, MUFA, PUFA, LNA, n-3 fatty acid, and n-6 fatty acid in men. Excessive intake of SFA, MUFA, PUFA, LNA, n-3 fatty acid, and n-6 fatty acid was significantly associated with increased HDL hypocholesterolemia in men.
Fat is an important energy source in the human body and excellent source of essential fatty acid and fat-soluble vitamins. However, fat intake can be the cause of arteriosclerosis, myocardial infarction, and hyperlipidemia based on the amount and types of fat [32]. In general, SFA contributes to increased cardiovascular disease (CVD), PUFA contributes to decreased serum cholesterol and decreased incidence of coronary-artery disease, MUFA contributes to reduced LDL-C levels [3259]. Additionally, n-3 PUFA is a precursor of prostaglandin that reduces blood clotting and is good for prevention of heart disease, and n-6 PUFA generates form of blood clots and vasoconstriction [60616263].
This reviewed study has different results compared to previous studies. In previous studies [5859606162], MUFA contributed to reduced LDL-C and n-3 fatty acid contributed to reduced blood clotting. In other words, MUFA and n-3 fatty acid had a beneficial effect on maintaining health. However, reviewed study showed MUFA and n-3 fatty acid had a significant positive association with LDL hypercholesterolemia and HDL hypocholesterolemia. Therefore, adequate fat intake is necessary to prevent deficiency or excessive intake of fats.
Sugar intake from instant coffee-mix and SSBs contributed to increased HDL-C and cMetS. In other words, obesity and metabolic disease could be increased when consuming sugar from coffee-mix and SSBs. In general, sugar is known to have associations with diabetes, CVD, obesity, high blood pressure and so on [333435]. A previous study on dietary patterns in Korean adults showed that consumption of high-fat, sweet, and coffee pattern among four dietary patterns, rice and kimchi pattern; high-fat, sweets, and coffee pattern; meat and alcohol pattern; and vegetables, grains, and fish pattern, only had a positive association with incidence of obesity. Also, in the study, the consumption of carbohydrate increased neutral fats and decreased HDL-C [64]. Sugar is a major source of carbohydrate and fats. Therefore, higher consumption of instant-coffee mix intake could increase intake of saturated fats and simple sugars [65]. But, reviewed articles could not fully explain the result mentioned above. So, further studies among Koreans are needed to prove a relationship of sugar and obesity.
This qualitative systemic review study has several limitations. First, the number of reviewed studies was not enough to compare the associations between obesity or dyslipidemia-related diseases and intake of nutrients such as sodium, fat, and sugar. Only 7 reviewed articles were related to sodium intake, two articles were related to fat intake. In addition, there was only one related to obesity or dyslipidemia-related diseases. Also, the 5 of 12 reviewed studies were analyzed using KNHANES. So, more studies such as randomized controlled trials for Koreans need to be conducted. In spite of several limitations, there are a few strengths in this present study. First, there has been not a qualitative systemic review on relationship of obesity-related diseases and intake of nutrients including sodium, fat, and sugar until now in Korean population.
In conclusion, this qualitative systematic review demonstrated associations between obesity-related diseases and integrated dietary factors including sodium, fat, and sugar intake in Korean population. Since there were very few studies about Korean population, more randomized controlled trials on relationship between nutrition intake and obesity in Korean population are needed to provide information for quantitative reviews and meta-analysis.
 XML Download