

 PDF
PDF ePub
ePub Citation
 Print
Print


INTRODUCTION
Iron, an essential component in human tissue, plays a crucial role in transporting oxygen in the body as well as in cellular processes including DNA, RNA, and protein synthesis [1234]. Hemoglobin, an oxygen-carrying protein in red blood cells, accounts for about two-thirds of body’s iron supply. About 10% of essential iron contributes to the formation of myoglobin, cytochrome, iron-containing enzymes. The remaining of iron is stored as ferritin and hemosiderin. Iron deficiency has been one of common nutritional problems around the world. Recently, attention has been paid to iron overload, which is the opposite problem of iron deficiency, in developed countries [13].
Iron overload is characterized by the excessive accumulation of iron in the body, which is known as hemochromatosis. It is defined as serum ferritin levels > 400 ng/mL for men and > 300 ng/mL for women or as transferrin saturation (TSAT) levels > 50% for men and > 45% for women [2]. It has been suggested that excess amount of free iron in the body cause the formation of oxygen radicals leading to peroxidative damages to vital cell structures. In fact, it was reported that iron overload was associated with increased risks of liver disease, diabetes mellitus, cardiovascular disease, and Parkinson’s and Alzheimer’s diseases [34].
Data on the association between lifestyle factors, such as alcohol consumption, smoking, physical activity, and iron overload are still limited and inconsistent. Alcohol consumption tends to increase iron absorption by down-regulating hepcidin, which is a major regulator of iron homeostasis, and may lead to iron accumulation in the body [56]. However, epidemiological data on the alcohol consumption and iron overload in general populations are limited [7]. There have been controversial findings on the association between smoking and iron status. One study reported no difference in plasma iron levels between non-smokers and smokers [8]. But, another study examined that pregnant women who had smoked had higher ferritin levels in blood than those who had never smoked [9]. This discrepancy may be due to the use of different iron biomarkers; ferritin and TSAT are better indicators of iron status than iron in serum or plasma. In terms of the link between physical activity and iron status, some studies reported that ferritin and transferrin levels in blood were elevated after treadmill running test [1011]. Limitations of these previous studies on the association between lifestyle factors and iron overload include a small sample size and a lack of generalizability. In addition, to the best of our knowledge, there is no study to examine joint effects of lifestyle factors on iron overload.
In present study, we investigated on the associations of smoking status, alcohol consumption, and physical activity with iron overload, which was defined by TSAT levels. Furthermore, we conducted joint analysis of smoking status and alcohol consumption in the association with iron overload.
MATERIALS AND METHODS
Study population
We carried out a cross-sectional study embedded in a population-based cohort study, which is an ongoing longitudinal investigation [1213]. The study participants were 2,347 Korean aged 49–79 years who completed the follow-up interview of the cohort study between February 2011 and November 2012 and provided blood samples for assays of iron status biomarkers. In the questionnaire-based interview, they provided informationon socio-demographics, lifestyle factors, health status, and medical history. They singed an informed consent form approved by the Human Subjects Review Committee at the Korea University Ansan Hospital. After excluding participants who reported diagnosis of cancer, diabetes mellitus, and hypertension or who showed iron deficiency (TSAT levels < 15%) or who had missing values of lifestyle factors were excluded. Finally, 1,973 participants were remained for the analysis.
Blood collection and assessments
All participants fasted for at least 8 hours before the beginning of blood collection. Serum samples were collected and delivered to the Seoul Clinical Laboratories (Seoul, Korea) for assays of iron, ferritin, and unsaturated iron-binding capacity (UIBC), which was used to calculate total iron-binding capacity (TIBC) and TSAT. TIBC was obtained by adding serum iron and UIBC concentrations, and TSAT was calculated by multiplying the ratio of serum iron and TIBC by 100. Regarding assay methods, colorimetry for iron and UIBC and immunoassays for ferritin were used. Applicable assay kits were purchased from Siemens (Tarrytown, NY, USA) and Nittobo (Osaka, Japan).
Lifestyle factors and other confounding variables
Information on lifestyle factors such as smoking status, alcohol consumption, and physical activity levels was collected. Anthropometric measurement was conducted by a trained researcher. According to a standardized protocol, height (cm) and body weight (kg) were measured to the nearest 0.1 cm or 0.1 kg, respectively, without footwear, and body mass index (BMI, kg/m2) was calculated. Information on smoking status (never/former smoker/current smoker) and the number of cigarettes smoked was obtained. Information on the average frequency of alcohol drinking occasions, the amount of alcohol consumed on a typical occasion, and the volume of one standard drink for each alcoholic beverage was obtained, and the daily amount of alcohol consumed (g/day) was calculated. Participants were also asked to complete a table that inquired about alcohol drinking amount and pattern in the past 30 days. Thus, we collected information on average frequency of drinking occasion, amount of 6 types of alcoholic beverage (beer, wine, hard liquor, and 3 types of traditional drinks, including soju, chungju, and makgeolli) consumed for a typical occasion, and the volume of 1 standard drink for each type of alcoholic beverage. We calculated beverage-specific alcohol consumption in g/day on the basis of the alcohol content (4.5% for beer, 12% for wine, 40% for hard liquor, 22% or 25% for soju, 16% for chungju, and 6% for makgeolli), the frequency of drinking, and the amount consumed. We calculated total alcohol consumption (g/day) by summing up the beverage-specific amount consumed as well as total liquor consumption (g/day) by summing up the alcohol amount from liquor, including hard liquor, soju, and chungju. Information on physical activity level was obtained using five categories for activity intensity with open-ended questions about the hours spent in a typical day per level of intensity. A total metabolic equivalent score (MET) was calculated by multiplying the hours spent at a particular activity intensity by its MET values (1.0 for sleep or sedentary, 1.5 for very light activity, 2.4 for light activity, 5.0 for moderate activity, and 7.5 for vigorous activity), which were determined based on examples of activities given for each category. Confounding variables such as age, sex, and the presence of hypertension or diabetes mellitus were collected. The presence of hypertension was confirmed by using antihypertensive medications or having systolic blood pressure (BP) of ≥ 140 mmHg or diastolic BP of ≥ 90 mmHg. BP was measured in a sitting position using a mercury sphygmomanometer after a rest period of at least 5 minutes. Repeated BP measurements were performed at approximately 30-second intervals and recorded to the nearest 2 mmHg. The average of two measurements each in the left and right arms was calculated for systolic and diastolic BP. The presence of diabetes mellitus was confirmed if the following criteria were met: fasting plasma glucose level of ≥ 126 mg/dL or postprandial glucose level of ≥ 200 mg/dL or use of medications for diabetes mellitus.
Statistical analysis
According to the quartiles of TSAT levels, descriptive statistics for demographic and clinical characteristics, information on lifestyle factors, and blood assay results of the study participants were calculated. For continuous data, the ANOVA test was used to assess differences in means across the quartiles of TSAT levels. For categorical data, a chi-square test was used to assess differences in proportions across the quartiles of TSAT levels. We defined iron overload as TSAT levels > 50% for men and > 45% for women. To analyze associations between iron overload and lifestyle factors, we conducted multivariate logistic regression analysis and obtained odds ratio (OR) and 95% confidence interval (CI). In the multivariate models, covariates including age (continuous), sex, BMI (continuous), smoking status (categories: nonsmoking, former smoking, current smoking of 1–10 cigarettes/day, or current smoking of > 10 cigarettes/day), alcohol consumption (categories: nondrinking, alcohol consumption of 1–14.9 g/day, 15–30 g/day, or > 30 g/day), MET for physical activity (continuous), the presence of hypertension or diabetes mellitus (binary) were included. We also performed stratified analysis by sex and joint analysis of smoking status and alcohol consumption in the association with iron overload. Statistical significance was set at 0.05. All statistical analyses were performed with the SAS version 9.4 software (SAS Institute, Cary, NC, USA).
RESULTS
This cross-sectional study included 1,118 (56.7%) men and 855 women (43.3%). Among them, 288 (25.8%) men and 129 (15.1%) women had iron overload. Table 1 shows descriptive statistics on lifestyle factors, confounding variables, and iron biomarkers according to the quartiles of TSAT levels. Participants with higher TSAT levels were more likely to be younger (p < 0.01), men, smokers, and alcohol drinkers (p < 0.001) and less likely to have hypertension (p < 0.01).
Table 1
Characteristics of 1,973 participants by transferrin saturation levels (n = 1,973)
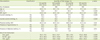
Values expressed as percentage or mean ± standard deviation (SD).
BMI, body mass index; MET, total metabolic equivalent score; TIBC, total Iron binding capacity; TSAT, transferrin saturation.
![]()
Table 2 presents results for the associations between iron overload and lifestyle factors in all participants. Heavy alcohol drinkers had 1.6-fold higher OR (95% CI, 1.11–2.36) of iron overload than non-drinkers. Heavy smokers were likely to have a higher OR than never-smokers (p = 0.07).
Table 2
Associations between lifestyle factors and iron overload (n = 1,973)
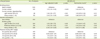
OR, odds ratio; CI, confidence interval; MET, total metabolic equivalent score.
*Data are adjusted for age, sex, body mass index, smoking status, alcohol consumption, physical activity, and the presence of hypertension or diabetes mellitus.
![]()
Next, we evaluated associations stratified by sex between lifestyle factors and iron overload (Table 3). In men, heavy alcohol drinkers had 1.7-fold higher OR (95% CI, 1.13–2.56) of iron overload than non-drinkers while heavy smoking tended to increase OR (p = 0.19). In women, former or current smokers had 1.9-fold higher OR (95% CI, 1.01–3.63) of iron overload than never-smokers while moderate or heavy alcohol consumption tended to increase OR (p = 0.62).
Table 3
Associations between lifestyle factors and iron overload (n = 1,973)
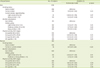
OR, odds ratio; CI, confidence interval; MET, total metabolic equivalent score.
*Data are adjusted for age, body mass index, smoking status, alcohol consumption, physical activity, and the presence of hypertension or diabetes mellitus.
![]()
Table 4 presents results for the association iron overload in joint analysis of smoking status and alcohol consumption. Compared with non-smokers who abstained from alcohol consumption, smokers with > 10 cigarettes/day who consumed alcohol > 15 g/day had a 2.6-fold higher OR (95% CI, 1.23–5.61) and any smokers with heavy alcohol consumption > 30 g/day had higher ORs between 2 and 3 for iron overload.
Table 4
Odds ratios of iron overload in joint analysis of smoking status and alcohol consumption in all participants (n = 1,973)
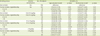
OR, odds ratio; CI, confidence interval.
*Data are adjusted for age, sex, body mass index, smoking status, alcohol consumption, physical activity, and the presence of hypertension or diabetes mellitus.
![]()
DISCUSSION
In a population-based cross-sectional study, we observed positive associations of alcohol consumption and smoking status with iron overload. In particular, the association for alcohol consumption was significant only among men while that for smoking was only among women. In addition, heavy smokers were more likely to have iron overload even if they had moderate alcohol consumption with 15 to 30 g/day. Heavy alcohol drinkers with > 30 g/day were more likely to have iron overload even if they were former smokers or moderate smokers with < 10 cigarettes/day.
Serum TSAT levels indicates the proportion of iron-binding sites of transferrin loaded with iron and has been used as a sensitive biomarker of iron status than serum iron or TIBC [14]. Its level is determined by sex, race, iron consumption, and the presence of infection or metabolic diseases as well as by genetic factors. Its normal values range between 15% and 40% approximately and thus TSAT levels > 50% for men or > 45% for women indicate iron overload or hemochromatosis. Iron overload with TSAT levels > 50% may lead to the accumulation of non-transferrin-bound iron or labile iron, which is involved in the production of reactive oxygen species (ROS) via the Fenton reaction or the Haber-Weiss reaction [34]. ROS have potency to damage cells and DNA.
Alcohol-induced disorders with abnormal iron metabolism have been investigated in animal models as well as in clinical and epidemiological studies. It was reported that patients with alcoholic liver disease are likely to have increased iron stores, as reflected by elevated serum iron biomarkers such as TSAT or ferritin. Alcohol consumption worsens the severity of disease in patients with genetic hemochromatosis [15]. A potential biological mechanism underlying these observations is that alcohol may be implicated in the regulation of hepcidin expression in the liver. Hepcidin is a key regulator of iron status by controlling iron absorption in the intestine. Reduced hepcidin concentrations by down-regulation of hepcidin expression allow intestinal absorption of iron leading to the elevation of circulating iron as well as iron storage. It was reported that alcohol consumption down-regulates hepcidin expression in a vitro study with hepatoma cells as well as in a vivo study with mice exposed to alcohol [16]. Hepcidin concentrations decreased after drinking alcohol and then iron absorption increased with promoting ferroportin as a corridor in the gastrointestinal cells and membrane of macrophage [1718].
Prior studies have examined elevated iron concentrations in smokers. As a potential biological mechanism, it has been suggested that smoking may stimulate erythropoiesis in a dose-related manner due to hypoxia, which is induced by smoking. In addition, hypoxia is likely to suppress hepcidin expression [8919202122].
Physical activity, especially intense physical activity, may cause a number of unfavorable changes, including an increase in the level of pro-inflammatory cytokines and decreased iron absorption [10]. One study showed that a high-intensity exercise test caused significant changes in hepcidin levels, interleukin-6, and iron metabolism during the recovery period [11]. Another study observed that serum iron levels decreased significantly during the recovery period after exercise [23].
The strengths of our study include a large sample size, investigation in a general population, consideration of a variety of lifestyle factors, and presentation of joint effects of lifestyle factors in the association with iron overload. Study limitations should be taken into account for the interpretation of our findings. Because the study design was cross-sectional, a causal relationship remains unclear. Because the findings may be generalizable to middle-aged and older Asians, further studies for other age groups or other ethnicities are warranted.
In this cross-sectional study, we observed that heavy alcohol drinking and smoking are positively associated with iron overload. On the basis of the findings, heavy alcohol drinking and smoking may need to be avoided to prevent iron accumulation in the body.
 XML Download