

 PDF
PDF ePub
ePub Citation
 Print
Print


INTRODUCTION
Diabetes, a metabolic disorder, results from insufficient insulin production in the body and/or ineffective action of insulin and is characterized by abnormally elevated blood glucose level [12]. This metabolic disorder directly and indirectly causes complications in other chronic disorders, including cardiovascular and cerebrovascular diseases [3]. Its incidence has increased in developed and developing countries because of the adoption of a Western diet and sedentary lifestyle, which has increased the occurrence of obesity [4]. In Korea, there has been an approximately 10% annual increase in the incidence of diabetes since 2010. In 2013, the Korean Diabetes Association predicted that 6 million Koreans will have diabetes by 2050 [5]. Most patients suffer from type 2 diabetes in association with lifestyle changes.
Diabetes self-management education focuses on lifestyle changes [678] and has improved clinical parameters in patients with diabetes [91011]. National standards for diabetes self-management education and support have been developed to facilitate these programs [12]. Diabetes education provides patients with diabetes with essential knowledge regarding continuous self-care [13]. In particular, diabetes-related nutritional education aims to promote changes in dietary behavior to maintain blood glucose levels within the normal range. Successful changes in dietary behavior and skills acquired for maintaining diabetic diets have significantly reduced body weight, body mass index (BMI), glycated hemoglobin (HbA1c) levels, fasting blood glucose (FBG) levels, and blood lipid levels in patients with diabetes [1415].
The beneficial effects of dietary education in diabetes have prompted efforts toward various types of education programs to increase the patients’ adherence to diet therapy [161718]. Several educational programs for patients with diabetes included group, small group, individual, and activity-based education [161718]. However, lecture-centered education, such as group education, may not sufficiently engage patient attention [19] and may encounter difficulties in transferring new knowledge to practice [20]. The combination of theory and practice in group diabetes education, such as diabetic camps, has effectively improved blood glucose control and adherence to recommended dietary habits at the same time [2122]. However, the ability of these group programs to provide personal nutritional education to individual patients with diabetes is limited. Personalized nutritional education is expected to facilitate appropriate diabetes self-management because patients with diabetes may present different risks for developing comorbidities such as heart disease and hypertension [23].
Herein, we hypothesized that the combination of activity and personalized nutrition education would improve the effectiveness of diabetes education. To do that, the effectiveness of activity-based personalized nutrition education (APNE), which involves hands-on training regarding meal choices, in educating patients with type 2 diabetes was evaluated.
MATERIALS AND METHODS
Study subjects
This study was approved by the Medical Research Ethics Committee of the Hallym University Medical Center (IRB No. 2014-01-09). Subjects were voluntarily recruited among outpatients who were diagnosed with type 2 diabetes at the Department of Internal Medicine of the Hallym University Medical Center between March and August 2014. Selection criteria included: 1) age (≥ 40 years), 2) presence of type 2 diabetes that was diagnosed according to the Diabetes Association criteria (FBG level ≥ 126 mg/dL; 2-hour oral glucose tolerance test level ≥ 200 mg/dL; or random blood glucose test level ≥ 200 mg/dL). Exclusion criteria were the presence of: 1) type 1 diabetes, 2) insulin treatment for type 2 diabetes, and 3) diabetic kidney complications such as diabetic nephropathy. Data regarding subject age, sex, insulin treatment, and diabetic complications were obtained from the medical registry. Among 111 patients who were screened for eligibility, 41 were excluded on the basis of the abovementioned criteria. The remaining 70 patients were randomly allocated to two groups, and the researchers were not blinded. The APNE group (n = 37) received personalized nutrition education along with hands-on experience in selecting a diabetic breakfast. The general instruction for diabetes (control, CTRL) group (n = 33) was provided information that is generally given to patients with diabetes. After 3 months, four participants from the APNE group and ten from the control group voluntarily withdrew from the study. The remaining participants were considered in the final analyses (Figure 1).
Study design and APNE for diabetes
After an initial screening, unlike their CTRL counterparts, patients who were assigned to the APNE group received tailored nutritional education by a registered dietician using a food exchange table, food models, and educational handouts about diabetes. The APNE consists of an education by a trained dietician after considering the anthropometric data, skills regarding food preparation, and pre-existing health condition and hands-on training, which involved meal selection according to the caloric needs, comparison of food selections with typical meals, and evaluation of meals to establish self-management skills for appropriate meal choices in the future. This education accounted for estimated recommended daily calorie intake, food preparation skills, food choices, understanding of pre-existing conditions, and the clinical practice guidelines for diabetes nutrition therapy (The Korean Diabetes Association 2012). The CTRL group received general nutrition information for diabetes according to the guidelines for diabetes nutrition therapy (The Korean Diabetes Association 2012), that is generally given to patients with diabetes. All the patients were subjected to anthropometry and blood chemistry measurements, participated in 24-hour dietary recall interviews and dietary behavior surveys, and returned to the hospital 3 months later for the same measurements and surveys. This 3-month follow-up was selected because significant improvement in clinical indicators has been previously observed 3 months after a nutritional education intervention program [1415].
Anthropometric measurements
Height and body weight were measured using an electronic instrument (DS-103; Jenix, Seoul, Korea), with the patients wearing light clothing. BMI was estimated using:
The waist circumference was determined between the bottom of the ribs and pelvis using a measuring tape with participants wearing only underwear and standing in the upright position.
Biochemical assessment
Blood samples were drawn from the subjects’ forearms after overnight fasting. The whole bloods were collected in ethylenediaminetetraacetic acid (EDTA)-treated tubes and centrifuged at 3,000 × g for 10 minutes at 4°C to separate plasma. FBG and 2-hour postprandial plasma glucose (PP2) levels were determined by the glucose hexokinase method using a Hitachi 7020 Autoanalyzer (Hitachi Ltd., Tokyo, Japan). Total cholesterol (Total-C), high density lipoprotein-cholesterol (HDL-C), and low density lipoprotein-cholesterol (LDL-C) levels were measured by the direct homogenous method. Triglyceride (TG) levels were assessed using a Hitachi 7600 Chemical Analyzer (Hitachi Ltd.). HbA1c levels were determined by high-performance liquid chromatography using a VARIANT II Turbo apparatus (Bio-Rad Laboratories, Hercules, CA, USA).
Dietary assessment via 24-hour dietary recall
Dietary intake was assessed using a 24-hour dietary recall with the help of a registered dietitian. Types and amounts of food and beverages that were consumed were recalled and recorded. Nutrition intake was analyzed using the Computer-Aided Nutritional Analysis Program (CAN-Pro4.0; Korea Nutrition Society, Seoul, Korea).
Survey of dietary behavior
The dietary behavior questionnaire comprised nine items, such as dietary and smoking questions from the Korean version of the Summary of Diabetes Self-Care Activities (SDSCA) and alcohol and carbohydrate consumption questions. SDSCA [2425] aids in the measurement of diabetes self-management levels in terms of diet, exercise, blood glucose monitoring, foot care, and smoking over a week [24]. Here, the dietary behavior during the previous 7 days was assessed through the following nine items: the daily number of meals, meal time regularity, adherence to meal plan, health-balanced eating, fruit and vegetable intake, high-fat food intake, carbohydrate intake throughout the day, alcohol consumption, and smoking. The score corresponded to the number of days per week, which ranged from zero to seven. Alcohol and smoking items were dichotomous yes/no questions.
Statistical analyses
The statistical analyses were performed using the SPSS ver. 21.0 (IBM SPSS Inc., Chicago, IL, USA). All data are presented as mean ± standard deviation. A p value of < 0.05 was considered statistically significant. General characteristics of the patients were analyzed using Student’s t-test, Mann-Whitney U test, and χ2 test. Anthropometric measurements, blood biochemistry, and dietary behavior scores obtained initially and after 3 months for APNE and CTRL groups were compared using Wilcoxon signed-rank and McNemar tests.
RESULTS
General characteristics of study subjects
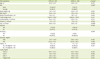
The general characteristics of the CTRL and APNE groups are listed in Table 1. No significant differences were detected between average age, sex ratio, body weight, BMI, total energy intake, alcohol, smoking, carbohydrate, protein, and lipid caloric proportions. Blood levels of FBG, PP2, HbA1c, Total-C, LDL-C, HDL-C, and TG were recorded in the CTRL and APNE groups.
Table 1
Characteristics of study subjects
CTRL, general instruction for diabetes (control); APNE, activity-based personalized nutrition education; BMI, body mass index; FBG, fasting blood glucose; PP2, 2-hour postprandial plasma glucose; HbA1c, glycated hemoglobin; Total-C, Total cholesterol; LDL-C, low density lipoprotein-cholesterol; HDL-C, high density lipoprotein-cholesterol.
*Statistical analysis by Independent t-test; †Mean ± standard deviation (SD); ‡No. (%); §Statistical analysis by χ2 test; ∥Statistical analysis by Mann-Whitney U test.
![]()
Changes in blood chemistry and anthropometry data
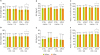
After 3 months, unlike the CTRL group, the APNE group displayed a significant reduction in FBG (p = 0.004), PP2 (p = 0.012), and HbA1c (p = 0.006) levels compared with the initial levels (Figure 2A-C). Similar to body weight, BMI and waist circumferences, Total-C, LDL-C, HDL-C, and TG levels retained their initial levels in both groups (data not shown). The CTRL and APNE groups were divided into subgroups according to their FBG, PP2, and HbA1c levels (Figure 3A-F). Only patients in the APNE group with baseline HbA1c levels exceeding 7.0% witnessed a decrease in body weight, BMI, and waist circumference after 3 months (Figure 3A-C). The APNE group that presented a baseline PP2 level of > 199 mg/dL and was considered not to attain glycemic control [26] exhibited lower body weight and waist circumference. In contrast, this change did not occur in the CTRL and APNE groups displaying a baseline PP2 of < 199 mg/dL (Figure 3D and 3F). No significant reduction in BMI was observed in the PP2 subgroups (Figure 3E). Furthermore, the FBG subgroups retained their body weight, BMI, and waist circumference. These data suggest that APNE improved the clinical parameters for the diabetic conditions. Furthermore, this approach only reduced the body weight, BMI, and waist circumference in subgroups exhibiting elevated baseline HbA1c and PP2 levels.
 | Figure 2Changes in FBG, PP2, and HbA1c levels in the CTRL and APNE groups. The CTRL group represents outpatients with type 2 diabetes who received regular instructions for diabetes. The APNE group represents outpatients who received APNE education. Changes in (A) FBG, (B) PP2, and (C) HbA1c levels in the CTRL and APNE groups. All values appear as mean ± standard error (SE).
FBG, fasting blood glucose; PP2, 2-hour postprandial plasma glucose; HbA1c, glycated hemoglobin; CTRL, general instruction for diabetes (control); APNE, activity-based personalized nutrition education.
All marks indicate a significant difference between groups according to Student’s t-test (*p < 0.01, †p < 0.05).
|
 | Figure 3Changes in body weight, BMI, and waist circumference in the CTRL and APNE groups. The CTRL group represents outpatients with type 2 diabetes who received regular instructions for diabetes and did not receive APNE education. APNE group represents outpatients who received APNE education. Changes in body weight (A and D), BMI (B and E), and waist circumference (C and F) in the CTRL and APNE groups, which were divided into sub-groups according to HbA1c (< 7% and ≥ 7%, respectively) and PP2 levels (< 199 mg/dL and ≥ 199 mg/dL, respectively). All values appear as mean ± standard error (SE).
BMI, body mass index; CTRL, general instruction for diabetes (control); APNE, activity-based personalized nutrition education; HbA1c, glycated hemoglobin; PP2, 2-hour postprandial plasma glucose.
All marks indicate a significant difference between groups according to Student’s t-test (*p < 0.05, †p < 0.01).
|
Changes in dietary behaviors after 3 months
After 3 months, the daily number of meals did not significantly change in the CTRL and APNE groups compared with initial data (Table 2). Despite a dramatic decrease in meal regularity, the number of days following the meal plan greatly increased to 1.3 days in the APNE group (p = 0.001). Moreover, this increase occurred in the CTRL group, albeit to approximately 0.4 days. In the APNE group, the number of fruit and vegetable intake days rose, while the number of high-fat food intake days and alcohol drinking days decreased. Both groups revealed significant increases in the number of days of having balanced diets. These results suggest that the patients who received the APNE education drastically increased the number of days with improved dietary behaviors compared with the patients who received a general CTRL education.
Table 2
The comparisons of dietary behaviors between the CTRL and the APNE groups

CTRL, general instruction for diabetes (control); APNE, activity-based personalized nutrition education.
*Each variable was measured on a 7-point scale ranging from 0 to 7 (0–7 days); †Statistical analysis by Wilcoxon signed rank test; ‡No. (%); §Statistical analysis by χ2 test; ∥Mean ± standard deviation (SD).
![]()
Changes in dietary intake of food groups and nutrients
Dietary intake between the initial visit and 3-month follow-up was compared by analyzing the 24-hour dietary recall data of the CTRL and the APNE groups (Table 3). Grain, root, tuber, saccharide, and fruit intake only significantly decreased in the APNE group. In contrast, only the egg intake increased in the CTRL group. The dietary intake of pulse increased in the APNE and CTRL groups. No significant differences in total energy intake were detected between the CTRL and APNE groups (data not shown). In the APNE group, the carbohydrate calorie intake decreased, whereas the protein and lipid intakes increased compared with the initial levels. The CTRL group demonstrated no significant changes in these percentages (Figure 4A-C). These data suggested that unlike the CTRL group, the APNE group decreased the dietary intake of carbohydrates while increasing its dietary consumption of proteins and lipids.
Table 3
The comparisons of changes in dietary intake of food groups between the CTRL and the APNE groups

CTRL, general instruction for diabetes (control); APNE, activity-based personalized nutrition education.
*Statistical analysis by Wilcoxon signed rank test. †Mean ± standard deviation (SD).
![]()
 | Figure 4Changes in carbohydrate, protein, and lipid calorie intake in the CTRL and APNE groups. The CTRL group represents outpatients with type 2 diabetes who only received regular instructions for diabetes. The APNE group represents outpatients who received APNE education. Changes in calories derived from (A) carbohydrates, (B) proteins, and (C) lipids in the CTRL and APNE groups. All values appear as mean ± standard error (SE).
CTRL, general instruction for diabetes (control); APNE, activity-based personalized nutrition education.
All marks indicate a significant difference between groups according to Student’s t-test (*p < 0.001, †p < 0.05).
|
DISCUSSION
This study demonstrated that the patients in the APNE group had lowered FBG, PP2, and HbA1c levels, suggesting that the activity-based approach increased the effectiveness of diabetes self-management education in middle-aged and older Koreans. A large proportion of individuals with type 2 diabetes in Korea comprise middle-aged or older adults [27]. In 2005, Korean individuals aged ≥ 60 years comprised approximately 45.1% of diabetes cases, among which approximately 70.2% presented with impaired fasting glucose [27]. In comparison, 38.6% of patients with diabetes were aged ≥ 65 years in the USA according to the National Health and Nutrition Examination Survey 1999–2000 [28]. Therefore, diabetes treatment requires an effective method to educate middle-aged and older Korean outpatients, and the APNE approach may improve the effectiveness of education.
Observed behaviors indicate that dietary changes are achievable. The APNE group exhibited significant changes in most aspects of the survey, except for the number of days spent consuming carbohydrates evenly throughout the day. Koreans mostly consume rice-centered diets, explaining the absence of significant differences in carbohydrate consumption between the groups or between baseline and 3-month follow-up. However, other factors, such as the number of days following a meal plan, consuming fruits and vegetables, and following a balanced diet, increased, while the number of days of consuming high-fat food decreased in the APNE group. These behavioral changes were further confirmed by the significant differences in the dietary intake of specific food groups. A significant reduction in carbohydrate intake that is associated with a decreased intake of grain indicated a decrease in the Korean-style rice-oriented diet. An increased consumption of pulse may have contributed to the higher protein intake in the APNE group. In contrast, clinical values did not demonstrate significant changes in the CTRL group, but the number of days following a meal plan and balanced diet noticeably increased. The CTRL group received general instructions regarding dietary behaviors at the same time when diabetes was diagnosed, which may have resulted in modest changes in dietary behaviors. Overall, personalized nutrition education with the practice of breakfast meal choices produced dietary behavioral changes more effectively than general instruction. In particular, changes in the initial FBG, PP2, and HbA1c levels after 3 months in the APNE group suggests that these behavioral changes were sufficient to improve clinical values. Interestingly, body weight, BMI, and waist circumference only decreased in the APNE group, with HbA1c or PP2 levels exceeding 7.0% and 199 mg/dL, respectively, suggesting that these subjects in the APNE group were sensitive to the APNE education and displayed significant changes in anthropometric measurements. After 3 months, initial body weight, BMI, and waist circumference decreased by 1.4%–2.5% on the average in the APNE group, which may appear small. However, after 6 months, lifestyle modifications, including dietary behaviors, caused the average body weight to decrease by 2.8% in Korean patients with type 2 diabetes [29]. In addition, because most of our subjects were not obese (BMI < 25 kg/m2), modest reductions in obesity-related factors were expected given the low baseline values compared with other studies that reported a larger reduction but included more obese individuals [30]. Initial BMI values averaged at 24.6 and 25.4 kg/m2 for the CTRL and APNE groups, respectively, which were significantly lower than the average BMI for patients with type 2 diabetes (32.30 ± 0.82 kg/m2) in the USA [28] but similar to average data or Asians with type 2 diabetes (24.4 ± 4.0 kg/m2) [31]. Therefore, the APNE approach may improve obesity-related parameters in middle-aged and older Korean patients with type 2 diabetes, particularly with high HbA1c or PP2 levels. Because obesity strongly contributes to type 2 diabetes [32], partly by disturbing the regulation of blood glucose level and insulin action [33343536], APNE-induced changes in obesity-related factors may have impacted diabetes-associated blood parameters. These observations are in accordance with a previous report where lifestyle modifications effectively reduced body weight and the incidence of type 2 diabetics [37].
Despite its effectiveness at improving blood FBG, HbA1c, and PP2 levels, the APNE approach failed to influence blood lipid concentrations. Our results are partially consistent with those findings demonstrating that dietary education provided by dietitians improved blood lipid profiles and FBG levels, HbA1c levels, body weight, and BMI in individuals with type 2 diabetes [1415]. Moreover, changes in lipid profiles have been observed with lifestyle modification with diet and exercise in patients with type 2 diabetes [30]. This indicates that the 3-month APNE education may be not sufficient to reduce blood lipid levels.
This study exhibited several limitations, such as a 3-month short-term study and a lack of significant changes in blood lipid levels. Therefore, further similar studies with a longer period are required. However, APNE effectively induced dietary behavioral changes accompanied with significant reductions in FBG, HbA1c, and PP2 levels and obesity-related parameters blood levels, particularly in those with higher HbA1c and PP2 levels. These findings suggest that the APNE-based dietary behavioral changes enhanced the body tolerance to blood glucose fluctuations. In conclusion, personalized nutrition education with the practice of breakfast choices appeared more effective in controlling diabetic conditions than regular diabetes instructions in middle-aged and older Korean outpatients with type 2 diabetes.
 XML Download