

 PDF
PDF ePub
ePub Citation
 Print
Print


INTRODUCTION
Obesity is an independent risk factor for a variety of chronic disease such as, metabolic syndrome and coronary heart disease [1]. Furthermore, it can lead to a higher incidence of psychological and behavioral problems. From a psychological viewpoint, previous studies [2345] have demonstrated associations between personality traits, weight status and eating behaviors. Based on psychosomatic theory [6], overeating maybe triggered by negative emotions related to emotional eating behavior.
Neuroticism is the tendency to experience negative emotions such as anxiety, depression, impulsiveness and vulnerability [7]. Specific personality traits such as neuroticism have been shown to be associated with higher weight status among women [8], larger waist circumference [9], higher levels of triglycerides [10] and hypertension [11]. Neuroticism has also been connected to emotions of the self or the body, emotional behavioral dysregulation [12] and eating disorder symptoms and diagnoses [13].
Emotional eating means the inclination to eat in response to negative emotions such as depression, disappointment, and feelings of loneliness [14]. It is considered as problematic eating style because it is associated with higher body weight [15] and intake of unhealthy foods [16]. Moreover, emotional eating behavior increases the risk of obesity [17] and might be a precursor to eating disorders [18] because of eventual cravings and overeating. In a large cross-sectional survey [19], emotional eating affects body weight status by enhancing palatable and energy-dense foods in women. Therefore, abnormal eating behavior leads high risk of weight gain in emotionally vulnerable population.
Coping skills are reflected physical, psychological, and social well-being [20]. A previous study reported that, women showed a strong tendency to use food to cope with emotional problems [21]. Obese subjects have been reported to have poorer psychological profiles [22], unhealthy eating habits [23], and decreased quality of life [24]. A better understanding of obese people who lack coping skills is required to improve and manage their health condition.
We therefore performed this study to assess the socio-psychology, eating behavior, quality of diet, and quality of life in adult women according to their weight status.
MATERIALS AND METHODS
Materials
This study was conducted from July 2013 to December 2013 and included 114 premenopausal women aged 20-49 years who resided in the Seoul metropolitan area. Prior to participation in the study, each subject signed an informed consent form that was approved by the institutional review board of Kyung Hee University (IRB# KHSIRB-13-033). This study was carried out in accordance with the principles for human research outlined in the declaration of Helsinki. The sample size was calculated by correlation analysis using G power 3.1 program.
Subjects were assigned to one of three groups based on their BMI according to the WHO criteria for the Asian population: normal weight (18.5 ≤ BMI < 23.0 kg/m2), overweight (23.0 ≤ BMI < 25.0 kg/m2), or obese (BMI ≥ 25 kg/m2) [1].
General characteristics and health-related information
Information regarding the general characteristics of the subjects (age, medical history, intake of medicine, family history, living status, school years, and occupation) was collected by experienced interviewers.
Additionally, we used a questionnaire to gather information about health-related behaviors such as frequency and duration of exercise, alcohol consumption, and smoking habits.
Anthropometric measures
For anthropometric measurements, participants were standing and dressed in light indoor clothing without shoes. A beam scale with a height rod graduated in centimeters was used (Inbody 770, InBody Co. Ltd., Seoul, Korea). Body weight was measured to the nearest 0.1 kg and height was measured to the nearest 0.1 cm. The scale was calibrated before the examination. BMI was computed using the formula weight (kg) divided by height (m2). To minimize variations in anthropometric measures, all measurements were obtained by the same experienced investigator.
Assessment of diet
Each participant was educated how to complete three-day food records using photos of appropriate portion sizes for three days, including two weekdays and one weekend day. All who completed records were evaluated for daily nutrients intake using the Computer Aided Nutritional Analysis Program (CAN Pro, Version 4.0, The Korean Nutrition Society, Seoul, Korea). Energy and fifteen nutrient intakes were compared with Dietary Reference Intakes for Koreans [25], which vary by age.
Assessment of socio-psychological factors
Personality traits (NEO Personality Inventory, NEO-PI-RS)
Personality traits were assessed by the Korean version of the NEO-PI-RS [26]. This 60-item validated questionnaire aims to assess the basic structure of normal personality according to the five domains of personality: neuroticism (tendency to experience negative emotions), extraversion (quantity and intensity of ones’ interpersonal interaction), openness (proactive seeking and appreciation of new experience), agreeableness (tendency to have faith in other people and to be eager to help them) and conscientiousness (degree of goal directed behaviors). Each question was scored from one to five points using a Likert scale. Cronbach’s alpha values for the five main domains in the NEO-PI-RS were as follows: 0.850 for neuroticism, 0.766 for extraversion, 0.691 for openness, 0.644 for agreeableness, and 0.720 for conscientiousness [27].
Coping style (Stress Coping Style Checklist)
Stress Coping Style was assessed using the modified version of the Stress Coping Style Checklist [28], which was originally developed by Folkman and Lazarus [29]. This checklist consists of 24 items assessing two categories of coping efforts: active (problem-focused and seeks social support) and passive (wishful thinking and emotion-focused) coping styles. Items were rated on a 4-point Likert scale from 1 (not at all) to 4 (very much). Cronbach’s alpha for the Coping Style Checklist was 0.87 [28].
Assessment of eating behaviors
Eating attitudes (Eating Attitudes Test-26, EAT-26)
Eating attitudes were assessed using the Korean version of EAT-26 [30], a short-form of the original 40-item version that is widely used to assess a broad range of eating attitudes and behaviors. The EAT-26 questionnaire consists of three subscales: dieting, bulimia and food preoccupation, and oral control. Items were rated on a 5-point Likert scale from 0 (not at all, not really) to 3 (very much). Scores on this scale range from 0 to 78, with scores above 20 indicating a probable eating disorder. The Korean version of EAT-26 has been reported to have good reliability in both non-clinical adult and adolescent populations [31].
Eating behavior (Dutch Eating Behavior Questionnaire, DEBQ)
Eating behavior was assessed using the Korean version of the Dutch Eating Behavior Questionnaire [32] that was originally developed by Van Strien et al. [14]. DEBQ includes the three domains of restrained eating, emotional eating, and external eating. The questionnaire consists of 33 items rated on a 5-point Likert-scale. Cronbach’s alphas for three domains were 0.96, 0.88, and 0.82, respectively.
Food craving (General Food Craving Questionnaire Test, G-FCQ-T)
Food carving was assessed by the General Food Craving Questionnaire [33]. This questionnaire consists of 21 items of self-report measures; ‘general desire for food or to eat’ consisting of the four subscales of pre-occupation with food, loss of control, positive outcome expectancy, and emotional craving. Cronbach’s alpha for the G-FCQ-T was 0.79.
Assessment of diet quality (Diet quality index-international, DQI-I)
Quality of diet was evaluated using the DQI-I [34] , which has four major aspects: variety (overall food group variety and within-group variety for protein source; 0 to 20 points), adequacy (vegetable group, fruit group, grain group, fiber, protein, iron, calcium, and vitamin C; 0 to 40 points), moderation (total fat, saturated fat, cholesterol, sodium, and empty calorie foods; 0 to 30 points), and overall balance (macronutrient ratio and fatty acid ratio; 0 to 10 points). Scores for each component were summarized in the four main categories, and the scores for all four categories were added; this yielded the total DQI-I score, ranging from 0 to 100 (0 being the lowest and 100 being the highest possible score).
Assessment of quality of life (Korean obesity-related quality of life scale, KOQOL)
Quality of life was assessed by the Korean obesity-related quality of life scale (KOQOL) [35]. KOQOL includes 15 items encompassing six domains: psychosocial health, physical health, work duties & housekeeping, daily life, sexual relations, and food relations. Each item was ranked on a 4-point Likert scale, with higher scores indicating a lower quality of life.
Statistical analysis
All statistical analyses were performed using the Statistical Package for the Social Sciences (SPSS) version 21.0. Results are expressed as means and standard deviations for continuous variables and numbers and percentages for discrete variables. To compare means among the three groups, one-way analysis of variance (ANOVA) and Duncan’s multiple range tests were performed. The Chi-square tests (χ2 test) was used to verify the significance of discontinuous frequencies. Pearson's correlation coefficient was used to explore patterns of association among variables. Statistical significance was defined as p < 0.05.
RESULTS
The mean age of the subjects was 34.5 ± 8.09 years. There were no significant differences in general characteristics among the three groups except for education period (period of education in the obese group was significantly shorter than in the other two groups; p < 0.05).
Regarding health-related characteristics (exercise, alcohol, and smoking), approximately 33% of subjects exercised 3–4 times per week (average duration of 57 minutes per session). No significant differences in health-related characteristics were observed among the groups.
Socio-psychological variables
Socio-psychological variables of the subjects are shown in Table 1. Neuroticism received a significantly higher score in the obese group than the other two groups (3.06 ± 0.59); however, agreeableness received a significantly lower score in the obese group than the other two groups (3.38 ± 0.39) (p < 0.05). Active coping had a significantly lower score in the obese group than the normal and overweight groups (2.81 ± 0.66) (p < 0.05). Problem-focused received a significantly lower score in the overweight and obese groups than the normal weight group (2.90 ± 0.66 and 2.82 ± 0.64, respectively, p < 0.05).
Table 1
Socio-psychological variables of the subjects according to the BMI
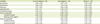
Two categories of coping efforts, including Active (problem focused and seeking social support), and Passive (wishful thinking and emotion focused) Coping Styles.
Neuroticism, tendency to experience negative emotions; Extraversion, quantity and intensity of one’s interpersonal interaction; Openness, proactive seeking and appreciation of new experience; Agreeableness, tendency to have faith in other people and to be eager to help them; Conscientiousness, degree to goal directed behaviors.
*,†Different superscripts in the same row are significantly different at p < 0.05 by Duncan’s multiple range test; ‡Values are mean ± SD.
Eating behaviors
Eating behaviors (EAT-26, DEBQ, and G-FCQ-T) of the subjects according to the BMI are summarized in Table 2. On eating behavior analyses, EAT-26 score of the obese group was significantly higher (22.0 ± 10.89) than other groups (14.5 ± 8.14, 16.7 ± 7.70) (p < 0.05).
Table 2
Eating behavior of the subjects according to the BMI
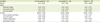
EAT-26, Eating Attitude Test-26 (risk of disordered eating behavior > 20); DEBQ, Dutch Eating Behavior Questionnaire; G-FCQT, General Food Craving Questionnaire Test.
*,†Different superscripts in the same row are significantly different at p < 0.05 by Duncan's multiple range test; ‡Values are mean ± SD.
On the subscale of DEBQ, emotional eating was significantly higher scored in obese group (2.60 ± 0.99) than other groups (2.10 ± 0.76, 2.16 ± 0.79) (p < 0.05). G-FCQ-T, particularly emotional craving subscale was significantly higher scored in obese group (70.9 ± 21.94, 3.18 ± 1.36) (p < 0.05).
Dietary quality of the subjects
Results regarding that dietary quality was evaluated for the groups are shown in Table 3. Overall the score of DQI was significantly lower in obese group (58.6 ± 8.38) (p < 0.05). Energy intake was significantly higher in overweight and obese (1,651.6 ± 328.61 and 1,761.1 ± 656.62 kcal/day) groups than normal weight group (1406.8 ± 294.33) (p < 0.05). Variety (13.8 ± 2.81, 13.9 ± 2.86) and moderation (20.2 ± 3.63, 18.9 ± 5.58) scores were significantly low in overweight and obese groups than normal weight group.
Table 3
Dietary quality of the subjects

Correlations of BMI with socio-psychological factors, eating behaviors, and quality of diet and life
The correlations of BMI with socio-psychological factors, eating behaviors, and quality of diet and life were shown Table 4 and Figure 1. BMI was positively correlated to neuroticism (r = 0.25, p < 0.01), but negatively correlated to the agreeableness (r = -0.28, p < 0.01) and active coping (r = -0.24, p < 0.05). Except the neuroticism, all of the personality traits were positively correlated to active coping (p < 0.05). Whereas, neuroticism was positively correlated to passive coping (r = 0.24, p < 0.01).
Table 4
Correlation coefficients of BMI, socio-psychological factors, eating behavior, and quality of diet and life

BMI, Body Mass Index (kg/m2); N, Neuroticism; A, Agreeableness; AC, Active Coping; PC, Passive Coping; EAT-26, Eating Attitude Test-26 (risk of disordered eating behavior > 20); Emotional, Emotional eating; G-FCQ-T, General Food Craving Questionnaire Test; DQI-I, Dietary quality index international scores are the sum of the four categories used to assess diet quality, 0 (poor diet), 100 (excellent diet); KOQOL, Korean version of obesity-related quality of life scale (higher scores indicating the low quality of life).
*p < 0.05, †p < 0.01, ‡p < 0.001.
Figure 1
Correlations of (A) BMI and Neuroticism, (B) BMI and Emotional eating, (C) BMI and DQI, (D) BMI and KOQOL.
BMI, Body Mass Index (kg/m2); DQI-I, Dietary quality index international scores are the sum of the four categories used to assess diet quality, 0 (poor diet), 100 (excellent diet); KOQOL, Korean version of obesity-related quality of life scale (higher scores indicating the low quality of life).
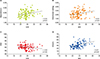
BMI was positively correlated to EAT-26 (r = 0.33, p < 0.001), emotional eating (r = 0.23, p < 0.05), and G-FCQ-T (r = 0.24, p < 0.01). Emotional eating was positively correlated to EAT-26 (r = 0.63., p < 0.001), restraint eating (r = 0.24, p < 0.05), external eating (r = 0.46, p < 0.001), and G-FCQ-T (r = 0.72, p < 0.001) (data is not shown).
Higher BMI was negatively related to quality of diet (r= -0.18, p < 0.05) and positively related to KOQOL (obesity-related quality of life) (r = 0.47, p < 0.001). The Quality of diet was negatively related to KOQOL (r = -0.26, p < 0.05).
Correlations of socio-psychological factors, eating behaviors, and quality of diet and life
Neuroticism was positively related to EAT-26, emotional eating, and G-FCQ-T (r = 0.53, r = 0.48, r = 0.52, p < 0.001). On the other hand, agreeableness negatively related to EAT-26, emotional eating, and G-FCQ-T (r = -0.37, r = -0.28, r = -0.34, p < 0.001). Passive coping was negatively related to EAT-26, emotional eating, and G-FCQ-T (r = 0.27, r = 0.24, r = 0.34, p < 0.001).
Quality of diet was negatively related to KOQOL (obesity related quality of life) (r = 0.26, p < 0.01). KOQOL was positively related with emotional eating (r = 0.44, p < 0.001), and G-FCQ-T (r = 0.56, p < 0.001), however, negatively related to neuroticism (r = -0.45, p < 0.001), and active coping (r = -0.49, p < 0.001) (Table4.).
DISCUSSION
The main objective of the present study was to assess socio-psychology, eating behaviors, quality of diet, and quality of life according to the BMI of adult women. Based on previous findings, we hypothesized that a person who feels more vulnerable to stressful or emotional situations would be likely to eat more food to feel secure or comfortable, which would be reflected in their eating behavior. In the present study, higher neuroticism, lower agreeableness and active coping, some problematic eating behaviors (emotional eating and food craving), low quality of diet, and low quality of life were evaluated in the obese group.
The neuroticism has been known as a negative predictor of obesity, and indicates abnormal psychological aspect. In the present study, obese people experiencing negative emotions such as anxiety, depression, impulsiveness, or vulnerability may use eating to avoid these emotions. These findings are consistent with those of previous studies [1213].
We found that obese women were more likely to display problematic eating behaviors, such as disordered eating, emotional eating, and food craving, than overweight and normal women. Furthermore, obese women met the criteria for an eating disorder risk, indicating that obesity can be considered an eating disorder similar to bulimia, binge eating, and overeating to reduce negative emotions [36]. Researchers have reported that women show a strong tendency to eat for emotional reasons and are more likely to indulge in binge eating than men [21]. The desire to be thin in women is a potent risk factor for abnormal eating and eating disorders. Earlier studies have established that weight-related negative experiences such as weight stigmatization or teasing cause binge eating in individuals with a higher BMI [37]. Consistent with this, a previous study reported that overweight and obese individuals showed a lack of control and inability to resist temptations and food cravings [9].
Personality traits related to neuroticism are negative predictors of behavior dysregulation, while agreeableness is thought to have positive mental health benefits [38]. Our study findings are consistent with those from previous studies, particularly with regard to the effects of neuroticism and agreeableness on an individual’s coping skills and eating behavior.
We found that not only personality traits, but also unhealthy food choices were related to obesity. In the present study, the quality of diet, particularly variety and moderation, was lower in the obese and overweight groups than the normal weight group. According to the criteria of Kim et al. [34] scores below 60 points indicate a poor diet quality. The DQI-I score of the obese group in the present study was 58.6, indicating that highest BMI group had low-quality diets. In a previous study, stressed emotional eaters consumed sweeter, high fat foods than non-stressed emotional eaters [39]. Overconsumption of palatable food may downregulate dopamine receptors, and has shown to be negatively correlated with BMI [40]. Chronic overeating may induce less sensitivity to the dopamine reward system, resulting in overeating of palatable foods so as to enhance dopamine release [41] in response to stress and discomfort. In accordance with previous studies, unhealthy and high fat and energy dense food consumption were shown in high weight status group. Besides, high weight status affected to low diet quality.
Excessive nutrients intake except calcium, was seen in high weight status group. Many studies showed that calcium intake was negatively connected with obesity. In the present study, most of the subjects consumed low amount of calcium due to the omission of the dairy food group.
Quality of life refers to emotional as well as physical well-being. In this study, we used KOQOL [35] to assess psychosocial health, physical health, work duties & housekeeping, daily life, sexual relations, and food relationships of our study participants. In accordance with previous study results [24], obese individuals had a poorer quality of life than non-obese individuals.
The cross-sectional design of our study has some limitations. In addition, subjects were sampled only from the Seoul metropolitan area in Korea; these results might therefore not be generalizable, and should be interpreted with caution. In the current study, no health-related differences were shown between the groups. Thus further longitudinal studies will be examined by assessing over time health status and dietary intakes changes.
Contrary to many studies that relied on self-reported measures of obesity or single indicators, we evaluated the various aspects such as socio-psychology, eating behaviors, quality of diet, and quality of life.
As a conclusion, realistic weight loss and healthy eating behavior are necessary for successful and long-term weight management. Furthermore, it should be recognized that the media’s idealization of how a woman’s body should be looked at can lead to abnormal concern about body image and weight.
CONCLUSION
The present study showed that higher neuroticism, lower agreeableness, problematic eating behaviors, low quality of diet, and low quality of life were correlated with body weight status. Realistic weight loss and healthy eating behavior are necessary for successful and long-term weight management. Furthermore, active coping with positive life style may contribute to controlling a healthy weight and mind.
 XML Download