

 PDF
PDF ePub
ePub Citation
 Print
Print


Introduction
According to epidemiological studies in the healthcare setting, the prevalence of malnutrition in hospitalized patients ranges from 20% to 50%, with a wide range of etiological and clinical presentations, including prolonged fasting, anorexia, malabsorption, increased immune response, infection, and stress-mediated excessive metabolism [1,2,3,4]. Recent empirical studies have emphasized the importance of malnutrition management in hospitalized patients, because malnutrition contributes to an increased length of hospital stay and healthcare costs as well as morbidity and mortality, thus substantially lower the quality of life [2,3,4,5,6].
In particular, intensive care unit (ICU) patients experience day-to-day fluctuations in metabolic rates and, as a result, require more intense nutritional support compared with other inpatients. The prevalence of malnutrition among ICU patients is higher (40-80%) due to prolonged fasting associated with surgery or examination as well as lack of proper nutritional support and appropriate attention from medical staff [2,7,8]. Moreover, the lack of a continuous energy supply and high risk of malnutrition in ICU patients are directly related to increased morbidity due to infection and complications, which in turn prolongs the length of their hospital stay and increases healthcare costs, in addition to increasing the risk of death. Therefore, malnutrition management is vital importance in ICU patients [2,7,8].
The Korean Institute for Healthcare Accreditation and the Joint Commission International (JCI) specifies that an initial nutrition assessment should be conducted within 24 hours of hospitalization, to detect and treat patients who are malnourished [9,10]. Representative nutrition screening tools that are currently in use for inpatients include the Patient Generated-Subjective Global Assessment (PG-SGA), Nutritional Risk Screening-2002 (NRS-2002), and the Mini Nutritional Assessment (MNA). However, as these tools were developed using data on other populations and require skilled surveyors and assessment through individual interviews with patients, it is difficult to apply these tools in healthcare settings of Korea [11,12,13]. Therefore, Korean nutrition screening tools have been developed by individual institutions, while considering the characteristics and conditions of each hospital. A number of studies, including those conducted by Lee et al. [14], Kim et al. [15], Lim [16], Cho [17], and Yun [18], have developed nutrition screening tools based on objective indicators, such as ideal weight, body mass index (BMI), blood test results such as serum albumin level, disease diagnosis, and age, as well as subjective indicators, such as dietary problems and status of nutritional intake; their validity and reliability have been assessed by comparing them with the established screening tools (e.g., PG-SGA and NRS-2002). These nutrition screening tools have been used in individual institutions as clinical guidelines for nutritional management of patients in various settings. Our hospital recently developed the Catholic Medical Center Nutritional Risk Screening (CMCNRS) tool on the basis of objective information, including BMI, age, and dietary instructions, and subjective information, including change in body weight, appetite status, digestive and defecation disorders, and activity level, using the nursing records. This tool is currently being used in our hospital and five affiliated hospitals. To test the validity of CMCNRS, we compared it with two validated screening tools (PG-SGA and NRS 2002) in the patients in our hospital. The results confirmed that the CMCNRS was a reliable nutrition screening tool when compared with PG-SGA and NRS 2002, although its sensitivity was relatively low, compared with the specificity of the two other tools. As presented in a previous publication [19], this was attributed to the high proportion of subjective indicators in the CMCNRS tool.
Currently, there is no known nutrition screening tool tailored to the needs of ICU patients. The European Society for Clinical Nutrition and Metabolism (ESPEN) and the American Society for Parenteral and Enteral Nutrition (ASPEN) recommend that nutritional screening should be performed using conventional nutrition screening tools, such as the NRS-2002, MNA, and SGA. The condition in South Korea is assumed to be similar, although a report providing evidence to support this has yet to be published [20,21].
Considering these findings, the present study intended to establish basic data for indicators to be used in future nutritional risk screening in ICU patients. This study examined the differences between the nutritional screening based on the nursing records, as currently applied in our hospital, and the CMCNRS conducted by clinical dietitians. The comparison was made by applying both methods to the same ICU patients in our hospital.
Materials and Methods
Subjects and study period
Of the ICU patients hospitalized between June 2, 2013 and August 6, 2013, ninety-one patients (aged ≥ 18 years) were included in this study. Pediatric and adolescent patients were excluded because different nutrition screening tools would be needed for these patients. This study was performed with the approval of the institutional review board of Yeouido Saint Mary's Catholic Medical Center (SCMC IRB, Project Number SC13QISI0020).
Patient data
For each patient, the nutrition screening results based on the nursing records (currently used in our hospital) were compared with the results of CMCNRS that was directly conducted by clinical dietitians. The nursing records that were recorded by nurses were electronically processed in accordance with the nutritional risk screening standard. Clinical dietitians used the CMCNRS for nutrition screening based on the information obtained from electronic medical records and individual interviews with the patients.
We used patients' electronic medical records to obtain relevant clinical information, including disease diagnosis, age, BMI, serum albumin level, total lymphocyte counts, hemoglobin level, hematocrit level, and diet prescription.
CMCNRS
The CMCNRS is a tool that targets hospitalized patients and should be performed within 24 hours of hospitalization. The study results and indicators of Reilly et al. [22] and Corish et al. [23] were used to set the nutritional risk screening criteria for CMCNRS. The 8 indicators of CMCNRS consist of 3 objective indicators (BMI, diet prescription, age) and 5 subjective indicators (weight change, appetite status, digestive system disorders, defecation disorders, activity level); each is graded on a scale of 0-3 points. The scores for each indicator were added, and patients were grouped according to their total score into low risk (0-1 points), moderate risk (2-3), and high risk (≥ 4) groups.
With regard to the scoring of weight change, only weight loss in the previous 3 months was considered; 0, 1, 2, or 3 points was assigned to no weight loss or weight loss of < 3 kg, 3-6 kg, or > 6 kg, respectively. A BMI of 18-19 kg/m2 was scored as 1 point, 15-17 kg/m2 was scored as 2 points, and < 15 kg/m2 was scored as 3 points. Appetite status was scored from 0 to 3, depending on the dietary intake. For digestive system disorders (nausea, dysphagia, vomiting, abdominal distension, dyspepsia, and abdominal pain) and defecation disorders (diarrhea, constipation, and bloody stool), points were assigned to each disorder, and the highest point in each category (digestive system disorders, defecation disorders) was used. For the activity level indicator, 1 point was assigned when complete support was needed. For the patient diet indicator, 1 point was assigned for therapeutic, enteral, or parenteral nutrition. The model was developed based on a 70-year-old patient.
Statistical analysis
Using PASW Statistics version 18.0 (IBM Corp., Armonk, NY, USA) for data analysis, we performed reliability analysis, including specificity and sensitivity; frequency analysis; and analysis to derive the descriptive statistics such as mean and standard deviation. To evaluate the homogeneity and concordance of the results, t-tests, chi-square tests, and kappa tests were used. For the purpose of statistical analysis, the low and moderate nutritional risk groups were classified together as the malnutrition notification group, while the high risk group was classified as the malnutrition management group.
Kappa values range from 0 to 1 where < 0.2 indicates slight agreement; 0.2-0.4 indicates fair agreement; 0.4-0.6 indicates moderate agreement; 0.6-0.8 indicates substantial agreement; and > 0.8 indicates almost perfect agreement [24]. Sensitivity was defined as the ratio of the number of patients classified into the malnutrition management group by the nursing records to the number classified into the same group by the clinical dietitians. Specificity was defined as the ratio of the number of patients classified into the malnutrition notification group by the nursing records to the number classified into the same group by the clinical dietitians.
Results
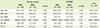
The general characteristics of the subjects are listed in Table 1. The mean age was 64.0 ± 17.5 years, and the mean age of the malnutrition management group was significantly higher than that of the malnutrition notification group, as defined by both the nursing records and the clinical dietitians (both p < 0.001). The BMI of the malnutrition management group was lower than that of the malnutrition notification group, according to the risk screening performed by the clinical dietitians (p < 0.01). The albumin value of the malnutrition management group was also lower than that of the malnutrition notification group, according to the risk screening performed by the clinical dietitians (p < 0.001). Total lymphocyte counts, hemoglobin levels, and hematocrit levels were not significantly different between the two groups.
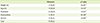
Table 2 shows the diet prescription statuses according to the nutrition screening results from the CMCNRS. Fasting patients were most common, accounting for 57.1%, followed by those on a therapeutic diet (23.1%), general diet (11.0%), and enteral nutrition (8.8%). A significant difference was shown in the nutritional risk screened by the clinical dietitians; the therapeutic diet was more common in the malnutrition notification group, and the enteral nutrition was most common in the malnutrition management group (both p < 0.05).
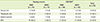
Table 3 lists the results of nutritional risk using the CMCNRS according to the disease. Cancer and digestive system disease were more prevalent in the malnutrition management group compared with the malnutrition notification group, according to the nutritional information (p < 0.01). For nutrition screening by clinical dietitians, the prevalence of cancer, respiratory diseases, digestive system diseases, and general surgery was higher in the malnutrition management group (p < 0.05).
A comparison of the nutrition screening classification results from the nursing records and those from CMCNRS is presented in Table 4. All 17 high-risk patients according to the nursing records were also classified into the high-risk group by the CMCNR. Of the 22 patients classified into the moderate-risk group by the nursing records, the clinical dietitians classified 13 as high risk and 9 as moderate risk. Of the 52 patients classified into the low risk group by the nursing records, the clinical dietitians classified 12 into the high-risk group, 11 into the moderate risk group, and 29 into the low risk group. A significant difference was detected when the 2 nutrition screening methods were compared (p < 0.001).
Table 5 lists the results of the comparison of the nursing records method and the screening method used by the clinical dietitians. The sensitivity of correctly classifying malnutrition management patients (high-risk group) into the malnutrition management group was 40.5%, and the specificity of classifying the malnutrition notification (low and moderate risk groups) patients into the malnutrition notification group was 100%. The two nutrition screening methods had a kappa indicator score of 0.423, which indicates moderate agreement (p < 0.001). Therefore, although the existing nursing records method was similar to the screening method used by the clinical dietitians, its sensitivity was slightly lower than its specificity.
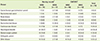
To analyze the differences between the 2 screening methods, the discordant items from the screening by the clinical dietitians were compared to those from the nursing records (Table 6). The results included subjective indicators from the CMCNRS, including weight change, appetite status, digestive system disorders, defecation disorders, and activity level. All subjective indicators showed significantly different results (p < 0.001), and the discordant ratio was 25.3% for digestive system disorders, 20.9% for appetite status, 14.8% for weight loss, 13.2% for activity level, and 12.2% for defecation disorders.
Discussion
This study aimed to identify the differences between the 2 nutrition screening tools after comparing the results from nutritional risk screening of ICU patients. We also sought to provide basic data for the selection of indicators for a nutrition evaluation tool designed for ICU patients.
Our results indicate that, although the age of the malnutrition management group (high-risk group) was higher, the BMI and the albumin level of that group were lower than the malnutrition notification group (low and moderate risk groups). A similar trend has been reported in other studies that examined various domestic nutrition screening tools [14,15,16,17,18,25,26]. Therefore, it is possible that age, BMI, and albumin levels can be used as nutritional risk screening indicators for ICU patients.
The analysis of the disease distribution in the malnutrition management group indicated that cancer, respiratory diseases, and digestive system diseases were the most common diseases. In previous studies, Kim et al. [26] and Lee et al. [14] reported that the malnutrition rate was highest among cancer patients (30.3% and 16.9%, respectively), while Kang [25] reported that the malnutrition rate was much higher in digestive system diseases (45.4%) and respiratory diseases (42.4%). Based on these results, nutrition screening was conducted by applying the malnutrition decision values according to the characteristics of clinical diseases. After this modification, a high sensitivity (> 80%) was reported in comparison to the existing nutrition screening method. Considering this information, it may be necessary to reflect the disease-specific characteristics in the development or revision of nutrition screening tools.
The CMCNRS determines the patient's nutritional status after evaluating the nursing records data as well as information regarding the patient's BMI, weight loss, age, diet prescription, and gastrointestinal and defecation issues, which all affect malnutrition. Therefore, the lack of a precise standard for the information or data input as well as insufficient understanding and skills of the surveyor can affect the nutritional risk screening results. In the present study, the ratio of high-risk patients according to the nursing records was lower than that calculated by the clinical dietitians, implying that patient classification can vary according to the method used. There were significant differences between the results obtained from the nursing records and the CMCNRS results for all indicators that required a subjective decision. Therefore, it is necessary to discuss various methods for improvement, such as improving the training of surveyors and complementing the data collection methods used in the electronic medical records.
Furthermore, the studies by Yun [18] and Cho [17] demonstrated that the sensitivity of various nutrition screening tools was > 60%. The sensitivity of 40.5% in the present study is noticeably lower than these previous results. This difference may be explained by the fact that subjective indicators account for 63% of the total nutrition assessment indicators in the CMCNRS tool, while they account for < 30% in the tools studied by Yun [18] and Cho [17]. Therefore, when developing nutrition screening tools for ICU patients, it is essential that the variables that independently affect malnutrition should be statistically verified before they are applied.
In the results of nutritional risk screening by CMCNRS, highrisk malnutrition patients accounted for 46.2% of all ICU patients. Although this is similar to the malnutrition rate (56.6%) among ICU patients in a study by Kang [25], it is higher than the 20% reported by Lee et al. [7]. Furthermore, the proportion of patients in the high-risk malnutrition group (46.2%), as assessed by the clinical dietitians in this study, is approximately 2.5-fold higher than that (18.3%) obtained by a clinical dietitian in a previous study with general patients [19], which indicates that a more intensive nutritional intervention is required for ICU patients compared with that for general inpatients.
Conclusion
The results of nutritional risk screening varied depending on the screening method. The sensitivity of the nursing records tended to be lower than that of CMCNRS. This difference was related to input errors of the subjective indicators; therefore, the interdisciplinary diagnosis systems should be strengthened to improve the accuracy of the subjective indicators. In addition, we believe that it is necessary to develop disease-dependent nutritional risk screening tools tailored to the needs of ICU patients.


 XML Download