

 PDF
PDF ePub
ePub Citation
 Print
Print


Introduction
Gestational diabetes mellitus (GDM) is a common complication of pregnancy defined as a state of glucose intolerance developed during pregnancy [1]. The incidence of diabetes is increasing rapidly worldwide, and GDM develops in approximately 3-8% of all pregnancies in the United States and 4% in Korea [23]. GDM is associated with adverse maternal and neonatal outcomes [4]. For example, about 35-60% of women with GDM develop type 2 diabetes in the subsequent 10-20 years, and children of women with GDM are more likely to be obese and to develop diabetes in adulthood [56]. The maintenance of maternal nutritional requirements during pregnancy is essential for appropriate fetal development and maternal health.
Numerous studies have suggested that the risk of developing type 2 diabetes is associated with the consumption of certain single foods [78]. Although analyses of single foods and nutrients may be quite valuable, the effects of individual dietary components on the risk of chronic disease are difficult to understand when they are studied separately, as diets are composed of various nutrients and interactions among nutrients and foods are complex. Dietary patterns analysis simplifies the understanding of individuals' nutrient intake or food consumption through classification into one of several dietary groups, and has been identified as a valuable approach to understanding entire diets that provides more detailed information about the associations of nutrition with chronic diseases [910]. Food and dietary factors have been reported to affect glucose homeostasis, and diet may be associated with GDM risk factors. Several studies have found that GDM is associated with unhealthy dietary patterns [311]. The consumption of a "Western" diet characterized by high intakes of red and processed meats, sweets, and fat, prior to pregnancy has been associated with a significantly elevated GDM risk [3]. Low-quality diets with poor nutrient intake have been associated with high glycemic load [11], and suboptimal nutrient intake has been documented in women with GDM in the United Kingdom and Spain [1213]. Thus, the maintenance of a healthy and balanced diet combined with physical activity before and during pregnancy is important.
Several overall dietary measures have been developed, including the Diet Quality Index (DQI), the Healthy Eating Index (HEI), and Mediterranean Diet Score [14]. The recently developed DQI-International (DQI-I) is a composite measure of diet quality that focuses on undernutrition and chronic diseases [15]. The total DQI-I score can capture the healthfulness of a given diet. As cultural dietary patterns vary among countries, the combined analysis of dietary patterns and diet quality may be important to understand the etiology of GDM and provide guidance for appropriate nutrition intake.
Although numerous studies have reported associations between different dietary patterns and the risk of type 2 diabetes [1617], limited attention has been given to the evaluation of dietary patterns and diet quality among women with GDM. The aims of this study were to examine nutritional intake and to investigate associations among dietary patterns, intakes, GDM-related blood markers, and diet quality using the DQI-I in Korean women with GDM.
Materials and Methods
Study population and GDM diagnosis
Study participants were pregnant women diagnosed with GDM at a general hospital clinic in Seoul, South Korea between October 2008 and May 2012. A total of 578 eligible participants were surveyed. After the exclusion of women who declined study participation (n = 412), we excluded women who had been diagnosed diabetes previously, and/or those with missing food consumption data, leaving a final analytic sample of 166 patients with GDM. The study protocol received the Cheil General Hospital Institutional Review Board approval (IRB no. CGH-IRB-2006-22) and all participants provided written informed consent.
GDM was diagnosed using the two-step screening and diagnostic test of Carpenter & Coustan test as described previously [18]. Briefly, initial screening was performed by measuring the plasma glucose concentrations of all subjects 1-h after a 50-g oral glucose tolerance test (OGTT) at 24-28 weeks of gestation. Plasma glucose values ≥ 140 mg/dL were considered to be abnormal and prompted additional diagnostic testing with a 100-g OGTT. GDM diagnoses were based on the OGTT criteria of the American Diabetes Association (ADA) [19], two abnormal plasma glucose values among the following: fasting value ≥ 95 mg/dL, 1-h value ≥ 180 mg/dL, 2-h value ≥ 155 mg/dL, and 3-h value ≥ 140 mg/dL.
Determining of general and clinical characteristics
Trained research nurses collected data on participants' general characteristics, including age, pre-pregnancy body weight, education, income, physical activity level, smoking status, and dietary supplement use via face-to-face interviews. Participants' height (cm) and body weight gain (kg) during pregnancy were measured on the day of diagnostic testing. Clinical nurses collected blood samples, and fasting blood glucose, and glycated hemoglobin (HbA1c) concentrations, OGTT results, and systolic blood pressure (SBP) and diastolic blood pressure (DBP) were measured.
Dietary assessment
Certified clinical dietitians collected dietary intake data using a 3-day (two week days, one weekend day) food record. To ensure that participants accurately reported dietary intakes, trained dietitians instructed them using food models and photographs during their first diabetes clinic visit. The Computer Aided Nutritional Analysis Program (CAN-Pro, version 3.0; Korean Nutrition Society, Seoul, Korea) was used to analyze participants' nutrient intake.
Dietary pattern analysis
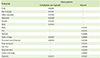
For dietary pattern analysis, the total numbers of 334 food items included in the present study were categorized into 17 common food groups based on a Korean nutrient database to reduce the complexity of the data (Table 1). A statistical data reduction technique was used to explain variability among observed random variables with aggregated unobserved random variables called a factor [20]. Factor analysis was used to identify dietary patterns, with the factors rotated by orthogonal transformation. Factor weights in conjunction with an eigen value > 1.7 were used to determine whether factors were retained. This approach served to limit the number of factors and to identify the two most meaningful factors. Factors were interpreted as dietary patterns and named after food groups with loadings ≥ ± 0.20. The derived patterns were named according to the foods that loaded most positively on the factors and the correlation of factors with nutrients. Factor scores were categorized in tertiles according to the distribution of participants with each pattern.
Assessment of diet quality
The DQI-I was used to measure overall diet quality [15]. DQI-I was modified in the present study, since DQI-I was developed for a comparative study between Chinese and American subjects. The modification was based on the dietary guideline for Koreans published by the Korean Nutrition Society [21], the dietary guideline recommended by Korean Society of Lipidology and Atherosclerosis, and previous researches [222324]. The DQI-I was composed of four major categories: variety (overall and protein sources; 0-20 points), adequacy (food/nutrient intake required to prevent undernutrition; 0-40 points), moderation (food/nutrient intake quality relative to that associated with chronic disease; 0-30 points), and overall balance (macronutrient ratio and fatty acid composition; 0-10 points). Scores for each component were summarized in each of the four main categories, and the scores for all four categories were summed, resulting in the total DQI score (0-100 points; 0 being the poorest and 100 being the highest possible score). A higher score indicates a better diet quality.
Statistical analysis
All statistical analyses were conducted using SAS software (version 9.3; SAS Institute, Cary, NC, USA), with the PROC FACTOR procedure used for factor analysis and orthogonal rotation. To determine the number of factors to retain, we considered components with an eigen value greater than 17 and the scree plot results. Factor names reflected the food groups having more than ± 2.0 loadings of that factor. Mean levels of continuous variables and associations between dietary patterns and other variables were estimated using a generalized linear regression model. According to factor scores by dietary patterns, the subjects were divided into tertile. Age and energy intake were adjusted for statistical analysis. To characterize nutrient intakes according to dietary pattern, the association between nutrient intake per 1,000 kcal energy and dietary pattern scores was analyzed using linear regression. Nutrition intake per day depending on factors scores by dietary patterns was analyzed using linear regression model. The chi-squared test was used to compare proportions of categorical variables between groups. Student's t-test was used to compare DQI-I scores between dietary patterns and between poor and good adherence to the DQI-I. A p value of < 0.05 was considered to be statistically significant.
Results
Table 1 shows the two main dietary patterns and the factor-loading matrix used for their identification. The first pattern, named the "carbohydrate and vegetable pattern" was characterized by greater intakes of fruits, rice and cereals, fermented vegetables, vegetables, and meat. The second pattern, named the "western pattern", was characterized by high consumption of poultry and eggs, fast food, deep-fried food, processed meat and seafood, snacks and desserts, coffee and other beverages, and seaweeds. The western pattern was negatively loaded with beans, fish, and seafoods.
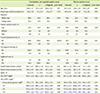
Participants' demographic characteristics and biochemical markers are presented as means (± standard deviation) or numbers and percentages, stratified by tertiles of factor scores for each dietary pattern in Table 2. Higher scores for pattern were significantly associated with younger age for each dietary pattern. Participants with higher carbohydrate and vegetable pattern scores were more likely to report less physical activity (p = 0.0013) and higher DBP (p = 0.05) than were those with lower scores for this pattern. No other general characteristics differed according to pattern scores.
Table 3 shows nutrient intake by dietary pattern based on tertile distribution of DQI-I scores. Higher energy intake was associated with higher scores for both dietary patterns (p < 0.0001). When nutrition intake of GDM patients and 2010 Dietary Reference Intake for Koreans (KDRIs) were compared, the carbohydrate intake of women with GDM was approximately 55-58% and fat intake was accounted for 25-29% of total calories (data not shown). After adjusting for age and energy intake, higher carbohydrate and vegetable pattern scores were associated with higher intakes of sodium, potassium, carotene, and vitamin B1, and lower intakes of fat, calcium, phosphoru s, vitamin A, and folate. Higher western pattern scores were associated with higher intakes of fat and cholesterol and lower intakes of phosphorus, sodium, potassium, vitamin A, carotene, vitamin B6, vitamin C, and folate.
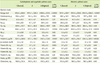
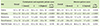
Total DQI-I scores were 61.7 for the carbohydrate and vegetable pattern and 59.1 for the western pattern (Table 4). The differences in total DQI-I and category scores between dietary pattern groups were not statistically different, with the exception of the variety category scores, which was higher for the carbohydrate and vegetable pattern than for the western pattern (p < 0.01). For both dietary patterns, adequacy scores were highest, followed by variety and moderation scores. When DQI-I scores were stratified according to tertile distribution of dietary pattern scores, subjects with higher dietary pattern scores had higher variety and adequacy scores and lower moderation scores (all p for trend < 0.0001; Table 4). Total DQI-I score did not differ significantly according to tertile distribution of carbohydrate and vegetable pattern scores, but the score was lower among participants with a higher western pattern score (p for trend = 0.0154). We divided subjects into low DQI-I (below 50% of total DQI-I score) groups, and high DQI-I (above 50% of total DQI-I score) groups and compared major biochemical markers related to GDM (Table 5). Plasma fasting glucose levels and HbA1c concentrations were significantly lower in the high DQI-I group than those in the low DQI-I group (p < 0.05). OGTT results did not differ according to DQI-I score.
Discussion
Dietary modification is an important GDM management strategy. In this study, we identified two major dietary patterns in Korean women with GDM. The present study found that many Korean women with GDM do not consume nutritionally adequate diet regardless of their dietary pattern. Subjects with higher carbohydrate and vegetable pattern scores showed less physical activity and have higher DBP levels, higher sodium intakes, but lower intakes of fat and other micronutrients. On the other hand, subjects with higher western pattern scores reported higher fat intake, lower intakes of sodium and other micronutirents. And higher scores for both dietary patterns were associated with lower scores in the moderation category of DQI-I. Fasting plasma glucose levels and HbA1c were associated with DQI-I scores.
Vegetable and fruit consumption has been reported to increase high density lipoprotein cholesterol levels in blood and to reduce the prevalence of type 2 diabetes mellitus [2526]. However, in the present study, DBP was higher among participants with higher carbohydrate and vegetable pattern scores and SBP was higher among women with western pattern scores. Although the traditional Korean dietary pattern is associated with high vegetable intake, most Koreans consumed fermented vegetables such as "kimchi" instead of fresh vegetables, as do people in Western countries [27]. Most Korean people consume kimchi at every meal, and this food is a major source of sodium intake among Koreans. Higher sodium intake is associated with obesity [28]. In the present study, sodium intake was higher among participants with higher carbohydrate and vegetable pattern scores and lower among those with higher western pattern scores, providing a supportive evidence for a high intake of salted vegetables in Korea. In a previous study, average daily sodium intake was significantly higher among participants with GDM than among those with normal glucose concentrations (5081.5 ± 1632.7 vs. 4132.8 ± 1232.6 mg) [29].
In the present study, fat intake was significantly higher among participants with high western dietary pattern scores than among those with high carbohydrate and vegetables pattern scores. We observed strong associations between western dietary patterns and GDM risk. The association with the western pattern is largely explained by intakes of red and processed meat products, which have been significantly and positively associated with GDM risk independently of known risk factors for type 2 diabetes and GDM, including body mass index (BMI), physical activity and consumption of other components of the western pattern diet (i.e. refined grain products, snacks, sweets and desserts, French fries, and pizza) [9]. Moreover, in a study of 41 patients with GDM and 294 control subjects without GDM, each 50 mg/1000 kcal increase in dietary cholesterol during the previous year was associated with an 88% increased risk of GDM (relative risk, 1.88; 95% confidence interval, 1.09 - 3.23) after adjustment for dietary and nondietary covariates [18].
The majority of women with GDM do not meet the recommended intake levels of most micronutrients and consume an undesirable ratio of macronutrients, with high carbohydrate intake [30]. The management of carbohydrate intake in women with GDM is important for blood glucose homeostasis [31]. Several studies have found that caloric intake from carbohydrate comprised 30-60% of total energy intake in women with GDM [32], whereas the ADA has recommended carbohydrate intakes comprising 35-40% of total calories for this population [33]. In the present study, carbohydrate intake levels were about 55-58% of total calories among women with GDM (Table 3). Maternal high blood glucose stimulates fetal insulin secretion, which acts like fetal growth factor to increase the risk of fetal macrosomia and central nervous, and musculoskeletal system disorders [3435]. The risk of macrosomia can be reduced by low carbohydrate intake with caloric control [36]. In the present study, most carbohydrate-rich foods consumed by participants with the carbohydrate and vegetable pattern were rice and noodles. A dietary pattern based on rice was positively associated with the risk of overall obesity among elderly Hispanic individuals [37], and obesity is the major recognized risk factor for GDM [38]. Thus, high carbohydrate intake based on rice and noodle consumption may contribute to GDM development in Korean women. Park et al. [29] reported that women with GDM consumed more nighttime snacks with high carbohydrate and fat contents than did control subjects with normal glucose tolerance.
Fat intake in the present study comprised about 25-29% of total calories (Table 3), which exceeds the dietary reference intake recommended 15=25% by the Korean Nutrition Society [39]. A previous study found that Korean women with GDM ate more nighttime snacks and preferred greasy food compared with subjects with normal glucose tolerance [29], and that energy and fat intakes were significantly higher in the GDM than in the control group. Excessive nighttime snacking and high calorie consumption can be risk factors for obesity and gastrointestinal disorders [40]. Moreover, fat intake has been positively correlated with blood fasting glucose concentration [29]. Taken together, these considerations and the findings of the present study suggest that a dietary pattern characterized by extensive consumption of white rice, salted vegetables, and fat is not advisable and that the consumption of a variety of foods is preferable.
Diet quality indices may be useful tools for the rapid assessment of compliance with healthy dietary guidelines and monitoring of the outcomes of dietary education. In particular, the DQI-I can be a useful global tool to monitor diet healthfulness and explore aspects of diet quality related to nutrition transition. Although DQI-I's variety and adequacy scores increased with scores for both dietary patterns, moderation scores decreased in the present study. Moderation was evaluated by the amount of the intake of food and nutrients that are related to chronic disease, and the moderation score was calculated based on the proportion of fatty acid intake and the ratio of carbohydrate, protein and fat intake. Thus, poorer dietary intake may be associated with GDM development in the study participants. In the present study, DQI-I scores were negatively associated with fasting plasma glucose and HbA1c levels of women with GDM. Previously, it has been reported that DQI-I, Alternate Healthy Eating Index (AHEI), and Healthy Diet Indicator (HDI) scores had a significantly negative correlation with fasting plasma glucose (FPG) and 2-hour postprandial glucose (PP2). When age, BMI, and energy intake were adjusted for, the DQI-I and HDI scores had a significantly negative correlation with HbA1c. All 3 diet quality indices had a significantly negative correlation with FPG and PP2. Kim et al. [41] reported significantly negative correlations between DQI-I score and HbA1c (r = -0.21, p < 0.05), FBG (r = - 0.21, p < 0.05), and 2-h postprandial glucose (r = -0.33, p < 0.05) concentrations. These findings indicate that imbalanced poor-quality diet is associated not only with the risk of GDM, but also with the severity of the disease. Total DQI-I scores have been associated with glycemic indices [41], and multiple food groups defined using four-principle component analysis of dietary pattern scores were associated with the risk of type 2 diabetes, but individual food groups were not [42]. These findings may suggest that dietary pattern analysis is a better approach to the assessment of diet quality than the examination of single-nutrients or food groups.
In a prospective cohort study of pregnancy, replacement of a percentage of total calories from carbohydrates with animal fat was associated with a significantly increased risk of GDM, whereas the replacement of energy from animal fat with vegetable fat reduced the risk of GDM [43]. However, in the present study, the quality of both carbohydrate and vegetable pattern and western dietary pattern was undesirable, indicating that the types of carbohydrate consumed, including complex carbohydrates and fiber, may be an important factor for the risk of GDM.
This study has several limitations. First, the cross-sectional design prevented the establishment of causal relationships between dietary patterns and GDM. Second, the examination of diet during pregnancy likely does not reflect women's usual diet prior to pregnancy, which are typically characterized by lower dietary quality and quantity [30]. Third, nutrient intake through dietary supplement consumption was not considered. Most pregnant women take dietary supplements containing iron and folic acid, and these intakes should be considered in future studies. In addition, the present study investigated the gestational diabetes patients only. Despite the limitation, the research has its value due to the fact that the effect of the overall dietary pattern and the food quality on gestational diabetes was examined. It covered further than the effect of a single nutrient or food on gestational diabetes.
In conclusion, the present study found that Korean women with GDM do not consume nutritionally adequate or balanced diets regardless of whether they follow "carbohydrate and vegetable" and "western" dietary pattern. Clinicians should encourage healthy and adequate nutrient intakes corresponding to reference values for pregnant women in women with GDM to prevent maternal and fetal complications and post-gestational chronic diseases.
 XML Download