Journal List > Clin Nutr Res > v.4(3) > 1059800

Park, Lee, and Kim: Eating Habits and Food Preferences of Elementary School Students in Urban and Suburban Areas of Daejeon

Abstract

This study investigated the dietary habits and food preferences of elementary school students. The survey was conducted by means of a questionnaire distributed to 4th and 5th grade elementary school students (400 boys and 400 girls) in urban and suburban areas of Daejeon. The results of this study were as follows: male students in urban areas ate breakfast, unbalanced diets, and dairy products more frequently than male students in suburban areas (p < 0.05). Female students in urban areas ate dairy products (p < 0.01) and fruits (p < 0.001) more frequently than female students in suburban areas. Students had the high preferences for boiled rice and noodles with black bean sauce, beef rib soup, steamed beef rib, steamed egg, beef boiled in soy sauce, egg roll, bulgogi, pork cutlet, deep-fried pork covered with sweet and sour starchy sauce, and honeyed juice mixed with fruit as a punch. All students preferred kimchi, although students in the suburban areas preferred kimchi-fried rice (p < 0.05), and those in the urban areas preferred bean-paste soup (p < 0.01). Students in suburban areas showed a greater preference for seasoned bean sprouts and Altari kimchi. All of the students preferred fruits, rice cake made with glutinous rice, and pizza among other foods. Overall, there were distinct differences in the eating habits and food preferences of elementary school students according to the place of residence.

Introduction

In Korea, the school food service was developed in the 1950s to help feed the children at the time of the Korean War, and was enforced by a school feeding law in 1981. This school food service was expanded to the whole country in the 1990s and was fully implemented in all elementary, middle, and high schools nationwide in Korea by 2009 [1]. The purpose of the school food service is to maintain and improve students' health through nutritious meals and to help students establish good dietary habits for a throughout the lifetime [2]. Good eating habits are essential for the physical and emotional development of school age children.
Generally, the eating habits of the people are established from the babyhood and are affected by several factors including sociodemographic [3], physical and psychological conditions of the person [4], economics, culture, religion, the education level of parents, and mass media [5]. These factors may be different between the urban and suburban areas of each city and province. Gender and age also affect eating habits and food preferences. According to Hodkinson's report [6], the men grow up in a distinctly different way to women, with consequent differing values, ways of looking at life, interest in diet, and knowledge of nutrition. Already-formed eating habits are ingrained and difficult to change, even through the education [7]. Because eating habits are difficult to correct, the students should have, through nutrition education at home and school, well-established and healthy eating habits from the childhood.
Food preference plays a very important role in the formation of undesired eating habits for students [8]. Baxter et al. [9] reported that people took approximately 0.92 times the serving volume for food that they liked, 0.54 times the serving volume for food that they liked nor disliked to, and 0.11 times the serving volume for food they disliked. Thus, the food preference has a quantitative relationship to the amount of food intake, and may greatly affect on nutrient intake [10]. Additionally, Fetzer et al. [11] reported that food preference is one of the main factors affecting the intake of important nutrients, as well as the selection of foods, and is dependent on colors, shapes, tastes, and textures of the food.
For this reason, the serving of school foods without consideration of students' preferences may be a cause of the poor intake of nutrients. Cooking foods that the students prefer may encourage a more consumption of school meal. Also, offering a regular nutrition education and nutritionally balanced meal through the school meal program can help students to obtain a proper knowledge and desire to choose right foods for their health. Due to the difference in eating habits of the various regions, the nutritional problems of a certain community should be primarily identified in order to implement the effective nutrition management of the community.
The aim of this study was to investigate eating habits and food preferences of elementary school students in urban and suburban areas of Daejeon in order to recognize regional differences in eating habits and food preferences. This result may be used for preliminary information in the field of nutrition education, which seeks to improve the health and eating habits of students.

Materials and Methods

Subjects

The study subjects of this study were a group of fourth/fifth grade boys and girls (total of 800 students) in five elementary schools that implement the school meal service in urban and suburban area of Daejeon. The questionnaire was filled out personally by students under the supervision of a teacher in June 2011. All 800 questionnaires were returned and analyzed statistically.

Contents of investigation and methods

General information of the subject's family and eating habits/food preference was investigated in the study. Questionnaires for general information of the family included the mother's age and educational level, father's occupation, a double-income status, monthly income, and a type of family composition including grandparents' co-residence. Questionnaires for eating habits according to the regions included frequency of eating with family, frequency of unbalanced diet, preference of foods, the eating frequency of snacks before a regular meal, the interest in vegetables, intake of fruit, and eating behavior after the school meal service.
Preference of foods was investigated according to the gender and school grades in urban and suburban areas of Daejeon. The preferred target foods were rice/noodles (18 items), soups (16 items), steamed/hard boiled dishes (12 items), roasted foods/pan-fried dishes (12 items), pan-broiled/fried dishes (18 items), seasoned vegetables/salads (15 items), Kimchi (8 items), fruits (8 items), and other side dishes (8 items) among representative Korean foods [1213]. Responses of preference against each food were evaluated using a three-point scale: 'liked', 'normal', and 'disliked'. Survey errors, due to the use of various target foods and cooking recipes of many schools, were minimized by classification of cooking recipes using main food ingredient.

Statistical analysis

Survey data were analyzed statistically using the SPSS package program (version 11.0, IBM Inc., Armonk, New York, USA). General information about subjects was evaluated by using frequency analysis. Differences in eating habits and food preference according to the regions were compared using the t-test for continuous variables and cross correlation analysis for non-continuous variables, and were then verified using chi-squared analysis. Statistical significance was considered to be p < 0.05.

Results

General information of subjects

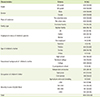
Students participating in this survey were 400 boys and 400 girls in the fourth and fifth grade (800 students). General information for the survey subjects is shown in Table 1. Type of family for subjects was investigated; a nuclear family (with only parents and children) was recorded in 85.8% of subjects and an extended family system (with grandparents) in 14.3%. The mothers were aged in their 30s (53.0%) and 40s (44.8%), respectively, and the academic background of the mothers was university graduate in 38.6%, high school graduate in 36.5%, and college graduate in 15.6%. Occupation of the father was salaried men in 51.6%, showing the highest proportion, and the monthly income was 1.5-2.5 million won in 39.3%, above 3.5 million won in 20.3%, and less than 1.5 million won in 17.9% of subjects.

Eating habits according to residential area

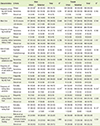
Differences of eating habits were investigated for elementary students in urban and suburban regions (Table 2). Male students' responses for eating frequency of breakfast and oily food showed the different propotion of the responses in urban area and suburban area in a significant difference (p < 0.05). Responses against the question of frequency of eating three types of side dishes or more had "always" in high proportion in both regions, but the proportion of such response in urban areas was higher in that of suburban areas for male students (p < 0.05). Daily consumption of dairy foods was higher in urban areas regardless of gender (p < 0.05). Female students' responses for eating frequency of fruit showed the different aspect such as 'every day' in urban area but 'sometimes' in suburban area, in a significant difference (p < 0.001). Other responses for eating habits did not show a significant difference according to the residential area.
Male students in urban areas ate breakfast, unbalanced diets, and dairy products more frequently than male students in suburban areas (p < 0.05). Although there were male students eating breakfast every day in both urban and suburban areas of Daejeon, the higher proportion for eating breakfast every day was shown in the case of urban regions in a significant difference (p < 0.05). However, female students in urban areas more frequently ate dairy products (p < 0.01) and fruits (p < 0.001) than female students in suburban areas. Additionally, the proportion of female students who consumed dairy foods everyday was higher in urban areas (p < 0.01).

Food preferences according to the place of residence

Rice, noodles, and soups

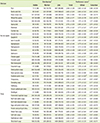
Preferences for rice, noodles, and soups are shown in Table 3. Average preference for bean-mixed rice, red-beans bap, pumpkin gruel, and red-bean gruel scored less than 2.0, and it was evident that the students did not like these. Based on the result comparing the differences by regions, Kimchi fried rice was the most popular food item of students in urban areas (2.7) and suburban areas (2.8), with the students in suburban areas liking Kimchi fried rice more than those in urban areas (p < 0.05).
Among the soups, pollack soup scored 1.9, indicating that this menu is far from students' preference. The students liked Galbitang (2.8) the most, and also liked seaweed soup and dumpling soup. Students in urban areas (2.7) liked soybean paste soup more than those in suburban areas (2.6) (p < 0.01).

Steamed/hard-boiled dishes, roasted/pan-fried dishes, and pan-broiled/fried dishes

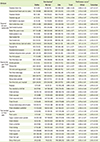
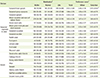
Preferences for steamed/hard-boiled dishes, roasted/pan-fried dishes, pan-broiled/fried dishes are shown in Table 4. In steamed/hard-boiled dishes, hard-boiled lotus root, hard-boiled burdock, and hard-boiled chestnut, bean, and walnut scored less than 2.0 and were not preferred by elementary students. On the other hand, steamed short ribs scored the highest preference at 2.9 and was found to be the most popular food item in steamed/hard-boiled dishes. In addition, steamed egg gel and beef boiled in soy sauce were preferred by elementary students. In roasted/pan-fried dishes, pan-fried lotus root, grilled wheat cake, and mung-bean pancake scored less than 2.0 points for preference and was not preferred by elementary students. Pan-fried rolled eggs was the most preferred dish, scoring 2.8 points for preference. Preference for steamed/hard-boiled dishes and roasted/pan-fried dishes did not show a regional difference.
Average preference for fried lotus root and fried squash among roasted/fried foods was less than 2.0 and was not preferred by students. Bulgogi, pork cutlet, and deep-fried pork scored more than 2.8 points for preference and were favored by most students. Additionally, fried sausage, Japchae, and fried chicken were preferred by students. Preference for pan-fried cuttlefish was scored 2.6 by students from urban areas and 2.7 by those from suburban areas, thus being shown as a favorite of students from suburban areas (p < 0.05).

Seasoned vegetables/salads and Kimchis

Preference for seasoned vegetables/salads and Kimchi are shown in Table 5. Seasoned Saussurea, a mix of cucumber, roots of balloon flower, and seasoned zucchini scored less than 2.0 for preference and was not preferred by students. Fruit punch showed the highest preference, at 2.8 points, and the fruit salads and seasoned bean sprouts had a high preference from students (Table. 5). Preference for seasoned bean sprouts was scored 2.5 by students from urban areas and 2.6 by those from suburban areas, thus shown as being preferred more by students from suburban areas (p < 0.05). Preference for Kimchi scored more than 2.0, and cabbage Kimchi was the most preferred by students (2.7). Preference for Altari was scored 2.3 by students from urban areas and 2.4 by those from suburban areas, and was thus shown as preferred more by students from suburban areas (p < 0.05).

Fruits and other side dishes

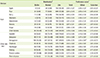
Preference for fruits and other foods are shown in Table 6. Preference for all kinds of fruits scored more than 2.5, and all kinds of fruits were preferred by students. Apples, strawberries, mandarin, and watermelon especially scored above 2.9 for preference. In other side dishes, the preference for Injeolmi and pizza had more than 2.7 preference points.

Discussion

According to the investigation for family type and the occupation of parents in this study, the proportions of double-income families and nuclear families were approximately 51.8% and 77.1%, respectively. These proportions were much higher than the proportion of double-income families (24.6%) of a metropolitan city in 2007, and were also higher than the proportion of nuclear families (53.7%) [14]. This result reflects the present social situation, which has an increased proportion of nuclear families and double-income families. Increased participation of women in economic activity might be a cause of the reduction of housework functions and the loss of nutrient intake in children of double-income families. Therefore, proper nutrition education is absolutely necessary in the school food service.
According to the results for differences of eating habits according to the residence of elementary school students in Daejeon, the male students in urban areas ate a regular breakfast (p < 0.05), three side dishes (p < 0.05), and dairy products and fruits (p < 0.05) more frequently than the students in suburban areas. Additionally, the male students in urban areas ate oily foods less than the students in suburban areas (p < 0.05). Considering these results, the eating habits of students in same age group were found to be different per urban or suburban residence.
The female students ate more often with the family, as compared with the male students (p < 0.05). In the case of snack intake, the girls preferred more vegetables/fruits and the boys preferred cookies/beverages, respectively (Table 2, data not shown). Investigation of the eating of balanced meals showed significant differences between the male and female students (p < 0.05). Instant foods were consumed more frequently by the male students than the female students (p < 0.05), and this difference showed a similarity with the results on the basis of residence (p < 0.05).
Shin et al. [15] reported that the eating habit of elementary school students is dependent on residential regions in Seoul. In the study on the dietary life attitude of the male/female high school students in Gyeongju, the preference of the male students for instant food was significantly different from that of the female students [16], which was similar to our result. Although the age of subjects in our study differed slightly from that in previous studies, we can conclude that eating habits depend on the gender or residence. In Park & Koo's study [17] to investigate the eating habits of elementary school students in the Daejeon area, the eating habits of students in higher grades was worse than that of students in the lower grades, and about 25.8% of children skipped a meal because they did not know what kind of meal they should eat. If a teacher explained the lunch menu, 82.5% of students responded that they would eat lunch. According to the study on the effect of nutrition education methods for 6th grade elementary school students in the Sokcho area [18], the effect of nutrition education using school newsletters was better than children's education groups. Park et al. reported that the on-site training in school was the most effective method for nutrition education [18]. Considering the above results, it appears that the eating habits and eating behaviors of school-age children are affected by the surrounding environment. Therefore, in planning a school meal service, we should consider and plan a specialized meal to suit the students' characteristics and home environment. Because eating habits are formed during the school years, basic education to help with making the right choice against instant foods is necessary. Additionally, because the eating habits were not improved despite the provision of a school meal service, the nutrition education should be more systematic and continuous, and should take into consideration the gender and regional characteristics of students.
With regards to food preferences of elementary school students for rice, noodles, and soups, white rice was the most favorite and Jajangmyeon was most preferred as a one-dish meal. This result is consistent with Kim et al.'s report [13]. As shown in Table 5, the seasoned vegetables and a one-dish meals had low and high preference by students, respectively. Because food preference is dependent on complex characteristics such as color, texture, taste, and cooking recipe [19], a variety of recipes for improvement of food preference may increase the intake of vegetables for the students. For students, the favorite foods were included in the menu of the school food service, but the mixed five grains rice and some foods had a low preference by students. If mixed five grains rice was provided as Kimchi-fried rice with finely crushed beans and mixed five grains rice was cooked as Bibimbab, highly preferred meal among the students, the balanced diet including the consumption of food in low preference can be easily encouraged to students. For this reason, the various diet recipes and menus should be developed through a continuous food preference survey.
The students' preference for soup occurred in the following order: Galbitang > Ddeokkguk > dumpling soup > potato and pork pot stew, which is consistent with Kim et al.'s report [13] for food preference of adolescents in the city and local area. Generally, the students liked meat soups. In a preference survey for steamed, hard-boiled, roasted, pan-fried, pan-broiled, and fried dishes, the most preferred menu was meat foods, such as steamed short ribs, steamed egg gel, beef boiled in soy sauce, Bulgogi, pork cutlet, deep-fried pork, and fried chicken. This result was consistent with Yoon et al.'s [12] and Kim's report [20] for the food preference of elementary school students in Daegu and Yeungnam, respectively. Koreans consume proteins more than twice value of the recommended intake amount, according to 2009 Korea National Health & Nutrition Examination Survey [21]. Therefore, nutrition education is necessary for a proper intake of nutrients from school age.
Seasoned vegetables had a low preference generally although seasoned bean sprouts had the highest preference among seasoned vegetables, which was consistent with Kim et al. [13] and Yoon et al.'s reports [12]. All kinds of Kimchi had a comparatively high preference by students and cabbage Kimchi was the most favorite Kimchi among students. Fruits had a high preference amongst students and they especially preferred the fruit punch and fruit salads. For Koreans, sodium is the nutrient with the highest intake proportion, as compared with the adequate nutrition intake for school-age children [22]. Because the consumption of Kimchi can increase the sodium intake, a menu with low sodium content, such as radish salad or salads, should be included in the school meal service. Although the elementary school students prefer fruits, in reality, the students did not eat enough fruits due to poor eating habits [1213]. According to the eating habits of students of urban and suburban areas in this study the proportion of dairy products and fruits eaten every day was higher in students of urban area than in students of suburban area. Therefore, supplying fruits and dairy products in school meal more than twice per week in suburban areas may help the students increase their intake of fresh fruits and dairy products. In addition, the education about the proper selection of snacks will help the formation of healthy eating behavior.

Conclusion

There are distinct differences in eating habits and food preferences according to the location of residence for 4th and 5th grade students in the elementary schools of Daejeon. However, the results in this research can not be generalized for all since the subject of this study was only restricted to 4th and 5th grade school children. Also this study had some limitation such as missing recipes and foods, and classification of recipes according to just main food ingredients for the menu of school meal. Students can access proper nutrient supply through a well-planned menu which lead the students to actively participate the school meal program. Therefore, the school meals should provide enough nutrients and a realistic menu plan for the physical development and health of students.

Figures and Tables

Table 1

General characteristics of the subjects

cnr-4-190-i001
Characteristics Criteria N (%)
Grade 4th grade 400 (50.00)
5th grade 400 (50.00)
Gender Male 400 (50.00)
Female 400 (50.00)
Place of residence The suburban area 400 (50.00)
The urban area 400 (50.00)
Family type Extended family 114 (14.26)
Nuclear family 686 (85.75)
Employment status of children's parents All 414 (51.75)
Father 345 (43.13)
Mother 25 (3.13)
Not employed 16 (2.00)
Age of children's mother Twenties 6 (0.75)
Thirties 424 (53.00)
Forties 358 (44.75)
Fifties 12 (1.50)
Educational background of children's mother High school 292 (36.50)
Technical college 125 (15.63)
College 309 (38.63)
A postgraduate school 74 (9.25)
Occupation of children's father Independent enterprise 225 (28.13)
Salaryman 413 (51.63)
Civil service 149 (18.63)
Agriculture and stock-breeding 13 (1.63)
Monthly income (10,000 Won) <150 143 (17.88)
150-250 314 (39.25)
250-350 181 (22.63)
>350 162 (20.25)
Total 800 (100.00)
Table 2

Eating habits of the subjects by the place of residence

cnr-4-190-i002
Characteristics Criteria Male Total X2 Female Total X2
Urban Suburban Urban Suburban
Frequency of eating with family together Always 94 (47.00)* 85 (42.50) 179 (44.75) 3.051 100 (50.00) 96 (48.00) 196 (49.00) 0.162
Sometimes 100 (50.00) 102 (51.00) 202 (50.50) 97 (48.50) 101 (50.50) 198 (49.50)
Almost not 6 (3.00) 13 (6.50) 19 (4.75) 3 (1.50) 3 (1.50) 6 (1.50)
Meal time <10 minutes 36 (18.00) 39 (19.50) 75 (18.75) 0.645 26 (13.00) 32 (16.00) 58 (14.50) 0.749
10-30 minutes 137 (68.50) 139 (69.50) 276 (69.00) 143 (71.50) 137 (68.50) 280 (70.00)
>30 minutes 27 (13.50) 22 (11.00) 49 (12.25) 31 (15.50) 31 (15.50) 62 (15.50)
Frequency of eating breakfast Always 155 (77.50) 135 (67.50) 290 (72.50) 8.053 143 (71.50) 139 (69.50) 282 (70.50) 0.362
Sometimes 42 (21.00) 53 (26.50) 95 (23.75) 46 (23.00) 51 (25.50) 97 (24.25)
Almost not 3 (1.50) 12 (6.00) 15 (3.75) 11 (5.50) 10 (5.00) 21 (5.25)
Frequency of snacking before taking a meal Always 11 (5.50) 8 (4.00) 19 (4.75) 3.706 10 (5.00) 8 (4.00) 18 (4.50) 1.117
Sometimes 87 (43.50) 106 (53.00) 193 (48.25) 111 (55.50) 103 (51.50) 214 (53.50)
Almost not 102 (51.00) 86 (43.00) 188 (47.00) 79 (39.50) 89 (44.50) 168 (42.00)
Kind of main snack Vegetable/fruit 91 (45.50) 70 (35.00) 161 (40.25) 4.635 104 (52.00) 98 (49.00) 202 (50.50) 0.738
Fastfood 14 (7.00) 18 (9.00) 32 (8.00) 11 (5.50) 9 (4.50) 20 (5.00)
Cookie/beverage 95 (47.50) 112 (56.00) 207 (51.75) 85 (42.50) 93 (46.50) 178 (44.50)
Frequency of unbalanced diet Always 91 (45.50) 68 (34.00) 159 (39.75) 5.608 111 (55.50) 87 (43.50) 198 (49.50) 5.780
Sometimes 97 (48.50) 119 (59.50) 216 (54.00) 79 (39.50) 101 (50.50) 180 (45.00)
Almost not 12 (6.00) 13 (6.50) 25 (6.25) 10 (5.00) 12 (6.00) 22 (5.50)
Frequency of eating 3 types of side dishes or more Always 135 (67.50) 111 (55.50) 246 (61.50) 6.805 124 (62.00) 134 (67.00) 258 (64.50) 1.271
Sometimes 48 (24.00) 60 (30.00) 108 (27.00) 54 (27.00) 49 (24.50) 103 (25.75)
Almost not 17 (8.50) 29 (14.50) 46 (11.50) 22 (11.00) 17 (8.50) 39 (9.75)
Frequency of eating oily food Frequently 12 (6.00) 26 (13.00) 38 (9.50) 6.838 17 (8.50) 19 (9.50) 36 (9.00) 2.043
Sometimes 179 (89.50) 161 (80.50) 340 (85.00) 172 (86.00) 163 (81.50) 335 (83.75)
Almost not 9 (4.50) 13 (6.50) 22 (5.50) 11 (5.50) 18 (9.00) 29 (7.25)
Frequency of eating dairy products Everyday 94 (47.00) 69 (34.50) 163 (40.75) 6.571 104 (52.00) 74 (37.00) 178 (44.50) 13.222
Sometimes 96 (48.00) 117 (58.50) 213 (53.25) 91 (45.50) 109 (54.50) 200 (50.00)
Almost not 10 (5.00) 14 (7.00) 24 (6.00) 5 (2.50) 17 (8.50) 22 (5.50)
Frequency of eating instant food Frequently 15 (7.50) 24 (12.00) 39 (9.75) 2.302 20 (10.00) 19 (9.50) 39 (9.75) 3.569
Sometimes 167 (83.50) 159 (79.50) 326 (81.50) 159 (79.50) 147 (73.50) 306 (76.50)
Almost not 18 (9.00) 17 (8.50) 35 (8.75) 21 (10.50) 34 (17.00) 55 (13.75)
Frequency of eating fruit Everyday 101 (50.50) 69 (34.50) 170 (42.50) 4.635 116 (58.00) 74 (37.00) 190 (47.50) 19.131§
Sometimes 97 (48.50) 129 (64.50) 226 (56.50) 83 (41.50) 126 (63.00) 209 (52.25)
Almost not 2 (1.00) 2 (1.00) 4 (1.00) 1 (0.50) (0.00) 1 (0.25)
Change of meals after school feeding Reform of an unbalanced diet 43 (21.50) 50 (25.00) 93 (23.25) 1.063 60 (30.00) 60 (30.00) 120 (30.00) 1.731
Decrease of eating between meals 73 (36.50) 75 (37.50) 148 (37.00) 62 (31.00) 73 (36.50) 135 (33.75)
Almost not 84 (42.00) 75 (37.50) 159 (39.75) 78 (39.00) 67 (33.50) 145 (36.25)

*N(%); Significant difference between students lived in urban and suburban areas by X2-test, p<0.05; p<0.01; §p<0.001.

Table 3

Preferences on rice, noodle, and soup of the subjects by the place of residence

cnr-4-190-i003
Division Distribution* Preference score
Dislike Normal Like Total Urban Suburban
Rice & noodle Rice 11 (1.38) 102 (12.75) 687 (85.88) 2.84 ± 0.39 2.82 ± 0.42 2.86 ± 0.36
Barley and rice 28 (3.50) 223 (27.88) 549 (68.63) 2.65 ± 0.54 2.66 ± 0.53 2.63 ± 0.55
Bean-mixed rice 301 (37.63) 271 (33.88) 228 (28.50) 1.90 ± 0.80 1.92 ± 0.82 1.89 ± 0.79
Mixed five grains 167 (20.88) 271 (33.88) 362 (45.25) 2.24 ± 0.77 2.26 ± 0.78 2.22 ± 0.76
Red-beans bab 365 (45.63) 262 (32.75) 173 (21.63) 1.76 ± 0.78 1.75 ± 0.76 1.77 ± 0.80
Jajang bab 36 (4.50) 150 (18.75) 614 (76.75) 2.72 ± 0.53 2.69 ± 0.54 2.74 ± 0.52
Bibimbab 40 (5.00) 108 (13.50) 652 (81.50) 2.76 ± 0.52 2.73 ± 0.57 2.79 ± 0.47
Curried rice 54 (6.75) 141 (17.63) 605 (75.63) 2.68 ± 0.59 2.68 ± 0.59 2.69 ± 0.59
Kimchi fried rice 42 (5.25) 132 (16.50) 626 (78.25) 2.73 ± 0.54 2.68 ± 0.60 2.78 ± 0.48
Spaghetti 55 (6.88) 102 (12.75) 643 (80.38) 2.73 ± 0.57 2.72 ± 0.58 2.75 ± 0.56
Janchi noodle 52 (6.50) 147 (18.38) 601 (75.13) 2.68 ± 0.58 2.69 ± 0.58 2.67 ± 0.59
Jajangmyeon 25 (3.13) 99 (12.38) 676 (84.50) 2.81 ± 0.46 2.79 ± 0.49 2.83 ± 0.42
Naengmyeon 55 (6.88) 121 (15.13) 624 (78.00) 2.71 ± 0.58 2.72 ± 0.56 2.69 ± 0.60
Ramyeon 30 (3.75) 104 (13.00) 666 (83.25) 2.79 ± 0.48 2.80 ± 0.47 2.78 ± 0.49
Jjolmyeon 75 (9.38) 167 (20.88) 558 (69.75) 2.60 ± 0.65 2.55 ± 0.68 2.65 ± 0.61
Chicken gruel 115 (14.38) 222 (27.75) 463 (57.88) 2.43 ± 0.73 2.45 ± 0.71 2.41 ± 0.74
Pumpkin gruel 285 (35.63) 236 (29.50) 279 (34.88) 1.99 ± 0.84 2.02 ± 0.85 1.96 ± 0.62
Red-bean gruel 286 (35.75) 249 (31.13) 265 (33.13) 1.97 ± 0.83 1.98 ± 0.81 1.96 ± 0.84
Soup Seaweed soup 31 (3.88) 141 (17.63) 628 (78.50) 2.74 ± 0.51 2.76 ± 0.49 2.72 ± 0.53
Dried pollack soup 260 (32.50) 338 (42.25) 202 (25.25) 1.92 ± 0.75 1.92 ± 0.74 1.92 ± 0.77
Bean sprouts soup 76 (9.50) 222 (27.75) 502 (62.75) 2.53 ± 0.66 2.52 ± 0.66 2.53 ± 0.66
Soybean paste soup 62 (7.75) 178 (22.25) 560 (70.00) 2.62 ± 0.62 2.67 ± 0.60§ 2.57 ± 0.64
Yukgyejang 85 (10.63) 176 (22.00) 539 (67.38) 2.56 ± 0.67 2.55 ± 0.67 2.57 ± 0.67
Dumpling soup 36 (4.50) 119 (14.88) 645 (80.63) 2.76 ± 0.52 2.74 ± 0.53 2.77 ± 0.50
Galbitang 26 (3.25) 91 (11.38) 683 (85.38) 2.82 ± 0.46 2.85 ± 0.40 2.79 ± 0.50
Frozen pollack pot stew 185 (23.13) 318 (39.75) 297 (37.13) 2.14 ± 0.76 2.11 ± 0.78 2.17 ± 0.74
Deokkguk 31 (3.88) 108 (13.50) 661 (82.63) 2.78 ± 0.49 2.80 ± 0.48 2.77 ± 0.50
Fermented soybean soup 242 (30.25) 226 (28.25) 332 (41.50) 2.11 ± 0.84 2.17 ± 0.82 2.05 ± 0.84
Beef and radish soup 92 (11.50) 211 (26.38) 497 (62.13) 2.50 ± 0.69 2.49 ± 0.72 2.51 ± 0.66
Beef and seaweed soup 71 (8.88) 163 (20.38) 566 (70.75) 2.61 ± 0.64 2.65 ± 0.63 2.58 ± 0.65
Eggs and green onion soup 139 (17.38) 264 (33.00) 397 (49.63) 2.32 ± 0.75 2.30 ± 0.76 2.34 ± 0.73
Potato and pork pot stew 53 (6.63) 139 (17.38) 608 (76.00) 2.69 ± 0.58 2.70 ± 0.57 2.68 ± 0.60
Weak flake soup 76 (9.50) 163 (20.38) 561 (70.13) 2.60 ± 0.65 2.63 ± 0.64 2.57 ± 0.66
Soft tofu soup 74 (9.25) 185 (23.13) 541 (67.63) 2.58 ± 0.65 2.59 ± 0.65 2.57 ± 0.65
Seafood pot stew 84 (10.50) 188 (23.50) 528 (66.00) 2.55 ± 0.67 2.54 ± 0.68 2.57 ± 0.66
Thick beef soup 106 (13.25) 225 (28.13) 469 (58.63) 2.45 ± 0.71 2.45 ± 0.72 2.45 ± 0.71

*N(%); Mean ± standard deviation, 3=like, 2=normal, 1=dislike; Significant difference between students lived in urban and suburban areas by independent t-test, p < 0.05; §p < 0.01.

Table 4

Preferences on steamed, hard-boiled, roasted, and fried dish of the subjects by the place of residence

cnr-4-190-i004
Division Distribution* Preference score
Dislike Normal Like Total Urban Suburban
Steamed & hard-boiled dish Steamed short ribs 10 (1.25) 70 (8.75) 720 (90.00) 2.88 ± 0.35 2.89 ± 0.33 2.87 ± 0.37
Steamed beef shank and rice cakes 151 (18.88) 388 (48.50) 261 (32.63) 2.13 ± 0.70 2.15 ± 0.68 2.12 ± 0.72
Steamed chicken 59 (7.38) 149 (18.63) 592 (74.00) 2.66 ± 0.60 2.70 ± 0.58 2.63 ± 0.63
Steamed egg gel 41 (5.13) 122 (15.25) 637 (79.63) 2.74 ± 0.54 2.70 ± 0.57 2.79 ± 0.50
Beef boiled in soy sauce 35 (4.38) 112 (14.00) 653 (81.63) 2.77 ± 0.51 2.77 ± 0.51 2.77 ± 0.50
Hard boiled lotus root 279 (34.88) 309 (38.63) 212 (26.50) 1.91 ± 0.77 1.94 ± 0.80 1.89 ± 0.75
Hard-boiled burdock 318 (39.75) 295 (36.88) 187 (23.38) 1.83 ± 0.77 1.86 ± 0.78 1.81 ± 0.76
Boiled fish paste in soy 107 (13.38) 188 (23.50) 505 (63.13) 2.49 ± 0.71 2.47 ± 0.73 2.52 ± 0.70
Boiled potato in soy 79 (9.88) 163 (20.38) 558 (69.75) 2.59 ± 0.66 2.62 ± 0.65 2.57 ± 0.66
Hard-boiled fish 131 (16.38) 236 (29.50) 433 (54.13) 2.37 ± 0.75 2.35 ± 0.76 2.39 ± 0.73
Hard-boiled tofu 105 (13.13) 196 (24.50) 499 (62.38) 2.49 ± 0.71 2.49 ± 0.72 2.48 ± 0.70
Hard-boiled chestnut, beam and walnut 325 (40.63) 306 (38.25) 169 (21.13) 1.80 ± 0.76 1.81 ± 0.74 1.79 ± 0.77
Roasted & pan-fried dish Roasted fish 105 (13.13) 180 (22.50) 515 (64.38) 2.51 ± 0.71 2.49 ± 0.72 2.52 ± 0.70
Roasted dried seaweed 55 (6.88) 158 (19.75) 587 (73.38) 2.66 ± 0.60 2.65 ± 0.61 2.68 ± 0.58
Seafood and green onion pancake 201 (25.13) 269 (33.63) 330 (41.25) 2.16 ± 0.79 2.12 ± 0.80 2.19 ± 0.79
Pan-fried potato 111 (13.88) 182 (22.75) 507 (63.38) 2.49 ± 0.72 2.49 ± 0.72 2.49 ± 0.73
Pan-fried lotus root 322 (40.25) 316 (39.50) 162 (20.25) 1.80 ± 0.75 1.81 ± 0.75 1.78 ± 0.74
Kimchi pancake 73 (9.13) 153 (19.13) 574 (71.75) 2.62 ± 0.64 2.65 ± 0.63 2.59 ± 0.65
Filleted fish 233 (29.13) 323 (40.38) 244 (30.50) 2.01 ± 0.77 1.99 ± 0.76 2.03 ± 0.78
Fish stick and egg pancake 112 (14.00) 194 (24.25) 494 (61.75) 2.47 ± 0.72 2.43 ± 0.74 2.52 ± 0.70
Pan-fried rolled eggs 35 (4.38) 106 (13.25) 659 (82.38) 2.78 ± 0.50 2.77 ± 0.50 2.78 ± 0.51
Grilled wheat cake 246 (30.75) 341 (42.63) 213 (26.63) 1.95 ± 0.75 1.98 ± 0.75 1.93 ± 0.75
Mung-bean pancake 287 (35.88) 302 (37.75) 211 (26.38) 1.90 ± 0.78 1.91 ± 0.78 1.89 ± 0.78
Pan-fried tofu and meatball 226 (28.25) 272 (34.00) 302 (37.75) 2.09 ± 0.80 2.09 ± 0.81 2.09 ± 0.80
Pan-broiled & fried dish Bulgogi 12 (1.50) 65 (8.13) 723 (90.38) 2.88 ± 0.35 2.88 ± 0.36 2.89 ± 0.35
Pan-broiled cuttlefish 60 (7.50) 147 (18.38) 593 (74.13) 2.66 ± 0.61 2.62 ± 0.64 2.71 ± 0.57
Fried anchovy 86 (10.75) 228 (28.50) 486 (60.75) 2.50 ± 0.68 2.50 ± 0.69 2.49 ± 0.67
Fried sausage 31 (3.88) 116 (14.50) 653 (81.63) 2.77 ± 0.50 2.75 ± 0.51 2.80 ± 0.48
Fried seaweed stem 200 (25.00) 247 (30.88) 353 (44.13) 2.19 ± 0.80 2.15 ± 0.81 2.22 ± 0.80
Fried Kimchi 53 (6.63) 108 (13.50) 639 (79.88) 2.73 ± 0.57 2.70 ± 0.60 2.76 ± 0.53
Fried pan-broiled octopus with chili pastes 129 (16.13) 179 (22.38) 492 (61.50) 2.45 ± 0.75 2.43 ± 0.76 2.47 ± 0.74
Fried shredded cuttlefish 111 (13.88) 168 (21.00) 521 (65.13) 2.51 ± 0.72 2.48 ± 0.75 2.54 ± 0.69
Japchae 52 (6.50) 121 (15.13) 627 (78.38) 2.71 ± 0.57 2.72 ± 0.58 2.71 ± 0.56
Pork cutlet 12 (1.50) 76 (9.50) 712 (89.00) 2.87 ± 0.37 2.86 ± 0.39 2.89 ± 0.35
Sugar coated sweet potato 83 (10.38) 157 (19.63) 560 (70.00) 2.59 ± 0.66 2.61 ± 0.67 2.58 ± 0.67
Fried chicken 46 (5.75) 108 (13.50) 646 (80.75) 2.75 ± 0.55 2.78 ± 0.54 2.71 ± 0.55
Fried cuttlefish 60 (7.50) 123 (15.38) 617 (77.13) 2.69 ± 0.60 2.68 ± 0.60 2.71 ± 0.59
Fried shrimp 67 (8.38) 108 (13.50) 625 (78.13) 2.69 ± 0.61 2.65 ± 0.66 2.74 ± 0.56
Fried lotus root 319 (39.88) 285 (35.63) 196 (24.50) 1.84 ± 0.78 1.83 ± 0.80 1.86 ± 0.76
Fried squash 291 (36.38) 251 (31.38) 258 (32.25) 1.95 ± 0.82 1.97 ± 0.83 1.94 ± 0.81
Fried fish ball 214 (26.75) 249 (31.13) 337 (42.13) 2.15 ± 0.81 2.13 ± 0.81 2.17 ± 0.81
Deep-fried pork 20 (2.50) 74 (9.25) 706 (88.25) 2.85 ± 0.41 2.85 ± 0.42 2.86 ± 0.40

*N(%); Mean ± standard deviation; 3=like, 2=normal, 1=dislike; Significant difference between students lived in urban and suburban areas by independent t-test, p<0.05.

Table 5

Preference on seasoned vegetable, salad, and Kimchi of the subjects by the place of residence

cnr-4-190-i005
Division Distribution* Preference score
Dislike Normal Like Total Urban Suburban
Seasoned vegetable & salad Seasoned bean sprouts 96 (12.00) 185 (23.13) 519 (64.88) 2.52 ± 0.69 2.46 ± 0.74 2.59 ± 0.64‡§
Seasoned genus saussurea 250 (31.25) 331 (41.38) 219 (27.38) 1.96 ± 0.76 1.95 ± 0.76 1.96 ± 0.76
Seasoned spinach 198 (24.75) 240 (30.00) 362 (45.25) 2.20 ± 0.81 2.18 ± 0.83 2.22 ± 0.78
Mixed cucumber and roots of balloon flower 278 (34.75) 300 (37.50) 222 (27.75) 1.93 ± 0.78 1.87 ± 0.77 1.98 ± 0.79
Acorn-starch jelly 117 (14.63) 181 (22.63) 502 (62.75) 2.48 ± 0.73 2.46 ± 0.77 2.49 ± 0.70
Mixed green-lentil jelly and dried seaweed 239 (29.88) 278 (34.75) 283 (35.38) 2.05 ± 0.80 2.05 ± 0.82 2.06 ± 0.78
Seasoned cucumber 164 (20.50) 193 (24.13) 443 (55.38) 2.34 ± 0.79 2.30 ± 0.82 2.39 ± 0.77
Seasoned zucchini 340 (42.50) 285 (35.63) 175 (21.88) 1.79 ± 0.77 1.78 ± 0.77 1.80 ± 0.78
Radish salad 248 (31.00) 255 (31.88) 297 (37.13) 2.06 ± 0.82 2.05 ± 0.84 2.07 ± 0.80
Fruit punch 40 (5.00) 86 (10.75) 674 (84.25) 2.79 ± 0.51 2.78 ± 0.52 2.80 ± 0.50
Lettuce salad 183 (22.88) 227 (28.38) 390 (48.75) 2.25 ± 0.80 2.24 ± 0.81 2.27 ± 0.79
Fruit salad 90 (11.25) 106 (13.25) 604 (75.50) 2.64 ± 0.67 2.63 ± 0.68 2.65 ± 0.66
Macaroni salad 283 (35.38) 224 (28.00) 293 (36.63) 2.01 ± 0.84 2.01 ± 0.85 2.01 ± 0.84
Kimchi Sliced white radish Kimchi 69 (8.63) 193 (24.13) 538 (67.25) 2.58 ± 0.64 2.57 ± 0.65 2.59 ± 0.63
Cabbage Kimchi 43 (5.38) 134 (16.75) 623 (77.88) 2.72 ± 0.55 2.71 ± 0.57 2.73 ± 0.53
Young radish Kimchi 89 (11.13) 166 (20.75) 545 (68.13) 2.57 ± 0.68 2.54 ± 0.69 2.59 ± 0.66
Altari 125 (15.63) 253 (31.63) 422 (52.75) 2.37 ± 0.73 2.32 ± 0.73 2.42 ± 0.73
Bossam 116 (14.50) 218 (27.25) 466 (58.25) 2.43 ± 0.73 2.42 ± 0.74 2.44 ± 0.72
Watery radish Kimchi 104 (13.00) 180 (22.50) 516 (64.50) 2.51 ± 0.71 2.53 ± 0.71 2.49 ± 0.71
Stuffed cucumber pickles 157 (19.63) 207 (25.88) 436 (54.50) 2.34 ± 0.78 2.36 ± 0.78 2.33 ± 0.79
Sesame leaves pickle 202 (25.25) 201 (25.13) 397 (49.63) 2.24 ± 0.83 2.24 ± 0.82 2.24 ± 0.83

*N(%); Mean ± standard deviation; 3=like, 2=normal, 1=dislike; Significant difference between students lived in urban and suburban areas by independent t-test, p < 0.05.

Table 6

Preferences on fruit and other side dishes of the subjects by the place of residence

cnr-4-190-i006
Division Distribution* Preference score
Dislike Normal Like Total Urban Suburban
Fruit Apple 9 (1.13) 28 (3.50) 763 (95.38) 2.94 ± 0.27 2.94 ± 0.27 2.94 ± 0.27
Pear 24 (3.00) 77 (9.63) 699 (87.38) 2.84 ± 0.43 2.83 ± 0.45 2.85 ± 0.42
Berry 11 (1.38) 34 (4.25) 755 (94.38) 2.93 ± 0.30 2.92 ± 0.32 2.94 ± 0.28
Mandarin 6 (0.75) 28 (3.50) 766 (95.75) 2.95 ± 0.25 2.94 ± 0.27 2.95 ± 0.22
Watermelon 12 (1.50) 44 (5.50) 744 (93.00) 2.91 ± 0.32 2.92 ± 0.31 2.90 ± 0.34
Banana 25 (3.13) 54 (6.75) 721 (90.13) 2.87 ± 0.41 2.86 ± 0.41 2.87 ± 0.42
Grape 19 (2.38) 52 (6.50) 729 (91.13) 2.88 ± 0.38 2.89 ± 0.36 2.87 ± 0.40
A bell tomato 80 (10.00) 80 (10.00) 640 (80.00) 2.70 ± 0.64 2.69 ± 0.64 2.70 ± 0.63
Other side dish Injeolmi 45 (5.63) 126 (15.75) 629 (78.63) 2.73 ± 0.55 2.73 ± 0.55 2.72 ± 0.56
Jeolpyeon 89 (11.13) 263 (32.88) 448 (56.00) 2.44 ± 0.68 2.47 ± 0.67 2.42 ± 0.69
Jeungpyeon 106 (13.25) 297 (37.13) 397 (49.63) 2.36 ± 0.70 2.42 ± 0.67 2.30 ± 0.73
Chaldeok 65 (8.13) 160 (20.00) 575 (71.88) 2.63 ± 0.62 2.66 ± 0.61 2.61 ± 0.64
Hamburger 58 (7.25) 134 (16.75) 608 (76.00) 2.68 ± 0.60 2.66 ± 0.61 2.70 ± 0.58
Hotdog 50 (6.25) 152 (19.00) 598 (74.75) 2.68 ± 0.58 2.65 ± 0.58 2.71 ± 0.57
Peanut cookies 127 (15.88) 245 (30.63) 428 (53.50) 2.37 ± 0.74 2.36 ± 0.72 2.38 ± 0.76
Piece of pizza 53 (6.63) 131 (16.38) 616 (77.00) 2.70 ± 0.58 2.69 ± 0.57 2.71 ± 0.59

*N(%); Mean ± standard deviation; 3=like, 2=normal, 1=dislike; Significant difference between students lived in urban and suburban areas by independent t-test, p < 0.05.

Notes

Conflict of interest We declare that we have no conflict of interest.

References

1. Ministry of Education. Special education health division. Seoul: Ministry of Education;2003.
2. Williams SR, Worthington-Roberts BS. Nutrition throughout the life cycle. St. Louis (MO): Times Mirror/Mosby College Publishing;1988.
3. Mazur R, Sanders D. Socioeconomic factors associated with child health and nutrition in peri-urban Zimbabwe. Ecol Food Nutr. 1988; 22:19–34.
crossref
4. Evans RI, Hall Y. Social-psychologic perspective in motivating changes in eating behavior. J Am Diet Assoc. 1978; 72:378–383.
crossref
5. Kim KN. A study on relationship between food habits and personality. Korean J Nutr. 1982; 15:194–201.
6. Hodkinson HM. Diet and maintenance of mental health in the elderly. Nutr Rev. 1988; 46:79–82.
crossref
7. Bell AC, Stewart AM, Radford AJ, Cairney PT. A method for describing food beliefs which may predict personal food choice. J Nutr Educ. 1981; 13:22–26.
crossref
8. Drewnowski A. Taste preferences and food intake. Annu Rev Nutr. 1997; 17:237–253.
crossref
9. Baxter SD, Thompson WO, Davis HC. Fourth-grade children's observed consumption of, and preferences for, school lunch foods. Nutr Res. 2000; 20:439–443.
crossref
10. Rozin P. Acquisition of stable food preferences. Nutr Rev. 1990; 48:106–113.
crossref
11. Fetzer JN, Solt PF, McKinney S. Typology of food preferences identified by Nutri-Food Sort. J Am Diet Assoc. 1985; 85:961–965.
crossref
12. Yoon YO, Lee YS, Kim SM. The dietary behavior and food preference of elementary and high school students in Youngnam areas. J East Asian Soc Diet Life. 2006; 16:13–22.
13. Kim MB, Lee YK, Lee HS. Food behaviors and food preferences of the teenagers in urban, fishing, and rural areas. J East Asian Soc Diet Life. 1997; 7:341–354.
14. Statistics Korea. Society index for Korea. Daejeon: Statistics Korea;2009.
15. Shin EK, Kim SY, Lee S, Bae I, Lee H. Fast food consumption patterns and eating habits of 6th grade elementary school children in Seoul. J East Asian Soc Diet Life. 2008; 18:662–674.
16. Yoo JE, Park GS. A study of the dietary behavior and food preference of adolescents. J East Asian Soc Diet Life. 2003; 13:19–24.
17. Park CI, Koo NS. Study on food habits of elementary school food service children in Taejon. J Korean Diet Assoc. 1998; 4:113–122.
18. Park HJ, Lee JS, Kim EK. Assessment of nutrition label education in sixth grade elementary school students. J Korean Diet Assoc. 2010; 16:226–238.
19. Yim KS, Lee TY. Menu analysis of the national school lunch program : the comparisons of the frequency of menu with the students' food preferences. J Korean Diet Assoc. 1998; 4:188–199.
20. Kim YJ. Comparisons of food preference, food habit and dietary attitude of children receiving school food service at elementary school and middle school: in Nam Jeju gun region [MS Thesis]. Gyeongsan: Taegu University;2000.
21. Ministry of Health and Welfare, Korea Centers for Disease Control and Prevention. Korea Health Statistics 2009: Korea National Health and Nutrition Examination Survey (KNHANES IV-3). Cheongwon: Korea Centers for Disease Control and Prevention;2010.
22. The Korean Nutrition Society. Dietary reference intakes for Koreans. 1st rev. Seoul: The Korean Nutrition Society;2010.
TOOLS
Similar articles