Journal List > Clin Nutr Res > v.4(2) > 1059790

Chun, Sohn, Song, Lee, Youn, Lee, and Park: Associations of Colorectal Cancer Incidence with Nutrient and Food Group Intakes in Korean Adults: A Case-Control Study

Abstract

This study aimed to examine the associations between intakes of various nutrients and food groups and colorectal cancer risk in a case-control study among Koreans aged 20 to 80 years. A total of 150 new cases and 116 controls were recruited with subjects' informed consent. Dietary data were collected using the food frequency questionnaire developed and validated by the Korea Centers for Disease Control and Prevention. Multivariate logistic regression models were used to estimate odds ratios (ORs) and corresponding 95% confidence intervals (CIs) for colorectal cancer incidence. High intakes of total lipid (ORT3 vs T1 = 4.15, 95% CI: 1.33-12.96, p for trend = 0.034), saturated fatty acid (ORT3 vs T1 = 2.96, 95% CI: 1.24-7.04, p for trend = 0.016) and monounsaturated fatty acid (ORT3 vs T1 = 3.04, 95% CI: 1.23-7.54, p for trend = 0.018) were significantly associated with increased incidence of colorectal cancer. High dietary fiber (ORT3 vs T1 = 0.22, 95% CI: 0.08-0.56, p for trend = 0.002) and vitamin C (ORT3 vs T1 = 0.38, 95% CI: 0.14-1.05, p for trend = 0.021) intakes were significantly associated with reduced colorectal cancer incidence. From the food group analysis, bread (ORT3 vs T1 = 2.26, 95% CI: 0.96-5.33, p for trend = 0.031), red meat (ORT3 vs T1 = 7.33, 95% CI: 2.98-18.06, p for trend < 0.001), milk·dairy product (ORT3 vs T1 = 2.42, 95% CI: 1.10-5.31, p for trend = 0.071) and beverage (ORT3 vs T1 = 3.17, 95% CI: 1.35-7.48, p for trend = 0.002) intakes were positively associated with colorectal cancer risk. On the other hand, high intake of traditional rice cake (ORT3 vs T1 = 0.35, 95% CI: 0.14-0.86, p for trend = 0.024) was linked with lower colorectal cancer incidence. In conclusion, eating a diet high in total lipid, saturated fatty acids and monounsaturated fatty acids is associated with higher incidence of colorectal cancer, whereas a diet high in dietary fiber and vitamin C was found to lower the incidence in Korean adults. Interestingly high traditional rice cake consumption is associated inversely with colorectal cancer incidence, warranting a future study.

Introduction

Cancer has been the leading cause of death which accounts for approximately 28% of the total number of deaths in Korea [1], and colorectal cancer is the third most common cancer and the fourth most common cause of cancer-related death. The incidence of colorectal cancer has shown a steep increase with 5.6% in men and 4.3% in women between 1999 and 2012.
The American Institute for Cancer Research (AICR) and the World Cancer Research Fund (WCRF) reported a comprehensive review of a series of nutritional epidemiology research on various factors for colorectal cancer prevention in 2007 [2]. This report classified protective or risk factors for colorectal cancer into five levels; "convincing", "probable", "limited-suggestive", "limited-no conclusion", and "substantial effect on risk unlikely". As for dietary factors, meat, processed meat, and alcohol consumption were included in the "convincing" risk factors for colorectal cancer for men. Alcohol consumption was included as a "probable" risk factor, and iron-containing foods, cheese, animal fat-containing foods, and sugar-containing foods was suggested as the "limited-suggestive" risk factors in women. Dietary fiber, garlic, milk, and dietary calcium were categorized into the "probable" protective factors, and non-starchy vegetables, fruits, folic acid-containing foods, selenium-containing foods, fish, and vitamin D-containing foods were categorized into the "limited-suggestive" protective factors for both men and women.
While a large body of research has shown a close relation of colorectal cancer with dietary factors, the majority of the studies have been conducted among non-Asian populations [2]. A rapid increase in incidence and mortality of colorectal cancer among Koreans may be partly related to dietary changes. However, studies examining dietary factors associated with colorectal cancer among Korean population are limited [3,4,5], as with other Asian countries. Considering notable differences in food culture between the West and the Asian area and presence of inconclusive hypotheses, continuous research is needed. Therefore we conducted a case-control study to examine how the intakes of specific nutrients and food groups are associated with colorectal cancer among Korean adults.

Materials and Methods

Subject recruitment

Between November 2010 and October 2011, the case subjects of this study were recruited from hospitalized patients who had been newly diagnosed with colorectal cancer during the recent three months in a university hospital in Seoul. Those who had been previously diagnosed with cancers or other chronic diseases which may require changes in eating habits (i.e., hypertension, diabetes, myocardial infarction, congestive heart failure, coronary artery disease, hyperlipidemia, and chronic kidney disease) were excluded. The control subjects were recruited from generally healthy adults without any diagnosis of cancers and other major chronic diseases in a general health screening within a year. Only subjects whose age are from 20 to 80 years were invited to participate in this study. Informed consent was obtained from each participant, and the study protocol was approved by the Institutional Review Board of Gangnam Severance Hospital, Yonsei University College of Medicine.

Data collection

A survey questionnaire was administered to each subject using face-to-face interview by a trained nutritionist. The questionnaire was conformed to obtain information on general characteristics, health-related lifestyle habits, and dietary intakes. A total of 150 cases and 116 controls completed the survey questionnaire. The general characteristics included sex, age, household income, educational level, height, and weight. For the weight, body weight prior to colorectal cancer diagnosis was asked to the case group, while current weight was recorded for the control group. Body mass index (BMI) was calculated for each subject using self-reported height and weight information. Questions on health-related lifestyle habits (i.e., smoking, alcohol drinking frequency, and leisure time physical activity) were slightly modified from the health behavior survey of the Korea National Health and Nutrition Survey [6].
Dietary intake was examined with the food frequency questionnaire (FFQ) developed by the Korea Centers for Disease Control and Prevention, and reliability and validity of the FFQ has been proven in Korean adults [7,8]. The FFQ is designed to assess usual food intake pattern during the past one year, and includes a total of 102 food items. Response options for most food items had 8 levels of 'none or little', 'once a month', '2-3 times a month', '1-2 times a week', '3-4 time a week', '5-6 times a week', 'once a day', 'twice a day', and '3 times a day'. For certain items including coffee, sugar for tea, cream for tea, green tea, soft drinks and other beverage, response options had 9 levels: 'little', 'once a month', '2-3 times a month', '1-2 times a week', '3-4 times a week', '5-6 times a week', '1-2 times a day', '3-4 times a day', and '5-6 time a day'. Portion size for each item was classified as 'less than standard', 'standard', and 'more than standard' and the food figures were presented for standard intake.

Statistical analysis

All statistical analyses were performed using SAS software (version 9.1, SAS Institute, Cary, NC, USA). Individual daily nutrient intake was calculated using CAN-Pro (version 4.0, The Korean Nutrition Society, Seoul, Korea). Chi-square test was used to compare the distribution of socio-demographic characteristics and health-related behavior variables between cases and controls. The ORs and corresponding CIs of colorectal cancer incidence risk were produced according to the tertile levels of each nutrient and food group intake by multivariate logistic regression analysis. For multivariable logistic regression model 1, odds ratios were adjusted for sex, age, economic status, educational level, smoking, alcohol drinking frequency, and leisure time physical activity. In addition to covariates included in model 1, the multivariable logistic regression model 2 further adjusted for dietary fiber in each nutrient-based analysis and for both dietary fiber and red meat for each food group-based analysis. Statistical significance for a linear trend of the ORs across the levels of each nutrient and food group intake was tested. For the food group-based analysis, a total of 102 food items were classified into 16 food groups based on nutritional and food cultural similarity. The 16 food groups included cereals (3 food items), potatoes and starches (3 food items), noodles (4 food items), rice cakes (2 food items), bread (5 food items), mixed food (5 food items), legumes and nuts (5 food items), red meat (7 food items), fish (15 food items), poultry (2 food items), milk and dairy products (3 food items), vegetables (25 food items), seaweeds (2 food items), fruits (12 food items), fats and sugars (4 food items), and beverages (4 food items). A p value < 0.05 was considered to indicate statistical significance.

Results

Comparison of general characteristics between cases and controls

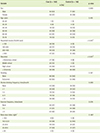
Comparison of general characteristics between the case and control group is presented in Table 1. While there was no difference in sex and age distribution between two groups, economic status and education levels were different. For economic status, the proportion of subjects with monthly household income more than \4,000,000 (equivalent to approximately $4,000) was significantly higher in the control group than that of the case group (45% and 31%, respectively, p < 0.001). The proportion of subjects graduated from college or more was higher in the case group than in the control group (59% and 39%, respectively, p < 0.001). Smoking history, frequency of alcohol drinking and regular exercise frequency were not significantly different between the two groups.

Associations between nutrient intake and colorectal cancer incidence

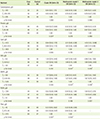
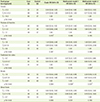
Table 2 presents crude and adjusted odds ratios for colorectal cancer by intake levels of macronutrients. The odds for colorectal cancer incidence was significantly lower among adults who consumed the highest tertile for protein intake than the lowest tertile (ORT3 vs T1 = 0.49, 95% CI: 0.27-0.80, p for trend = 0.031). However, this difference disappeared after adjustment for covariates including sex, age group, household income level, education level, smoking, alcohol drinking frequency, exercise frequency, body mass index level, energy intake level, and dietary fiber intake level. On the other hand, the odds for colorectal cancer incidence were significantly different by intake of total lipid, saturated fatty acids and monounsaturated fatty acids in the multivariable regression model. The odds of colorectal cancer incidence significantly increased as the intake level went up for all three nutrients (total lipids: ORT3 vs T1 = 4.15, 95% CI: 1.33-12.96, p for trend = 0.034, saturated fatty acids: ORT3 vs T1 = 2.96, 95% CI: 1.24-7.04, p for trend = 0.016, monounsaturated fatty acids: ORT3 vs T1 = 3.04, 95% CI: 1.23-7.54, p for trend = 0.018) after adjusting for covariates. For dietary fiber, the odds for colorectal cancer was significantly lower in the highest intake group(ORT3 vs T1 = 0.22, 95% CI: 0.08-0.56, p for trend = 0.002), compared to the lowest tertile group after adjusting for covariates.
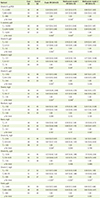
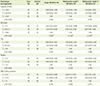
The odds for colorectal cancer incidence by vitamin intake are in Table 3. For vitamin A and β-carotene, the odds for colorectal cancer incidence were significantly lower in the highest tertile intake group than that with the lowest tertile intake group after adjustment of socio-demographic variables and health-related lifestyle factors (vitamin A: ORT3 vs T1 = 0.31, 95% CI: 0.13-0.71, p for trend = 0.036, β-carotene: ORT3 vs T1 = 0.25, 95% CI: 0.11-0.59, p for trend = 0.020). But the significant preventive effect for colorectal cancer incidence was disappeared in both vitamin A and β-carotene after additional adjustment of dietary fiber intake. For vitamin K, odds of colorectal cancer were 69% lower in the highest tertile intake group than the lowest tertile intake group (ORT3 vs T1 = 0.31, 95% CI: 0.17-0.58, p for trend = 0.010) but this difference also disappeared after adjustment for covariates. For thiamin and folic acid, the odds for colorectal cancer incidence were lower in the highest tertile intake group than that with the lowest tertile intake group after adjusting for socio-demographic and health-related lifestyle factors (thiamin: ORT3 vs T1 = 0.18, 95% CI: 0.04-0.76, p for trend = 0.046, folic acid: ORT3 vs T1 = 0.28, 95% CI: 0.11-0.68, p for trend = 0.006), but it became non-significant after adjusting for dietary fiber. For vitamin B, the odds for colorectal cancer incidence were significantly lower in the highest tertile intake group (OR = 0.50, 95% CI: 0.27-0.91, p for trend = 0.028) than the lowest tertile intake group, but it became non-significant after adjusting for covariates. For vitamin C, the odds for colorectal cancer incidence were significantly lower in the highest tertile intake group than the lowest tertile intake group, by 77% after adjustment for sociodemographic variables and health-related lifestyle factors (95% CI: 0.10-0.58, p for trend < 0.001). In addition, the odds for colorectal cancer incidence significantly decreased with increase in vitamin C intake in the analysis including dietary fiber as an additional covariance (p for trend = 0.021).
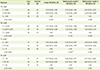
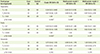
Table 4 shows of the odds of colorectal cancer incidence by mineral intake. There was no association between the odds of colorectal cancer and intake of calcium, sodium and selenium. For iron, the odds of colorectal cancer (OR = 0.34, 95% CI: 0.12-0.97, p for trend = 0.037) were significantly lower in the highest tertile intake group than the lowest tertile intake group in the multivariate model without dietary fiber intake. But the significance disappeared after further adjusting for dietary fiber intake.

Associations between the intake frequency of food groups and colorectal cancer incidence

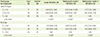
The odds for colorectal cancer incidence by grains and mixed food intake are presented in Table 5. The odds for colorectal cancer incidence increased with higher bread intake (ORT3 vs T1 = 2.26, 95% CI: 0.96-5.33, p for trend = 0.031), whereas it decreased with higher rice cake intake (ORT3 vs T1 = 0.35, 95% CI: 0.14-0.86, p for trend = 0.024). Colorectal cancer incidence was not associated with intake of cereals, potatoes and starches, noodles, and mixed foods in the multivariable logistic regression model.
The odds for colorectal cancer incidence by intake frequency of meat · fish · eggs · legumes and milk · dairy products are presented in Table 6. No association of colorectal cancer incidence with legumes and nuts, fish, and poultry was found. The odds of colorectal cancer incidence were greater in the highest tertile red meat intake group than that with the lowest tertile red meat intake group after adjusting for socio-demographic variables, health-related lifestyle factors and dietary fiber (OR = 7.33, 95% CI: 2.98-18.06, p for trend < 0.001). Milk and dairy products showed no association with colorectal cancer incidence in unadjusted analysis. Although the frequency of milk and dairy products tended to be associated with the colorectal cancer incidence in the multivariable logistic model, it did not reach at statistical significance (OR: 2.42, 95% CI: 1.10-5.31, p for trend = 0.071).
Table 7 presents the odds for colorectal cancer incidence by intake frequency of vegetables, fruits, and seaweeds. The odds for colorectal cancer were lower in the highest tertile vegetable intake group than those with the lowest tertile intake after adjusting for socio-demographic variables, health-related life-style factors and energy intake (ORT3 vs T1 = 0.40, 95% CI: 0.17-0.78, p for trend = 0.008), but this significant difference disappeared in the model after further adjusting for dietary fiber and red meat. Regarding fruits, the odds for colorectal cancer were significantly lower, by 51%, in the group with the highest intake tertile than that with lowest intake tertile (95% CI: 0.27-0.89, p for trend = 0.035). However, it failed to show statistical significance after adjustment for covariates.
The odds for colorectal cancer were significantly different between the group with highest intake of lipids & sugars and beverage and that with the lowest intake in the results from the multiple regression model analysis (Table 8). The odds for colorectal cancer increased when the intake increased for both food groups. The odds for colorectal cancer in the group with the highest intake were 3.2 time significantly higher than that with the lowest intake (95% CI: 1.35-7.48, p for trend = 0.002) for lipids & sugars, and 2.5 time significantly higher in case of beverage (95% CI: 1.12-5.64, p for trend = 0.025).

Discussion

Dietary factors have been considered to play an important role in the occurrence of colorectal cancer [9]. Additionally, differences in dietary factors seem to contribute to the variation of cancer incidence between countries [10]. Although numerous studies on colorectal cancer-related dietary factors have been conducted worldwide, there are only a few studies on this issue in Korea. Therefore, we aimed to examine associations between nutrient and food group intakes and colorectal cancer risk in a case-control study among Korean adults.
This study showed that the odds for colorectal cancer incidence were significantly higher in the group with the highest intake of total lipids and saturated fatty acids, consistent with Levi et al.'s study [11]. However, dietary intervention through low-fat diet for postmenopausal women did not affect the risk of colorectal cancer [12]. Also the current study showed that high intake of monounsaturated fatty acids increased the odds for colorectal cancer incidence and the intake level of polyunsaturated fatty acid was not associated with the colorectal cancer incidence. The results of the series of previous studies on effects of unsaturated fatty acids for colorectal cancer have been inconsistent. A case-control study conducted in Swiss reported the higher intake of unsaturated fatty acids lowered the risk of colorectal cancer [11], and another cohort study [13] reported that intake levels of essential fatty acids were not associated with colorectal cancer risk. Fat intake by Koreans has increased from 16.9g/day in 1969 to 38.8g/day in 2008 [14]. Therefore, longitudinal research is needed on the association between the intake of fat and fatty acid composition ratio and colorectal cancer in order to determine a clear association between fat intake and colorectal cancer with the growing importance of the fat intake among Koreans.
The preventive effects of dietary fiber for colorectal cancer have been consistently suggested. A previous study found that Blacks with low-fat and high fiber diet had lower colorectal cancer mortality rate than Whites with high-fat and low fiber diet [15]. A nested case-control study in the United Kingdom also showed a significantly lower risk of colorectal cancer in the group with high dietary fiber intake compared to those with low dietary fiber intake [16], and the risk of colorectal cancer decreased as whole grain intake increased in males [17]. The meta-analysis result of 16 cohort studies showed that the risk of colorectal cancer decreased by 10% with additional 10 g/day dietary fiber intake [2]. In line with previous studies, we also found dietary fiber intake's preventive effect. The preventive effect of dietary fiber can be explained by biological mechanisms that include increasing amounts of feces, decreasing gastrointestinal transit time, diluting intestinal cancer-causing factors, interfering absorption of those, and lowering intestinal acidity [18]. Considering the Koreans' lower intake of dietary fiber compared to the current Korean dietary reference intake, the importance of dietary fiber needs to be emphasized [19].
In terms of vitamins and minerals, no association with colorectal cancer risk was observed except for vitamin C in this study. A recent large cohort study also found no association between various vitamins and minerals and colorectal cancer risk [13]. A series of epidemiological studies also lacks consistency in the results [2]. In the present study, the odds for colorectal cancer incidence tended to be related to the increase of iron intake in the adjusted logistic regression model including dietary fiber, although it did not show statistical significance. Such a result is consistent with the previous report [2]. Dietary heme iron is assumed to cause colon cancer by inducing excessive abnormal cell proliferation and cell toxins. Heme iron is mainly present in animal tissues and easily absorbed. The role of dietary iron as a risk factor for colon cancer seems to stand out by statistical adjustment for dietary fiber intake which may have partially remove effects of dietary iron from non-animal food sources.
The food group-based analysis showed that high red meat intake increased odds for colorectal cancer incidence, which is consistent with previous studies. A case-control study reported that the higher risk of colorectal cancer in the group with high intake of meat than that with low intake [20]. A study conducted by Cotterchio, et al. [21] and a comprehensive of AICR and WCRF [2] also showed that high intake of red meat raised the risk of colorectal cancer. It has been estimated 15% higher risk of colorectal cancer per 50g/day increase of red meat intake and 43% higher risk per a serving size of red meat consumed in a week. According to the national survey of Korea, meat consumption in Koreans is steadily increasing [14]. Therefore, effort is needed to reduce the consumption of red meats to reduce the risk of colorectal cancer.
Interestingly, we observed a protective role of high consumption of traditional rice cakes while an opposite role of bread food group was shown for colorectal cancer. It is difficult to explain the underlying mechanism of these results. One of possible explanations would be that the food group of rice cakes or breads is a marker of a certain dietary pattern rather than it is an independent factor for colorectal cancer. That is, high intake of rice cake food group may be an indicator for traditional dietary pattern and high intake of bread food group for westernized dietary pattern. Such an assumption warrants future research on associations between dietary patterns and colorectal cancer risk in this population. There have been some interesting studies examining the impact of an overall dietary pattern on colorectal cancer risk. Magalhães et al. [22] observed that westernized diet characterized by high intakes of red meat, processed meats, refined cereals, sugar, potatoes, and alcohol as well as low intakes of vegetable soup, whole grains, milk, and dietary fiber was positively associated with the risk of colorectal cancer. In a case-control study among Koreans that used a total of 6 major dietary patterns, the dietary patterns named as 'well-being style', 'pork and alcohol', 'sweets and coffee', and 'milk and juice' were linked with the risk of colorectal cancer [23]. The authors concluded that the dietary pattern of 'pork and alcohol' and 'sweets and coffee' should be warned for possible high risk for colorectal cancer. Our study found positive associations of intakes of lipids & sugars food group and beverage food group with the colorectal cancer risk, and these results can be interpreted in somewhat similar context with the negative findings for 'pork and alcohol' and 'sweets and coffee' dietary patterns.
This study has some limitations. Recall bias inherent in a case-control study design cannot be ruled out. In addition, there may be some residual confounding by differences in education and economic status between cases and control, though statistical adjustment applied. Despite these limitations, at least a certain level of validity of the study results is expected considering study findings matching with the literature on dietary fiber and red meat intake.

Conclusion

In conclusion, eating a diet high in total lipid, saturated fatty acid and mono-unsaturated fatty acid is associated with higher odds for colorectal cancer incidence, whereas dietary fiber and vitamin C found to lower the odds for colorectal cancer incidence in this study among Korean adults. Interestingly high traditional rice cake consumption is associated inversely with colorectal cancer risk, warranting a future study.

Figures and Tables

Table 1

Comparison of general characteristics between case and control groups

cnr-4-110-i001
Variable Case (n = 150) Control (n = 116) p value
n (%)
Sex 0.809
 Male 94 (63) 71 (61)
 Female 56 (37) 45 (39)
Age, years 0.415
 20-29 1 (1) 1 (1)
 30-39 6 (4) 4 (3)
 40-49 18 (12) 16 (13)
 50-59 45 (30) 42 (36)
 60-69 63 (41) 40 (34)
 70-79 19 (13) 13 (11)
Household income (10,000 won) < 0.001*
 < 100 28 (19) 6 (5)
 100-200 26 (17) 16 (14)
 200-400 49 (33) 41 (36)
 ≥ 400 47 (31) 51 (45)
Education < 0.001*
 ≤ Elementary school 27 (18) 9 (8)
 Middle school 20 (13) 3 (3)
 High school 45 (30) 36 (31)
 ≥ University 58 (39) 68 (59)
Smoking 0.167
 None 68 (45) 63 (54)
 Ex/current 82 (55) 53 (46)
Alcohol drinking frequency, times/month 0.089
 None 43 (29) 38 (35)
 < 1 29 (20) 24 (22)
 1-3 19 (13) 13 (12)
 4-11 19 (13) 21 (19)
 ≥ 12 38 (26) 14 (13)
Exercise frequency, times/week 0.078
 None 56 (37) 44 (38)
 1-3 31 (21) 44 (38)
 ≥ 4 63 (42) 28 (24)
Body mass index, kg/m2 0 .967
 < 18.5 8 (5) 5 (4)
 18.5-22.9 54 (36) 52 (44)
 23-24.9 49 (33) 24 (21)
 25-29.9 37 (25) 31 (27)
 ≥ 30 2 (1) 4 (3)

*p < 0.001.

Table 2

Associations between macronutrients intakes and colorectal cancer incidence

cnr-4-110-i002
Nutrient Case
(n)
Control
(n)
Crude OR (95% CI) Multivariate model 1
OR (95% CI)
Multivariate model 2
OR (95% CI)
Carbohydrate, g/d
 T3 > 370 53 35 0.94 (0.51, 1.71) 0.82 (0.19, 3.55) 0.95 (0.21, 4.25)
 T2 278-370 42 47 0.55 (0.30, 1.00) 0.74 (0.27, 2.04) 0.76 (0.27, 2.15)
 T1 < 278 55 34 1.00 1.00 1.00
  p for trend 1.000 0.814 0.969
Protein, g/d
 T3 > 95 44 45 0.49 (0.27, 0.80) 0.32 (0.10, 1.02) 0.99 (0.23, 4.31)
 T2 65-95 46 41 0.56 (0.31, 1.03) 0.49 (0.19, 1.26) 0.97 (0.31, 3.00)
 T1 < 65 60 30 1.00 1.00 1.00
  p for trend 0.031* 0.079 0.990
Lipid, g/d
 T3 > 41.5 49 39 0.94 (0.52, 1.70) 2.31 (0.83, 6.38) 4.15 (1.33, 12.96)
 T2 28.5-41.5 50 39 0.96 (0.53, 1.73) 1.83 (0.82, 4.09) 2.85 (1.17, 6.95)
 T1 < 28.5 51 38 1.00 1.00 1.00
  p for trend 0.836 0.155 0.034*
SFA, g/d
 T3 > 8.2 54 34 1.35 (0.74, 2.45) 2.47 (1.09, 5.61) 2.96 (1.24, 7.04)
 T2 4.8-8.2 49 40 1.07 (0.59, 1.93) 1.48 (0.72, 3.05) 1.69 (0.80, 3.60)
 T1 < 4.8 47 41 1.00 1.00 1.00
  p for trend 0.310 0.031* 0.016*
MUFA, g/d
 T3 > 9.6 53 36 1.17 (0.65, 2.13) 2.38 (1.01, 5.61) 3.04 (1.23, 7.54)
 T2 5.45-9.6 48 41 0.93 (0.52, 1.69) 1.27 (0.61, 2.65) 1.67 (0.76, 3.67)
 T1 < 5.45 41 39 1.00 1.00 1.00
  p for trend 0.535 0.037* 0.018*
PUFA, g/d
 T3 > 7.05 44 43 0.52 (0.28, 0.96) 0.54 (0.22, 1.33) 1.00 (0.37, 2.75)
 T2 4.1-7.05 47 43 0.56 (0.30, 1.02) 0.75 (0.34, 1.66) 1.10 (0.47, 2.59)
 T1 < 4.1 59 30 1.00 1.00 1.00
  p for trend 0.062 0.188 0.937
Fiber, g/d
 T3 > 45 38 49 0.33 (0.18, 0.62) 0.22 (0.08, 0.56)
 T2 27.5-45 49 40 0.53 (0.28, 0.97) 0.50 (0.22, 1.12) -
 T1 < 27.5 63 27 1.00 1.00
  p for trend 0.001 0.002

Multivariate model 1 OR (95% CI): Adjusted for energy intake (in kcal/d; < 1,620, 1,620-2,250, or ≥ 2,250), sex (male, female), age (in year; 20-29, 30-39, 40-49, 50-59, 60-69, or 70-79), household income (in 10,000won; < 100, 100-200, 200-400, or ≥ 400), education (≤ elementary school, middle school, high school, ≥ university), smoking (none, ex/current), alcohol drinking frequency (in times/month; none, < 1, 1-3, 4-11, or ≥ 12), exercise frequency (in times/week; none, 1-3, or ≥ 4), BMI (in kg/m2; < 18.5, 18.5-22.9, 23-24.9, 25-29.9, or ≥ 30), Multivariate model 2 OR (95% CI): Adjusted for the variables included in the model 1 and dietary fiber (in g/d; < 27.5, 27.5-45, or > 45).

SFA: saturated fatty acid, MUFA: monounsaturated fatty acid, PUFA: polyunsaturated fatty acid, OR: odds ratios, CI: confidence intervals.

*p < 0.05; p < 0.01.

Table 3

Associations between vitamin intakes and colorectal cancer incidence

cnr-4-110-i003
Nutrient Case
(n)
Control
(n)
Crude OR (95%CI) Multivariate model 1
OR (95% CI)
Multivariate model 2
OR (95% CI)
Vitamin A, µg RE/d
 T3 > 2,300 42 48 0.30 (0.16, 0.57) 0.31 (0.13, 0.71) 0.99 (0.27, 3.63)
 T2 885-2,300 43 45 0.35 (0.19, 0.64) 0.41 (0.19, 0.86) 0.52 (0.23, 1.20)
 T1 < 885 65 23 1.00 1.00 1.00
  p for trend 0.005 0.036* 0.560
β-carotene, µg/d
 T3 > 12,000 40 49 0.27 (0.14, 0.51) 0.25 (0.11, 0.59) 0.56 (0.17, 1.87)
 T2 4,250-12,000 43 45 0.31 (0.17, 0.59) 0.32 (0.15, 0.70) 0.38 (0.16, 0.91)
 T1 < 4,250 67 22 1.00 1.00 1.00
  p for trend 0.002 0.020* 0.977
Vitamin D, µg/d
 T3 > 5.9 42 48 0.61 (0.34, 1.10) 0.76 (0.37, 1.58) 0.79 (0.37, 1.67)
 T2 3.2-5.9 56 32 1.21 (0.66, 2.22) 1.63 (0.81, 3.28) 1.71 (0.83, 3.50)
 T1 < 3.2 52 36 1.00 1.00 1.00
  p for trend 0.042* 0.252 0.305
Vitamin E, mg/d
 T3 > 17.7 43 46 0.45 (0.25, 0.83) 0.45 (0.18, 1.15) 2.77 (0.61, 12.56)
 T2 10-17.7 47 41 0.55 (0.30, 1.02) 0.58 (0.25, 1.38) 1.22 (0.40, 3.72)
 T1 < 10 60 29 1.00 1.00 1.00
  p for trend 0.057 0.247 0.133
Vitamin K, µg/d
 T3 > 1,150 42 48 0.31 (0.17, 0.58) 0.30 (0.13, 0.68) 0.67 (0.21, 2.17)
 T2 344-1,150 43 45 0.34 (0.18, 0.64) 0.30 (0.14, 0.66) 0.36 (0.15, 0.89)
 T1 < 344 65 23 1.00 1.00 1.00
  p for trend 0.010* 0.095 0.435
Thiamin, mg/d
 T3 > 1.7 46 44 0.48 (0.261, 0.88) 0.18 (0.04, 0.76) 0.62 (0.10, 3.77)
 T2 1.18-1.7 43 44 0.45 (0.24, 0.83) 0.31 (0.10, 0.98) 0.62 (0.16, 2.36)
 T1 < 1.18 61 28 1.00 1.00 1.00
  p for trend 0.037* 0.046* 0.816
Riboflavin, mg/d
 T3 > 1.92 45 45 0.60 (0.33, 1.09) 0.76 (0.30, 1.89) 5.30 (1.32, 21.26)
 T2 1.13-1.92 50 38 0.79 (0.43, 1.44) 1.32 (0.50, 2.03) 4.21 (1.42, 12.47)
 T1 < 1.92 55 33 1.00 1.00 1.00
  p for trend 0.099 0.312 0.125
Niacin, mg/d
 T3 > 21 46 42 0.56 (0.30, 1.02) 0.39 (0.12, 1.28) 1.15 (0.28, 4.73)
 T2 14.1-21 45 44 0.52 (0.28, 0.95) 0.68 (0.27, 1.70) 1.39 (0.47, 4.07)
 T1 < 14.1 59 30 1.00 1.00 1.00
  p for trend 0.107 0.117 0.927
Vitamin B6, mg/d
 T3 > 2.45 43 46 0.50 (0.27, 0.91) 0.33 (0.11, 1.05) 1.61 (0.31, 8.48)
 T2 1.63-2.45 49 39 0.67 (0.37, 1.23) 0.60 (0.24, 1.53) 1.62 (0.44, 6.02)
 T1 < 1.63 58 31 1.00 1.00 1.00
  p for trend 0.028* 0.059 0.799
Vitamin B12, µg/d
 T3 ≥ 12.05 44 45 0.73 (0.40, 1.32) 0.87 (0.40, 1.89) 1.11 (0.48, 2.56)
 T2 7.35-12.05 55 33 1.24 (0.68, 2.27) 1.53 (0.75, 3.11) 1.66 (0.79, 3.49)
 T1 < 7.35 51 38 1.00 1.00 1.00
  p for trend 0.177 0.458 0.889
Vitamin C, mg/d
 T3 > 170 37 52 0.31 (0.17, 0.58) 0.23 (0.10, 0.58) 0.38 (0.14, 1.05)
 T2 108-170 51 37 0.60 (0.32, 1.12) 0.87 (0.40, 1.88) 1.10 (0.46, 2.60)
 T1 < 108 62 27 1.00 1.00 1.00
  p for trend < 0.001 < 0.001 0.021*
Folate, µg/d
 T3 > 1,065 39 50 0.32 (0.17, 0.60) 0.28 (0.11, 0.68) 0.90 (0.17, 4.68)
 T2 665-1,065 48 40 0.50 (0.27, 0.92) 0.55 (0.25, 1.21) 0.83 (0.28, 2.47)
 T1 < 665 63 26 1.00 1.00 1.00
  p for trend < 0.001 0.006 0.951

Multivariate model 1 OR (95% CI): Adjusted for energy intake(in kcal/d; < 1,620, 1,620-2,250, or ≥ 2,250), sex (male, female), age (in year;20-29, 30-39, 40-49, 50-59, 60-69, or 70-79), household income (in 10,000 won; < 100, 100-200, 200-400, or ≥ 400), education (≤ elementary school, middle school, high school, ≥university), smoking (none, ex/current), alcohol drinking frequency (in times/month; none, < 1, 1-3, 4-11, or ≥ 12), exercise frequency (in times/week; none, 1-3, or ≥ 4), BMI (in kg/m2; < 18.5, 18.5-22.9, 23-24.9, 25-29.9, or ≥ 30), Multivariate model 2 OR (95% CI): Adjusted for the variables included in the model 1 and dietary fiber(in g/d; < 27.5, 27.5-45, or > 45).

RE: retinol equivalents, OR: odds ratios, CI: confidence intervals.

*p < 0.05; p < 0.01; p < 0.001.

Table 4

Associations between mineral intakes and colorectal cancer incidence

cnr-4-110-i004
Nutrient Case
(n)
Control
(n)
Crude OR (95% CI) Multivariate model 1
OR (95% CI)
Multivariate model 2
OR (95% CI)
Ca, mg/d
 T3 > 850 46 42 0.70 (0.38, 1.26) 0.73 (0.29, 1.81) 2.40 (0.76, 7.67)
 T2 540-850 49 39 0.80 (0.44, 1.45) 1.16 (0.55, 2.48) 2.36 (0.94, 5.89)
 T1 < 540 55 35 1.00 1.00 1.00
  p for trend 0.253 0.392 0.266
Na, mg/d
 T3 > 5,330 44 44 0.71 (0.39, 1.29) 0.72 (0.32, 1.64) 0.95 (0.39, 2.32)
 T2 3,500-5,330 54 35 1.90 (0.60, 2.00) 1.33 (0.63, 2.79) 1.46 (0.66, 3.21)
 T1 < 3,500 52 37 1.00 1.00 1.00
  p for trend 0.234 0.115 0.205
Fe, mg/d
 T3 > 26.1 41 47 0.45 (0.25, 0.83) 0.34 (0.12, 0.97) 2.39 (0.39, 14.60)
 T2 17-26.1 51 39 0.68 (0.37, 1.24) 0.64 (0.25, 1.67) 1.84 (0.45, 7.54)
 T1 < 17 58 30 1.00 1.00 1.00
  p for trend 0.012* 0.037* 0.483
Se, µg/d
 T3 > 110 51 37 0.77 (0.42, 1.42) 0.62 (0.18, 2.17) 0.77 (0.21, 2.83)
 T2 78-110 42 47 0.50 (0.28, 0.92) 0.57 (0.21, 1.56) 0.62 (0.22, 1.73)
 T1 < 78 57 32 1.00 1.00 1.00
  p for trend 0.563 0.643 0.915

Multivariate model 1 OR (95% CI): Adjusted for energy intake (in kcal/d; < 1,620, 1,620-2,250, or ≥ 2,250), sex (male, female), age (in year; 20-29, 30-39, 40-49, 50-59, 60-69, or 70-79), household income (in 10,000 won; < 100, 100-200, 200-400, or ≥ 400), education (≤ elementary school, middle school, high school, ≥ university), smoking (none, ex/current), alcohol drinking frequency (in times/month; none, < 1, 1-3, 4-11, or ≥ 12), exercise frequency (in times/week; none, 1-3, or ≥ 4), BMI (in kg/m2; < 18.5, 18.5-22.9, 23-24.9, 25-29.9, or ≥ 30), Multivariate model 2 OR (95% CI): Adjusted for the variables included in the model 1 and dietary fiber (in g/d; < 27.5, 27.5-45, or > 45)

OR: odds ratios, CI: confidence intervals.

*p < 0.05.

Table 5

Associations between intakes of grains and mixed foods and colorectal cancer incidence

cnr-4-110-i005
Food group
(serving/week)
Case
(n)
Control
(n)
Crude OR (95% CI) Multivariate model 1
OR (95% CI)
Multivariate model 2
OR (95% CI)
Cereals
 T3 > 21.2 22 23 0.59 (0.29, 1.20) 0.44 (0.18, 1.08) 0.60 (0.23, 1.55)
 T2 14.3-21.2 68 56 0.75 (0.44, 1.29) 0.64 (0.34, 1.22) 0.77 (0.38, 1.55)
 T1 < 14.3 60 37 1.00 1.00 1.00
  p for trend 0.143 0.070 0.303
Potatoes & Starches
 T3 > 2.1 40 50 0.60 (0.33, 1.10) 0.75 (0.37, 1.54) 0.76 (0.35, 1.64)
 T2 1.1-2.1 61 29 1.59 (0.86, 2.94) 2.17 (1.05, 4.49) 1.68 (0.76, 3.70)
 T1 < 1.1 49 37 1.00 1.00 1.00
  p for trend 0.015* 0.086 0.185
Noodles
 T3 > 1.8 50 32 1.24 (0.68, 2.26) 1.93 (0.93, 4.03) 1.28 (0.57, 2.83)
 T2 0.6-1.8 47 42 0.89 (0.50, 1.59) 1.08 (0.54, 2.18) 1.20 (0.56, 2.59)
 T1 < 0.6 53 42 1.00 1.00 1.00
  p for trend 0.387 0.060 0.588
Traditional rice cakes
 T3 > 0.7 46 41 0.60 (0.31, 1.17) 0.47 (0.21, 1.07) 0.35 (0.14, 0.86)
 T2 0.23-0.7 63 53 0.64 (0.34, 1.20) 0.66 (0.31, 1.40) 0.66 (0.29, 1.49)
 T1 < 0.23 41 22 1.00 1.00 1.00
  p for trend 0.315 0.112 0.024*
Breads
 T3 > 1.9 59 32 1.54 (0.84, 2.80) 2.75 (1.26, 5.99) 2.26 (0.96, 5.33)
 T2 0.47-1.9 43 44 0.81 (0.45, 1.48) 1.15 (0.56, 2.36) 0.97 (0.44, 2.10)
 T1 < 0.47 48 40 1.00 1.00 1.00
  p for trend 0.064 0.006 0.031*
Mixed foods
 T3 < 1.735 51 41 0.82 (0.45, 1.50) 1.03 (0.50, 2.10) 0.55 (0.24, 1.26)
 T2 0.7-1.735 49 42 0.77 (0.42, 1.41) 0.99 (0.50, 1.97) 0.76 (0.35, 1.64)
 T1 < 0.7 50 33 1.00 1.00 1.00
  p for trend 0.666 0.931 0.168

Multivariate model 1 OR (95% CI): Adjusted for energy intake (in kcal/d; < 1,620, 1,620-2,250, or ≥ 2,250), sex (male, female), age (in year; 20-29, 30-39, 40-49, 50-59, 60-69, or 70-79), household income (in 10,000 won; < 100, 100-200, 200-400, or ≥ 400), education (≤ elementary school, middle school, high school, ≥ university), smoking (none, ex/current), alcohol drinking frequency (in times/month; none, < 1, 1-3, 4-11, or ≥ 12), exercise frequency (in times/week; none, 1-3, or ≥ 4), BMI (in kg/m2; < 18.5, 18.5-22.9, 23-24.9, 25-29.9, or ≥ 30), Multivariate model 2 OR (95% CI): Adjusted for the variables included in the model 1 and dietary fiber (in g/d; < 27.5, 27.5-45, or > 45) and red meat (in serving/week; < 0.93, 0.93-2.7, or > 2.7).

OR: odds ratios, CI: confidence intervals.

*p < 0.05; p < 0.01.

Table 6

Associations between intakes of meat·fish·eggs·beans and milk·dairy products and colorectal cancer incidence

cnr-4-110-i006
Food group
(serving/week)
Case
(n)
Control
(n)
Crude OR (95% CI) Multivariate model 1
OR (95% CI)
Multivariate model 2
OR (95% CI)
Legumes & Nuts
 T3 > 10.9 47 42 0.80 (0.45, 1.45) 1.12 (0.54, 2.32) 1.35 (0.61, 3.01)
 T2 5.24-10.9 50 36 1.00 (0.55, 1.81) 1.08 (0.54, 2.16) 1.32 (0.62, 2.84)
 T1 < 5.24 53 38 1.00 1.00 1.00
  p for trend 0.424 0.773 0.519
Red meat
 T3 > 2.7 59 31 2.62 (1.43, 4.81) 7.41 (3.07, 17.88) 7.33 (2.98, 18.06)
 T2 0.93-2.7 54 34 2.19 (1.20, 4.00) 3.56 (1.67, 7.58) 3.64 (1.67, 7.94)
 T1 < 0.93 37 51 1.00 1.00 1.00
  p for trend 0.007* < 0 .001 < 0.001
Fish
 T3 > 10.3 47 41 0.85 (0.47, 1.55) 1.05 (0.50, 2.17) 1.05 (0.45, 2.40)
 T2 5.8-10.3 52 37 1.05 (0.58, 1.90) 1.17 (0.58, 2.33) 1.53 (0.70, 3.32)
 T1 < 5.8 51 38 1.00 1.00 1.00
  p for trend 0.541 0.969 0.869
Poultry
 T3 < 3.3 53 43 0.90 (0.50, 1.65) 1.55 (0.75, 3.21) 1.46 (0.66, 3.22)
 T2 1.5-3.3 52 40 0.95 (0.52, 1.75) 1.76 (0.84, 3.71) 1.40 (0.62, 3.14)
 T1 < 1.5 45 33 1.00 1.00 1.00
  p for trend 0.746 0.435 0.442
Milk & Dairy products
 T3 > 5.3 55 35 1.65 (0.91, 2.98) 2.29 (1.11, 4.75) 2.42 (1.10, 5.31)
 T2 1.1-5.3 52 36 1.51 (0.83, 2.74) 2.15 (1.06, 4.37) 1.98 (0.92, 4.24)
 T1 < 1.1 43 45 1.00 1.00 1.00
  p for trend 0.181 0.092 0.071

Multivariate model 1 OR (95% CI): Adjusted for energy intake (in kcal/d; < 1,620, 1,620-2,250, or ≥ 2,250), sex (male, female), age (in year; 20-29, 30-39, 40-49, 50-59, 60-69, or 70-79), household income (in 10,000 won; < 100, 100-200, 200-400, or ≥ 400), education (≤ elementary school, middle school, high school, ≥ university), smoking (none, ex/current), alcohol drinking frequency (in times/month; none, < 1, 1-3, 4-11, or ≥ 12), exercise frequency (in times/week; none, 1-3, or ≥ 4), BMI (in kg/m2; < 18.5, 18.5-22.9, 23-24.9, 25-29.9, or ≥ 30), Multivariate model 2 OR (95% CI): Adjusted for the variables included in the model 1 and dietary fiber (in g/d; < 27.5, 27.5-45, or > 45) and red meat (in serving/week; < 0.93, 0.93-2.7, or > 2.7).

OR: odds ratios, CI: confidence intervals.

*p < 0.01; p < 0.001.

Table 7

Associations between intakes of fruits, vegetables, and seaweeds and colorectal cancer incidence

cnr-4-110-i007
Food group
(serving/week)
Case
(n)
Control
(n)
Crude OR (95% CI) Multivariate model 1
OR (95% CI)
Multivariate model 2
OR (95% CI)
Vegetables
 T3 > 52 39 50 0.38 (0.21, 0.69) 0.40 (0.17, 0.78) 0.54 (0.23, 1.28)
 T2 34.8-52 51 37 0.67 (0.36, 1.23) 0.69 (0.33, 1.42) 0.97 (0.43, 2.19)
 T1 < 34.8 60 29 1.00 1.00 1.00
  p for trend 0.002 0.008 0.114
Fruits
 T3 > 9.7 43 45 0.49 (0.27, 0.89) 0.58 (0.27, 1.26) 0.62 (0.27, 1.42)
 T2 4.505-9.7 48 41 0.60 (0.33, 1.09) 0.69 (0.33, 1.45) 0.62 (0.28, 1.41)
 T1 < 4.505 59 30 1.00 1.00 1.00
  p for trend 0.035* 0.221 0.377
Seaweeds
 T3 > 6.5 51 40 0.75 (0.42, 1.35) 0.88 (0.44, 1.74) 1.28 (0.60, 2.74)
 T2 3.5-6.5 38 40 0.56 (0.31, 1.03) 0.73 (0.37, 1.47) 1.24 (0.56, 2.71)
 T1< 3.5 61 36 1.00 1.00 1.00
  p for trend 0.542 0.837 0.575

Multivariate model 1 OR (95% CI): Adjusted for energy intake (in kcal/d; < 1,620, 1,620-2,250, or ≥ 2,250), sex (male, female), age (in year; 20-29, 30-39, 40-49, 50-59, 60-69, or 70-79), household income (in 10,000 won; < 100, 100-200, 200-400, or ≥ 400), education (≤ elementary school, middle school, high school, ≥ university), smoking (none, ex/current), alcohol drinking frequency (in times/month; none, < 1, 1-3, 4-11, or ≥ 12), exercise frequency (in times/week; none, 1-3, or ≥ 4), BMI (in kg/m2; < 18.5, 18.5-22.9, 23-24.9, 25-29.9, or ≥ 30), Multivariate model 2 OR (95% CI): Adjusted for the variables included in the model 1 and dietary fiber (in g/d; < 27.5, 27.5-45, or > 45) and red meat (in serving/week; < 0.93, 0.93-2.7, or > 2.7).

OR: odds ratios, CI: confidence intervals.

*p < 0.05; p < 0.01

Table 8

Associations between intakes of lipids & sugars and beverage and colorectal cancer incidence

cnr-4-110-i008
Food group
(serving/week)
Case
(n)
Control
(n)
Crude OR (95% CI) Multivariate model 1
OR (95% CI)
Multivariate model 2
OR (95% CI)
Lipids & Sugars
 T3 > 11.5 71 20 4.08 (2.13, 7.84) 5.52 (2.48, 12.29) 3.17 (1.35, 7.48)
 T2 2.6-11.5 39 50 0.90 (0.49, 1.63) 0.95 (0.47, 1.93) 0.61 (0.28, 1.35)
 T1 < 2.6 40 46 1.00 1.00 1.00
  p for trend < 0.001 < 0.001 0.002
Beverage
 T3 > 12.8 53 34 1.70 (0.94, 3.10) 2.38 (1.14, 4.97) 2.51 (1.12, 5.64)
 T2 10.2-12.8 54 35 1.69 (0.93, 3.05) 2.07 (1.02, 4.19) 1.43 (0.66, 3.07)
 T1 < 10.2 43 47 1.00 1.00 1.00
  p for trend 0.095 0.025* 0.025*

Multivariate model 1 OR (95% CI): Adjusted for energy intake (in kcal/d; < 1,620, 1,620-2,250, or ≥ 2,250), sex (male, female), age (in year; 20-29, 30-39, 40-49, 50-59, 60-69, or 70-79), household income (in 10,000 won; < 100, 100-200, 200-400, or ≥ 400), education (≤ elementary school, middle school, high school, ≥ university), smoking (none, ex/current), alcohol drinking frequency (in times/month; none, < 1, 1-3, 4-11, or ≥ 12), exercise frequency (in times/week; none, 1-3, or ≥ 4), BMI (in kg/m2; < 18.5, 18.5-22.9, 23-24.9, 25-29.9, or ≥ 30), Multivariate model 2 OR (95% CI): Adjusted for the variables included in the model 1 and dietary fiber (in g/d; < 27.5, 27.5-45, or > 45) and red meat (in serving/week; < 0.93, 0.93-2.7, or > 2.7).

OR: odds ratios, CI: confidence intervals.

*p < 0.05; p < 0.01; p < 0.001.

Notes

Conflict of interest No conflict interests were declared by any of the authors.

References

1. Ministry of Health and Welfare (KR). Korea Central Cancer Registry. National Cancer Center (KR). Annual report of cancer statistics in Korea in 2012 [Internet]. 2015. cited 2015 April 1. Available fromhttp://ncc.re.kr/manage/manage03_033_list.jsp.
2. World Cancer Research Fund (GB). American Institute for Cancer Research. Food, nutrition, physical activity, and the prevention of cancer: a global perspective. Washington, D.C.: American Institute for Cancer Research;2007.
3. Kim J, Kim DH, Lee BH, Kang SH, Lee HJ, Lim SY, Suh YK, Ahn YO. Folate intake and the risk of colorectal cancer in a Korean population. Eur J Clin Nutr. 2009; 63:1057–1064.
crossref
4. Kim J, Cho YA, Kim DH, Lee BH, Hwang DY, Jeong J, Lee HJ, Matsuo K, Tajima K, Ahn YO. Dietary intake of folate and alcohol, MTHFR C677T polymorphism, and colorectal cancer risk in Korea. Am J Clin Nutr. 2012; 95:405–412.
crossref
5. Oh SY, Lee JH, Kim HJ. Analyses on the associations of dietary patterns with colon cancer risk. Korean J Nutr. 2004; 37:550–556.
6. Ministry of Health and Welfare. Korea Centers for Disease Control and Prevention. Korea National Health and Nutrition Examination Survey form [Internet]. 2013. cited 2014 April 20. Available fromhttps://knhanes.cdc.go.kr/knhanes/index.do.
7. Ahn Y, Lee JE, Paik HY, Lee HK, Jo I, Kimm K. Development of a semiquantitative food frequency questionnaire based on dietary data from the Korea national health and nutrition examination survey. Nutr Sci. 2003; 6:173–184.
8. Ahn Y, Lee JE, Cho NH, Shin C, Park C, Oh BS, Kimm K. Validation and calibration of semi-quantitative food frequency questionnaire: with participants of the Korean health and genome study. Korean J Community Nutr. 2004; 9:173–182.
9. Norat T, Aune D, Chan D, Romaguera D. Fruits and vegetables: updating the epidemiologic evidence for the WCRF/AICR lifestyle recommendations for cancer prevention. Cancer Treat Res. 2014; 159:35–50.
crossref
10. Armstrong B, Doll R. Environmental factors and cancer incidence and mortality in different countries, with special reference to dietary practices. Int J Cancer. 1975; 15:617–631.
crossref
11. Levi F, Pasche C, Lucchini F, La Vecchia C. Macronutrients and colorectal cancer: a Swiss case-control study. Ann Oncol. 2002; 13:369–373.
crossref
12. Beresford SA, Johnson KC, Ritenbaugh C, Lasser NL, Snetselaar LG, Black HR, Anderson GL, Assaf AR, Bassford T, Bowen D, Brunner RL, Brzyski RG, Caan B, Chlebowski RT, Gass M, Harrigan RC, Hays J, Heber D, Heiss G, Hendrix SL, Howard BV, Hsia J, Hubbell FA, Jackson RD, Kotchen JM, Kuller LH, LaCroix AZ, Lane DS, Langer RD, Lewis CE, Manson JE, Margolis KL, Mossavar-Rahmani Y, Ockene JK, Parker LM, Perri MG, Phillips L, Prentice RL, Robbins J, Rossouw JE, Sarto GE, Stefanick ML, Van Horn L, Vitolins MZ, Wactawski-Wende J, Wallace RB, Whitlock E. Low-fat dietary pattern and risk of colorectal cancer: the Women's Health Initiative Randomized Controlled Dietary Modification Trial. JAMA. 2006; 295:643–654.
crossref
13. Key TJ, Appleby PN, Masset G, Brunner EJ, Cade JE, Greenwood DC, Stephen AM, Kuh D, Bhaniani A, Powell N, Khaw KT. Vitamins, minerals, essential fatty acids and colorectal cancer risk in the United Kingdom Dietary Cohort Consortium. Int J Cancer. 2012; 131:E320–E325.
crossref
14. Ministry of Health and Welfare. Korea Centers for Disease Control and Prevention. Korea Health Statistics 2008: Korea National Health and Nutrition Examination Survey (KNHANES IV-2) [Internet]. 2009. cited 2014 April 20. Available fromhttps://knhanes.cdc.go.kr/knhanes/index.do.
15. Burkitt DP. Epidemiology of cancer of the colon and rectum. 1971. Dis Colon Rectum. 1993; 36:1071–1082.
16. Dahm CC, Keogh RH, Spencer EA, Greenwood DC, Key TJ, Fentiman IS, Shipley MJ, Brunner EJ, Cade JE, Burley VJ, Mishra G, Stephen AM, Kuh D, White IR, Luben R, Lentjes MA, Khaw KT, Rodwell Bingham SA. Dietary fiber and colorectal cancer risk: a nested case-control study using food diaries. J Natl Cancer Inst. 2010; 102:614–626.
crossref
17. Egeberg R, Olsen A, Loft S, Christensen J, Johnsen NF, Overvad K, Tjønneland A. Intake of wholegrain products and risk of colorectal cancers in the Diet, Cancer and Health cohort study. Br J Cancer. 2010; 103:730–734.
crossref
18. Lupton JR, Turner ND. Potential protective mechanisms of wheat bran fiber. Am J Med. 1999; 106:24S–27S.
crossref
19. Lee HJ, Kim YA, Lee HS. Annual changes in the estimated dietary fiber intake of Korean during 1991~2001. Korean J Nutr. 2006; 39:549–559.
20. Austin GL, Adair LS, Galanko JA, Martin CF, Satia JA, Sandler RS. A diet high in fruits and low in meats reduces the risk of colorectal adenomas. J Nutr. 2007; 137:999–1004.
crossref
21. Cotterchio M, Boucher BA, Manno M, Gallinger S, Okey AB, Harper PA. Red meat intake, doneness, polymorphisms in genes that encode carcinogen-metabolizing enzymes, and colorectal cancer risk. Cancer Epidemiol Biomarkers Prev. 2008; 17:3098–3107.
crossref
22. Magalhães B, Bastos J, Lunet N. Dietary patterns and colorectal cancer: a case-control study from Portugal. Eur J Cancer Prev. 2011; 20:389–395.
23. Oh SY, Lee JH, Kim HJ. Analyses on the associations of dietary patterns with colon cancer risk. Korean J Nutr. 2004; 37:550–556.
TOOLS
Similar articles