

 PDF
PDF ePub
ePub Citation
 Print
Print


Introduction
Metabolic syndrome (MetS) describes the clustering of abdominal obesity, lipid abnormalities, hypertension, and hyperglycemia. It is a strong independent contributor to the onset of type 2 diabetes and cardiovascular disease (CVD). The prevalence of MetS is 20-30% among adult populations in most countries [1], and it appears to correlate with the sharp increase in the incidence of metabolic diseases. Therefore, the identification of subjects with MetS and the importance of early effective intervention based on appropriate biomarkers have been emphasized.
Current evidence has shown that obesity plays a central role in the development of MetS, and significantly contributes to the further development of metabolic diseases [2]. The pathogenesis model disclosed that MetS is associated with metabolic stresses as a consequence of adipose cell enlargement and the associated changes in circulating inflammatory cytokine and adipokines [3]. Obesity-related chronic or low-grade systemic inflammation is considered to be a common in both insulin resistance and atherogenesis [4] which promotes the development of type 2 diabetes and atherosclerosis [5].
Adipokines are cytokines mainly produced by the adipose tissue. Leptin, adiponectin, resistin and visfatin are known to contribute to inflammatory responses [6]. Adiponectin inhibits the nuclear factor-κB (NF-κB)-dependent synthesis of tumor-necrosis factor (TNF) and interferon-γ (IFNγ), and induces the production of interleukin-10 (IL-10) and IL-1 receptor antagonist (IL-1RA) [7]. Leptin signals to induce activation of the mitogen-activated protein kinases (MAPKs) p38 and extracellular-signal-regulated kinase (ERK), and induces the production of nitric-oxide synthase 2 (NOS2) and reactive oxygen species (ROS) [8]. Adiponectin induces apoptosis of monocytes and inhibits phagocytosis by macrophages, whereas leptin enhances macrophage phagocytosis and induces the activation, proliferation and migration of monocytes [6,7].
Biomarkers of systemic inflammation other than adipokines include pro-inflammatory cytokines and chemokines which have been suggested to be closely related to excess adipose tissue accumulation [9]. TNF-α which can initiate both acute and chronic inflammation increases production of IL-6 and monocyte chemoattractant protein 1 (MCP1), and facilitates endothelial dysfunction [10]. MCP1, a mediator for T lymphocyte recruitment and monocyte trafficking, is increased by leptin, obesity, and insulin-resistance-inducing hormones [11]. Also, cellular adhesion molecules (CAMs) mediate adhesion of circulating leukocytes to endothelial cells, promoting subsequent transendothelial migration [12].
Nevertheless, few studies have evaluated adipokines, inflammatory cytokines and chemokines for their sensitivity to reflect MetS components. Therefore, we analyzed major adipose tissue-derived cytokines and chemokines, and determined the degree of association with MetS components. Abdominal computed tomography data was also generated to establish the association of blood marker with tomography measures. The identification of sensitive biomarkers is important for setting relevant targets for early nutritional and pharmacological intervention.
Materials and Methods
Study subjects
The study involved 199 subjects (108 men and 91 women). Data were collected cross-sectionally between August 2008 and March 2010. The participants were recruited from the outpatient clinic of the Department of Family Medicine at Seoul St. Mary's Hospital, Uijeongbu St. Mary's Hospital and St. Vincent's Hospital in South Korea. None of the participants had been diagnosed with cardiovascular disease, infectious diseases, diseases of the liver, thyroid or kidney, malignancy, acromegaly, Cushing syndrome, or any other serious medical problems. Volunteers who were taking systemic glucocorticoids, blood glucose lowering medications (eg, metformin, thiazolidinediones), anti-inflammatory medications, and immunosuppressant drugs were also excluded. The study protocol was approved by the Institutional Review Board (IRB) of the Seoul and Uijeongbu St. Mary's Hospital and St. Vincent's Hospital (IRB No. KCMC08BR048). Informed consent was confirmed by the IRB. Written and informed consents were individually obtained from all the participants prior to the study.
Anthropometric measures, blood pressure and abdominal computed tomography
Height and weight were measured using the InBody 720 (Biospace, Seoul, South Korea). Body mass index (BMI) was calculated as body weight in kilograms divided by height in meters squared. The waist circumference was measured at the half position between the lowest rib cage and the upper iliac crest with the subject in standing position. Systolic and diastolic blood pressures were measured twice with an automatic electronic sphygmomanometer (UA-731, Takeda Medical Inc., Tokyo, Japan). The percentage of body fat was calculated by bioelectric impedance analysis using the InBody 720 (Biospace, Seoul, South Korea). Abdominal visceral and subcutaneous fat areas were measured by computed tomography scan (High Speed Advantage, General Electric Co., Evansville, IN, USA). We defined visceral obesity as a visceral fat area of more than 100 cm2 [13].
Laboratory methods
Blood samples were drawn in the morning hours after a 12-h overnight fast. The samples were left at room temperature for 30 min, centrifuged for 15 min at 2500 rpm to separate the serum, and then stored at -70℃. Fasting serum glucose, total cholesterol, triglyceride (TG), and HDL-cholesterol were determined using an autoanalyzer (Hitachi 747 auto-analyzer, Hitachi, Tokyo, Japan). Insulin was measured by enzyme immunoassay (Immulite 2000, SIEMENS, IL, USA). Serum low-density lipoprotein cholesterol concentration was calculated according to the Friedewald formula [14].
Serum adiponectin, resistin, leptin, intercellular adhesion molecule (ICAM), vascular cell adhesion molecule (VCAM), MCP1, TNF-α and IL-6 concentrations were measured with the enzyme-linked immunosorbent assay (ELISA) kit (Quantikine, R&D Systems, Minneapolis, MN, USA). Intraassay and interassay coefficients of variation (CVs) of analyzed adipokines, inflammatory cytokines and chemokines were as follows: adiponectin (< 4.7%, < 6.9%), resistin (< 5.3%, < 9.2%), leptin (<3.3%, 5.4%), ICAM and VCAM (< 5.2%, < 7.8%), MCP1 (< 7.8%, < 6.8%), TNF-α (< 5.2%, 7.4%), and IL-6 (< 7.8%, 9.6%).
We used the solid phase two-site enzyme immunoassay Mercodia Oxidized LDL ELISA (Mercodia, Uppsala, Sweden) to quantitatively measure oxidized low density lipoproteins (oxLDL) in serum. Serum high-sensitivity C-reactive protein (hsCRP) was measured by high-sensitively assay, using a ELISA kit (Human CRP ELISA kit, High sensitivity, Helica Biosystems Inc., Fullerton, CA, USA) with intraassay and interassay CVs less than 4.6% and 6.0%, respectively.
Criteria for MetS
The diagnosis of MetS was based on the updated National Cholesterol Education Program (NCEP) criteria [15]. Participants with three or more of the following five criteria were defined as having MetS: abdominal obesity (defined as waist circumference ≥ 90 cm for men and ≥ 85 cm for women in Korean) [16], elevated blood pressure (≥ 130 mmHg systolic and/or ≥ 85 mmHg diastolic), high fasting blood glucose (≥ 100 mg/dL), high TG (≥ 150 mg/dL), and low high-density lipoprotein (HDL) cholesterol (< 40 mg/dL for men and < 50 mg/dL for women). The third criterion, fasting blood glucose, was changed to 100 mg/dL from the initial cutoff point of 110 mg/dL according to the revised guideline [17].
Statistical analyses
The statistic analyses were performed using the SAS 9.1 program (SAS Inc., Cary, NC, USA). Differences in continuous variables of socio-demographics, body composition, and clinical and metabolic parameters and biomarkers between MetS subjects and control subjects were evaluated by the t-test for normally distributed variables and by the Wilcoxon rank-sum test for variables that were not normally distributed. Differences in categorical socio-demographics variables were evaluated by the chi-square test. The variables that did not have a normal distribution (adiponectin, resistin, leptin, ICAM, VCAM, MCP1, oxLDL, TNF-α, IL-6, hsCRP) were log-transformed before analyses. For the purpose of data presentation, these variables were again transformed to absolute values in the section "Results". MetS score is determined by adding the number of risk factors; waist circumference, TG, HDL-cholesterol, glucose and blood pressure. The associations between MetS score and adipokines and inflammatory markers were determined by Pearson's correlation. Multivariate logistic regression analysis was used to estimate the adjusted odds ratios (OR) and 95% confidence intervals of the adipokines and inflammatory markers, predicting MetS. In order to assess the contribution of the various adipokines and inflammation markers to the different components of the MetS, we used multiple linear regression models. The components of MetS were the dependent variables and the adipokines and inflammation markers, as well as other potential confounders, were the covariates. Confounders included age, smoking and BMI. All above analyses were considered significant at p < 0.05 (two tailed).
Results
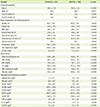
Socio-demographics, body composition, clinical, metabolic, and inflammatory parameters and adipokines in the group with and without MetS are shown in Table 1. Among our study population (n = 199), 108 (54.3%) individuals were MetS subjects meeting the NCEP ATP III criteria. The MetS group had a larger proportion of subjects who were current smokers (p < 0.01) compared to control group. No difference was observed in alcohol intake habit. The MetS group exhibited significantly higher BMI (p < 0.0001), percent body fat (p < 0.01), visceral fat area (p < 0.01), total cholesterol (p < 0.0001), LDL-cholesterol (p < 0.001), and insulin (p < 0.0001) levels and lower subcutaneous fat area (p < 0.05) than the control group. The proportion of the MetS individuals meeting each NCEP ATP III criteria were 92.5% for waist circumference (control group; 38.5%, p < 0.0001), 69.4% for blood pressure (control group; 18.7%, p < 0.0001), 74.1% for TG (control group; 14.3%, p < 0.0001), 63.0% for HDL-cholesterol (control group; 17.6%, p < 0.0001), and 82.4% for glucose (control group; 4.4%, p < 0.0001) (data not shown). Subjects with MetS also had significantly higher serum levels of resistin (p < 0.01), leptin (p < 0.001), ICAM (p < 0.0001), MCP1 (p < 0.0001), oxLDL (p < 0.0001), TNF-α (p < 0.0001), IL-6 (p < 0.001) and hsCRP (p < 0.0001) than subjects without MetS. By contrast, serum adiponectin levels were significantly lower in subjects with MetS (p < 0.0001). There was no difference in serum VCAM concentration. Also, the MetS group had a larger proportion of subjects who were visceral obesity compared to control group (p < 0.05).
The Pearson's partial coefficients of correlation between the MetS score and blood markers are shown in Table 2. The correlation analysis indicated that the MetS score had an inverse relationship with adiponectin (r = -0.325, p < 0.0001), and positive correlations with leptin (r = 0.197, p < 0.05), ICAM (r = 0.244, p < 0.01), MCP1 (r = 0.180, p < 0.05), oxLDL (r = 0.188, p < 0.05), TNF-α (r = 0.316, p < 0.0001), IL-6 (r = 0.170, p < 0.05) and hsCRP (r = 0.242, p < 0.01).
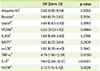
The odds ratios of having MetS as a function of each adipokine and inflammation marker after adjusting for age, sex, BMI and smoking are shown in Table 3. MetS was significantly associated with increments in TNF-α (OR = 4.78, p < 0.01), IL-6 (OR = 7.60, p < 0.0001), and hsCRP (OR = 2.72, p < 0.05). The odds ratio of MetS with high adiponectin was 0.42 (p < 0.05).
The multiple linear relationships of each metabolic component to adipokine and inflammatory parameters are shown in Table 4. Waist was independently and significantly associated with MCP1 and the standardized β coefficient was 0.117. TNF-α was independently associated with glucose with a standardized β value of 0.228. TG was independently associated with adiponectin, ICAM and TNF-α; the standardized β coefficients were -0.213, 0.197, and 0.193, respectively. Also, HDL-cholesterol was independently associated with adiponectin, ICAM and hsCRP with standardized β coefficients of 0.214, -0.150, and -0.173, respectively.
The relationship between the visceral and subcutaneous fat area measured by computed tomography scan and adipokines and inflammation markers after adjusting for age, sex, smoking, and BMI are shown in Table 5. The correlation analysis showed a positive relationship between visceral fat area and leptin (r = 0.184, p < 0.05) and hsCRP (r = 0.156, p < 0.05). The subcutaneous fat area positively correlated with leptin (r = 0.305, p < 0.0001) and hsCRP (r = 0.228, p < 0.01), while it negatively correlated with TNF-α (r = -0.157, p < 0.05).
Discussion
A cluster of risk factors including obesity, insulin resistance, hypertension and dysregulated lipoproteins have been included as features of MetS. However, there are ongoing debates regarding appropriate application of these components as diagnostic tools for MetS in clinical practices. In this study, we identified the relationship between the components of MetS and inflammation-related biomarkers to determine possible application for these biomarkers in the diagnosis of MetS. Despite current use of MetS components, studies have indicated that inflammatory markers need to be incorporated to fully understand the risk of clinical complications [18,19].
Study results indicated that body composition measures and inflammation-related biomarkers were significantly different between subjects with and without MetS. Obesity-related indicators such as waist circumference and BMI have been used to predict of MetS [20]. More recently, visceral fat as a metabolically active tissue has been suggested to have a close relationship with MetS. It is associated with higher production of inflammation medicators including TNF-α [21], plasminogen activator inhibitor-1 (PAI-1) [22], IL-6, and hsCRP [20]. In the present study, subjects with MetS showed a higher visceral fat area compared to control subjects. However, subjects with MetS had less subcutaneous fat area compared to the control subjects.
The MetS score had a positive relationship to the circulating concentrations of adipokine and most pro-inflammatory markers except resistin and VCAM. Previous studies have also suggested that the presence of MetS was associated with higher levels of IL-6, TNF-α, and hsCRP and with lower levels of adiponectin [20]. MetS score is determined by adding the number of risk factors; waist circumference, TG, HDL-cholesterol, glucose and blood pressure. A patient is classified as having MetS when the MetS score is more than 3. The higher their MetS score indicates the higher their risk of having or developing metabolic diseases. Our study results indicated that most of the inflammation markers and adipokines showed a significant relevance with the MetS score. After adjusting possible confounders including age, sex, BMI and smoking, adiponectin was shown to have a strong negative relationship with the MetS score, and the OR of MetS was 0.42. Plasma adiponectin is often found to be positively correlated with HDL-cholesterol and insulin sensitivity, whereas inverse correlations with central adiposity, TG levels, and hsCRP concentrations have been observed [23,24]. Devaraj and colleagues [25] reported that low adiponectin was the strongest predictor of MetS (OR, 2.5; 95% CI, 1.3-4.5). Adiponectin is the most abundant adipokine in circulation and it exerts anti-inflammatory activity. It has been demonstrated that adiponectin modulates insulin sensitivity by stimulating glucose utilization and fatty acid oxidation via phosphorylation and activation of AMPK in muscle and liver [26]. Adiponectin also possesses vasculo-protective effects which are mediated by promoting vasodilatation and vascular repair, and inhibiting ROS formation, macrophage activation and smooth muscle cell proliferation [27].
Among others, ICAM, hsCRP and TNF-α concentrations exhibited strong correlations with the MetS score. The initial stages of atherosclerosis are characterized by adhesion of circulating leukocytes to the endothelial cells and subsequent transendothelial migration. This process is mediated in part by CAMs like ICAM-1 which are expressed on the endothelial membrane [12]. In a recent cohort study, baseline ICAM-1 was increased initially in healthy middle-aged men who later developed cardiovascular disease [28] indicating this adhension molecule is an important predictor for cardiovascular complications.
hsCRP is a marker of systemic inflammation which has been known to be related to cardiovascular disease risk factors such as obesity, high blood pressure, apolipoprotein B and fibrinogen [29]. hsCRP is also known to impair insulin signaling. In previous studies, strong associations between hsCRP and insulin resistance have been reported [30].
TNF-α is a most representative pro-inflammatory cytokine which is produced mainly by macrophages and lymphocytes. Prior studies have demonstrated that the infiltration of macrophages in adipose tissue increases TNF-α expression followed by adhesion molecule induction [31]. TNF-α also inhibits the insulin signaling cascade at several pivotal regulatory proteins, such as the insulin receptor substrate (IRS) and Akt substrate 160 in human skeletal muscle in vivo [32]. In human studies, insulin sensitivity correlated with plasma soluble TNF receptor 2 (TNFR-2) after adjustment for multiple confounders in the healthy adults [33]. IL-6 is another pro-inflammatory cytokine related to insulin resistance. IL-6 has also been shown to facilitate the hepatic production of hsCRP [34]. Leptin is known as a TNF-α inducer while adiponectin is a suppressor.
These results suggest that adipokines including leptin and adiponectin mediate the production of inflammatory cytokines and CAMs possibly leading the development of insulin resistance and vascular complications. Our study results confirmed that MetS score and inflammatory markers are closely related. The odds ratio value indicated that adiponectin, TNF-α, IL-6 and hsCRP are strongly related to MetS highlighting the fact that these may be important mediators for metabolic disease development and should be targets for future intervention.
Few studies have analyzed the relative weight of each MetS components in predicting inflammatory responses. Results from this study indicated that both TG and HDL-C were closely related to the concentration of inflammatory markers next to the MetS score (Table 4). Lipid metabolism and cytokine production seem to have a cross-talk pathophysiological response. During the acute-phase response to inflammation, cytokines induce tissue and plasma events that lead to changes in lipoprotein. TNF-α acutely raises serum TG levels in vivo by stimulating very low-density lipoprotein (VLDL) production [35]. In healthy people, a positive association between the plasma concentration of the soluble fraction of TNFR-2 and total TG has been reported, which paralleled a negative one with HDL-cholesterol [36]. Therefore, the acute-phase response induced by cytokines, such as TNF-α and hsCRP, may include a characteristic dyslipidemia (raised TG and lowered HDL-cholesterol) and other process promoting atherosclerosis.
We also measured abdominal subcutaneous adipose tissue (SAT) and visceral adipose tissue (VAT) by CT to determine the relationship between fat tissue mass and biomarkers. Adipose tissue pathogenicity differs according to adipose tissue localization [37]. VAT was suggested as an independent predictor of impaired glucose tolerance, elevated blood pressure, and dyslipidemia [38,39]. It is more susceptible to lipolysis than SAT [21], and is associated with a higher production of hsCRP [20]. Pou and colleagues [40] examined the relationship of abdominal SAT and VAT volume to circulating inflammatory and oxidative stress biomarkers and concluded that SAT and VAT were similarly associated with elevated concentrations of multiple inflammatory biomarkers [40]. Our study results indicated that both VAT and SAT were significantly related to leptin and hsCRP. This finding indicated that both VAT and SAT contributed to the elevated production of inflammation-related molecules.
Although this study provided information on sensitivity of inflammation-related biomarkers associated with Met score, there are limitations. Due to the cross-sectional design of this study, it was not possible to establish a cause-effect relationship between adipokines and inflammatory biomarkers and MetS. Therefore, prospective or longitudinal studies are necessary to further elucidate the association between serum adipokines, inflammatory biomarkers and MetS. Also, we did not consider behavioral factors and dietary factors which may play important roles in the link between MetS and adipokines and inflammatory biomarkers.
In summary, the circulating adiponectin, TNF-α, IL-6 and hsCRP were the most proximate mediators linking obesity, MetS and metabolic diseases in this study. Blood TG and HDL-cholesterol concentrations displayed close relationships with various inflammatory markers studied suggesting disturbances in lipid metabolism may be major events related to MetS prior to the development of metabolic diseases.


 XML Download