

 PDF
PDF ePub
ePub Citation
 Print
Print


Introduction
Prevalence of metabolic syndrome (MS) is highly increasing in developed countries. In the US population, prevalence of MS is estimated at 28% among adults (aged ≥ 20 years) and 43.5% among elderly (aged ≥ 60 years) according to data from the National Health and Nutrition Examination Survey (NHANES) (1999-2006) [1]. According to the third Korea National Health and Nutrition Examination Survey (KNHANES III) (2009), MS was present in 32.9% of men and 31.8% of women aged 30 years and older [2]. Apparently, MS has become a current major health problem.
MS is described as a 'clustering' of impaired glucose tolerance, hypertension, dyslipidemia, and visceral obesity. Several previous studies have stated that MS predicts cardiovascular disease (CVD) [3-5]. In recent studies, inflammation and homeostatic markers such as C-reactive protein (CRP) and plasminogen activator inhibitor-1 (PAI-1) have been observed to predict the development of MS and longitudinal changes in metabolic risk factors [6]. These markers are associated with future incidence of CVD and type 2 diabetes [3,7]. Recently, several studies have suggested that the serum concentration of γ-glutamyl transpeptidase (GGT), which is typically used as a marker for liver disease, is also associated with the risks of CVD, including coronary heart disease. In addition, several prospective studies have found that elevated GGT levels are associated with features of insulin resistance, and can predict later development of diabetes [8]. On the other hand, other prospective studies have postulated that serum GGT levels are independent risk factors for CVD [6,9].
Also, many previous studies reported that alcohol abuse is related with increased prevalence of CVD as well as MS, and could be a factor that deteriorates the status of MS [1,6,10]. In particular, chronic alcohol consumption is a direct cause of hypertension, hyperlipidemia, and hyperglycemia [11,12]. Not only chronic alcohol abuse known as one of the most common causes of liver disease, but moderate drinking also aggravates liver diseases such as hepatitis, steatosis and fibrosis [13,14]. Many results of abnormal liver function tests are caused by excessive alcohol consumption [15,16]. Recent population-based study showed that of 1,775 Korean men (mean age 40.0 ± 5.8 years) who underwent health check-ups had significant positive correlations between the amount of alcohol consumption and blood pressure, triglyceride, fasting blood glucose, GGT levels, and HDL cholesterol levels. The odds ratios for the MS were significantly increased in proportion to the increasing levels of alanine transaminase (ALT) and GGT, while alcohol consumption did not increase the prevalence of MS [17]. The effect of alcohol consumption and hepatic enzymes on MS was observed respectively as independent factors, but the relationship between GGT level, alcohol and MS was not fully investigated and longitudinal effects of GGT concentration on the incidence of MS were not mentioned.
The objective of this cohort study was: 1) to investigate the associations between the MS and serum GGT level in Korean male workers, and 2) to examine whether increased serum GGT levels were associated with a subsequent incidence of MS after 4 years.
Materials and Methods
Subjects
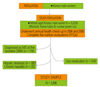
The subjects of this study were selected among middle-aged Korean males who work at the company 'H' in Korea. All subjects were between 24 and 56 years of age at baseline, year 2004. Among 5,235 potential study subjects, subjects diagnosed with MS (n = 716), hepatic steatosis (n = 282) and chronic hepatitis (n = 23) were excluded. Subjects who are currently treated for hypertension, diabetes mellitus, and dyslipidemia were also excluded (n = 516) as these men were likely to restrict alcohol consumption due to their health condition. Thus, the final study sample for analysis consisted of 3,698 men (Figure 1).
Questionnaires and clinical measurements
All subjects completed the nutrition evaluations (Food Frequency Questionnaire, FFQ) in 2008. Weekly alcohol consumption, type of alcohol, and drug use were determined by a self-administered questionnaire. Anthropometrics of all subjects, which included weight, height, waist circumference (WC), and body composition (Inbody 720, Biospace Co Ltd, Seoul, Korea), were taken by trained medical personnel. Blood pressure was measured at the sitting position after a minimum rest of 5 minutes (HEM-6111, Omron, Japan). Blood samples were taken after a 12-hour overnight fast. High-density lipoprotein-cholesterol (HDL-C), fasting blood glucose (FBG), insulin, glycosylated hemoglobin (HbA1c), triglycerides (TG), ALT, aspartate transaminase (AST), GGT and total cholesterol (TC) were measured by standard protocol.
Concentration of low-density lipoprotein cholesterol (LDL-C) was determined by the Friedwald equation method (LDL-C = TC - HDL-C - TG/5) [18]. Body mass index (BMI) was calculated as weight divided by square of height (kg/m2). Insulin sensitivity was derived using the following formula: homeostasis model assessment of insulin sensitivity (HOMA-S) = 22.5 / (insulin [mU/L] × glucose [mmol/L]). β-cell function was calculated using the formula: homeostasis model assessment of pancreatic β-cell function, % (HOMA-B) = (20 × insulin [mU/L]) / (glucose [mmol/L] - 3.5). Homeostasis model assessment (HOMA) was been used widely as a simple way of deriving indices of pancreatic endocrine function and tissue insulin sensitivity from fasting plasma samples, and HOMA compares adequately with the 'gold standard' methods for assessing these functions [19].
Diagnostic criteria for MS
MS was defined according to the American Associations of Clinical Endocrinologists, 2003 (AACE) as the presence of three or more of the following components: 1) abdominal obesity (BMI): ≥ 25 kg/m2; 2) hypertriglyceridemia: ≥ 150 mg/dL; 3) elevated BP: 130 mmHg systolic or 85 mmHg diastolic; 4) hyperglycemia (FBG): ≥ 110 mg/dL; 5) low HDL-C: < 40 mg/dL. The original cut-offs for BMI were modified to consider the ethnic differences of Asian subjects [20].
Study design
The association of baseline serum GGT concentration (year 2004), MS risk factors and clinical covariates including age, BMI, CRP and alcohol consumption (year 2008) were examined. Then, the clinical characteristics of MS components in subject subgroups according to serum GGT level were compared. The relationship between serum GGT level (2004) and a risk of MS after 4 years (2008) was also examined.
Statistical analysis
Results are given as means ± S.D. In the cross-sectional analyses, differences between MS and non-MS subjects were assessed by independent t-tests. Serum GGT level was classified into five subgroups using quartiles in the normal reference range and upper reference value (elevated group) [21]. The cut-off points for GGT were 17, 23, 34 and 68 (IU/L). The relationship between serum GGT level and MS risk factors was examined by Spearman's correlation and coefficients after adjustment for age, BMI, alcohol consumption and each of the hepatic enzymes (ALT, AST, and GGT). Comparisons between groups classified by serum GGT level (5 subgroups) were performed using multivariate general linear model (GLM) analysis followed by a homogeneity test. Finally, risks of MS incidence after 4 years and each component of MS according to serum GGT level were analyzed using the Cox proportional model adjusted for age. Among the clinical variables, high HOMA-B and high HOMA-S cut-offs were defined for the subjects' fourth quartile. Statistical analysis was performed using software from the SAS Institute Inc. program, version 9.1 (Cary, NC, USA). The level of p < 0.05 was considered as statistically significant.
Results
General characteristics of the study subjects
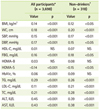
General characteristics of the subjects classified by the presence of MS at the baseline examination are presented in Table 1. As shown, MS was present in 9.1% of the subjects, and the age of MS subjects was greater than the non-MS population (non-MS vs. MS: 43.6 ± 7.1 years vs. 43.7 ± 7.2 years, p = NS). Participants in the MS group had significantly higher BMI, WC, SBP, DBP, FBG, HOMA-B, HbA1c, TG, and TC and low HDL-C and HOMA-S than those in non-MS (p < 0.001). Presence of MS was associated with higher ALT, AST and GGT (non-MS vs. MS [IU/L]: ALT: 22.6 ± 14.1 vs. 29.6 ± 19.0; AST: 22.5 ± 9.4 vs. 25.0 ± 11.6; GGT: 31.3 ± 31.2 vs. 44.8 ± 38.9, p < 0.001). Among 4,430 drinkers (84.6% of total participants), the amount of weekly alcohol consumption was higher in MS participants than normal participants (non-MS vs. MS [g/wk]: 22.5 ± 36.9 vs. 30.3 ± 54.3, p < 0.001).
Prevalence of MS based on the amount of alcohol consumption and GGT level
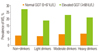
In the normal GGT level (0-67 IU/L), 7.5% (n = 23 out of 307) of non-drinkers and 8.5% (n = 64 out of 750) of moderate drinkers were classified with MS. Subjects who drink >30 g/day of alcohol with normal GGT levels showed an incidence of 8.9% (n = 67 out of 755) for MS. Presence of MS with an elevated GGT level was 27.3% (n = 3 out of 11) in the non-drinker group, 22.9% (n = 19 out of 83) in moderate drinkers and 21.1% (n = 27 out of 128) in drinkers who consume more than 30 g of alcohol per day (Figure 2).
Correlations between GGT level and clinical variables
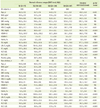
The GGT level was significantly correlated with all of the components of MS, (BMI, WC, SBP, DBP, and FBG) and TG, in particular, showed the strongest relationship (p < 0.001). ALT, GGT, and TC were also positively associated with GGT level. Among the variables, HOMA-S had an inverse correlation and serum HDL-C and HbA1c were not significantly related with serum GGT level. In the non-drinker group, values were similar with the results for all participants. HDL-C, HOMA-B and HbA1c did not show significant relationships with GGT level (Table 2).
Subgroup analysis of subjects according to GGT level
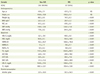
Comparisons between groups classified by GGT level are presented in Table 3, and the cut-off points for GGT level (IU/L) were ≤ 17, 18~23, 24~34, 35~67, ≥ 68. The FBG, TG, LDL-C, TC, ALT, AST and ages of participants showed significantly higher mean values with increasing GGT level. Among the clinical variables, TG, LDL-C and TC showed the sharpest increase. The mean HDL-C values were decreased with increasing GGT level in all study subjects. There were no statistical significances in values of BMI, WC, blood pressure, HOMA-B and HbAlc.
Prospective analysis
During the 4-year study period, 337 out of 3,698 subjects (9.1%) developed MS (data not shown). To determine whether serum GGT levels are associated with future incidence of MS and deterioration of relating factors, the Cox proportional model analysis was performed and the results are presented in Figure 3, Table 4.
Risks of MS according to normal GGT level during the 4-year study period
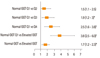
Multivariable adjusted hazard ratios for the incidence of MS over the 4-year study period according to normal GGT level is presented in Figure 3. The risk of MS was significantly increased with serum GGT level across the subgroups. The risk of MS for subjects with normal GGT level was increased in Q3 and Q4, while it was not different in Q2.
Risks of MS and its individual components according to GGT level during the 4-year study period
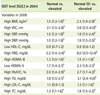
Results of the analyses of elevated GGT level and the prediction of risk factors relating to MS appeared to have a close connection with obesity (high BMI and high WC), high FBG, high HOMA-B, low HOMA-S, high HbA1c, high TG, and high TC compared to normal GGT level. HDL-C and LDL-C had no statistical significance. Hazard ratios in the first quartile for elevated GGT level versus normal GGT level predict that the risk factors relating to MS were greater than the normal GGT level versus elevated GGT level model. However, HDL-C had no statistical significance (Table 4).
Discussion
This study was performed on 3,698 healthy subjects to investigate the associations between the incidence of MS and serum GGT level in Korean male workers, and to examine whether increased serum GGT levels 4 years earlier were associated with a subsequent incidence of MS after 4 years. Although anti-hypertensive and anti-diabetic medication users are included in the definition of MS, self-reported drug users were not considered in the present study because they were likely to modify their alcohol consumption or underreport the drinking amount. If the hypertension and diabetes drug users were included as study subjects, the incidence of MS during the 4-year study period increased from 9.1% to 9.9%.
Clinically, evaluations of serum GGT levels are widely used as markers to evaluate the degree of liver injury [11,22]. In addition, GGT has been used as a marker of hepatobiliary tract function and excessive alcohol consumption [12,23,24]. In contrast, according to several population-based studies, properties of hepatic enzymes, as indicators for heavy drinking, were not evident and even dismissed [14,25]. In this study, a mild correlation between alcohol consumption and serum GGT levels was confirmed. Therefore, the relationship between serum GGT level and MS in a non-drinker subgroup was examined to determine whether serum GGT level is related to MS independent of alcohol consumption.
In subjects with normal GGT concentrations showed that the prevalence of MS was highest in the heavy drinking group, and this result was similar with other studies [10,26]. However, in case of elevated GGT levels, slightly different results were found with the incidence of MS, and the results were thought to be caused by insufficient subgroups of alcohol consumption. In addition, differences between the non-drinker group and moderate drinker group were limited in order to draw a meaningful conclusion.
In the subgroup analysis, serum lipid levels were gradually increased with serum GGT level. Positive relationships between FBG, HOMA-S, TG, LDL-C, TC and GGT level were found, but the relationships were not persistent in the non-drinker group (data not shown). The results from the present study are in agreement with those of previous studies regarding serum GGT level and incidence of type 2 diabetes or CVD [23,24]. In non-drinking subjects, diabetic blood parameters such as HOMA-B, HOMA-S and FBG showed an increasing trend according to serum GGT level, but did not reach statistical significance. These results are in disagreement with other previous studies [6,27,28] and may be caused by different grouping of the serum GGT level. Many other studies classified the subjects by quartiles or quintiles of hepatic enzymes, but in the present study, the elevated hepatic enzyme group was separated and then the rest of the subjects with normal hepatic enzyme levels were classified into quartiles.
A stronger correlation between serum GGT level and MS risk factors was observed in the non-drinker subgroup than those in all other study subjects. Similar results have been reported in a British population [6]. No strong evidence of that result was found in the present study, but it could be explained by other studies showing that light to moderate alcohol consumption is more cardio-protective than alcohol abstinence [4,10]. The favorable effect of alcohol on CVD is putatively related with plasma HDL-C concentration. However, significant association between alcohol consumption and HDL-C was not found in the present study.
Prospective analysis showed that higher serum GGT levels have a predictive effect on the incidence of MS during the 4-year study period. Furthermore, the risk for MS was gradually increased with an increasing level of serum GGT level although within normal reference range. These results are in agreement with data from previous studies in diabetic populations [27].
The three major results from this cohort study can be summarized as follows. First, elevated serum GGT level was confirmed to be related with the incidence of MS in later life. Second, these effects of high serum GGT level on risk for MS are continuous even in normal reference ranges. Third, elevated serum GGT was strongly related with an abnormal serum lipid profile (TG, TC and LDL-C).
There are some limitations in the current study. First, a repeated measurement of serum GGT level was not performed, which is a potential limitation since hepatic enzymes could change on occasion. Second, MS was diagnosed in study subjects according to the AACE (2003) criteria, but most of the studies for MS use the National Cholesterol Education Program-Adult Treatment Panel III (NCEP-ATP criteria) or World Health Organization (WHO) criteria. Because WC data was not available in 2004, BMI was used as a marker for abdominal obesity instead. However, in relation to obesity, BMI is widely used to indicate a high correlation with adiposity [18]. Third, alcohol consumption (FFQ) was investigated only once in 2008, therefore the non-drinker group probably contains some former drinkers.
Conclusion
The aim of the present study was to examine the associations between MS and serum GGT level in Korean male workers. The results from this study indicate that the level of serum GGT could be an early biomarker for the development of MS and deterioration of individual risk factors relating to MS. In particular, elevated serum GGT level appears to have detrimental effects on serum lipid levels such as TG, LDL-C, and TC.
 XML Download