

 PDF
PDF ePub
ePub Citation
 Print
Print


Introduction
The consumption of sugar-sweetened beverages (SSBs) has been reported as a risk factor for weight gain and obesity in multiple systematic reviews [1-4]. The association between SSBs and the development of obesity has been explained both in terms of the high energy intake from the added sugars in SSBs and in terms of the negative association between SSBs and intake of important micronutrients [5]. In the United States (U.S.), the 2010 Dietary Guidelines for Americans emphasize reducing SSB consumption to promote good health and healthy dietary habits [6-9].
The SSB consumption pattern in the Korean population has also attracted interest. Most recently, Lee and colleagues [10] reported that the percentage of the Korean population consuming these beverages had increased from 31.5% in 1998 to 47.7% in 2009. In particular, energy intake from SSBs among Korean adolescents (13-18 years) increased from 22 kcal/day in 1998 to 35 kcal/day in 2009 (p < 0.05). Furthermore, the prevalence of obesity among Korean children and adolescents has increased from 5.8% in 1997 to 9.7% in 2005 [11]. Despite these facts, the factors associated with SSB consumption, including dietary factors and weight status, have not been investigated in the Korean population.
Therefore, the purpose of this study was to examine whether SSB intake is associated with demographic and other dietary factors among Korean children (7-12 years) and adolescents (13-18 years), using nationally representative data from the 2008-2011 Korea National Health and Nutrition Examination Survey (KNHANES).
Materials and Methods
Study population
For the purposes of this study, 2008-2011 KNHANES data, gathered by the Korea Centers for Disease Control (KCDC), were used [12-15]. KNHANES is a cross-sectional survey based on multistage, stratified area probability sampling of non-institutionalized individuals (aged ≥ 1 year). KNHANES was approved by the KCDC Institutional Review Board.
We used data on children and adolescents aged 7-18 years from KNHANES 2008-2011. The final study population consisted of 5,421 children and adolescents (3,179 for 7-12 years and 2,242 for 13-18 years) who participated in the nutrition survey, which addressed SSB intake, as well as the health examination survey and the health behavior survey.
Outcome variable
We analyzed 24-hour dietary recall data from the 2008-2011 KNHANES to estimate SSB consumption levels among children and adolescents. SSBs were defined using the KNHANES food grouping labeled 'beverage and alcoholic beverage.' For this study, we excluded non-sugar-sweetened beverages (for example, 100% fruit juices, teas, non-sugar coffee, etc.) and alcoholic beverages from this grouping. For χ2 tests, we created two mutually exclusive SSB intake categories (< 300 and ≥ 300 ml/day) based on the SSB intake distribution and common consumption units. For logistic regression analysis, SSB intake was dichotomized by ≥ 300 ml/day, using as cutoffs the upper values for the approximately 90th percentiles. We defined the very high SSB intake group as that having SSB intake of ≥ 300 ml/day (1.5 cups/day).
Exposure variables
Demographic, dietary, and behavioral factors were included as exposure variables. Demographic factors included age (7-12 years and 13-18 years), gender, household income, and weight status. Household income was divided into quartiles in accordance with the KCDC's economic status grouping. Weight status was classified as normal weight (≥ 5th to < 85th percentile), overweight (≥ 85th to < 95th percentile), and obese (≥ 95th percentile) based on age- and sex-specific body mass index (BMI, kg/m2) distribution from the Korean growth charts [16]. Dietary variables included 9 nutrients (energy, carbohydrates, fat, protein, calcium, sodium, iron, vitamin A, vitamin C), 8 food groups (cereals, sugars, vegetables, fruit, meat & poultry, eggs, fish and shell fish, milk and dairy products) and plain water intake from 24-hour dietary recall data. We chose variables of main interest to find factors associated with SSB intake, and mutually exclusive intake categories were created for each exposure variable. Energy intake was split into two groups, < 125% of energy efficiency ratio (EER) and ≥ 125% of EER, in accordance with the KCDC's values as reported in KNHANES [12-15]. The plain water intake categories included < 4 cups/day (800 ml/day) and ≥ 4 cups/day based on the recommended level (746 ml/day for boys aged 12-14 years, 828 ml/day for boys aged 15-18 years) from the Dietary Reference Intake for Koreans (KDRI) [17]. Milk intake was divided into < 1 cup/day (200 ml/day) and ≥ 1 cup/day according to the minimum serving in the KDRI guidelines [17]. The fruit and vegetable intake categories were based on those who did and did not meet the intake recommended by the World Health Organization (WHO) (400 g/day). For sodium intake, two groups (< 2,000 and ≥ 2,000 mg/day) were considered based on the KDRI sodium recommendation [17]. In addition, the sodium cutoff points were based on the WHO recommendation of 2,000 milligrams per capita per day [18, 19]. Behavioral variables included being highly physically active at least 20 minutes/day during the past 7 days (< 3 and ≥ 3 days/week), based on the KCDC guidelines [20], and having experience with nutrition education (yes or no).
Statistical analysis
χ2 tests were used to compare the percentage of the above variables according to SSB intake groups among children and adolescents. Univariable and multivariable logistic regression models were fit to estimate the adjusted odds ratios (ORs) and 95% confidence intervals (CIs) for variables associated with high SSB intake (≥ 300 ml/day). Multivariable logistic regression models controlled for possible confounding factors: weight, energy intake, milk intake, sodium intake, fruit and vegetable intake, and physical activity. All statistical analyses were conducted using SAS 9.2 (2009, SAS Institute Inc, Cary, NC, USA)
Results
The mean total SSB intake among those aged 7-18 years was 98.7 ml/day, with means of 114.1 ml/day for boys, 82.1 ml/day for girls, 64.7 ml/day for those aged 7-12 years, and 120.2 ml/day for those aged 13-18 years (data not shown).
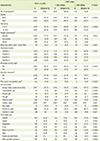
Overall, SSB intake for each quartile was 0 ml/day for Q1, 0 ml/day for Q2, 148 ml/day for Q3, and 338 ml/day for the 90th percentile (data not shown). Table 1 shows study subject characteristics and their associations with the two mutually exclusive SSB intake categories (< 300 and ≥ 300 ml/day) based on the SSB intake distribution and common consumption units. Based on χ2 tests, SSB intake differed significantly by gender, age group, BMI, plain water intake, intake of 9 nutrients (energy, carbohydrates, fat, protein, sodium, iron, vitamin A, vitamin C), intake of 4 food groups (cereals, sugars, meat & poultry, milk and dairy products), and high physical activity. Although the data are not shown, SSB intake differed significantly by medium and low physical activity, where results were similar to high physical activity (Table 1).
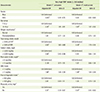
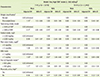
The adjusted odds of both the univariate and multivariable logistic regression analyses have similarly significant results (Table 2). Based on univariate analysis, the adjusted OR for SSB intake of ≥ 300 ml/day differed significantly by gender, age group, energy intake, sodium intake, milk intake, and physical activity. However, the adjusted OR for SSB intake of ≥ 300 ml/day by multivariable logistic regression analysis did not differ significantly by gender or sodium intake. Table 3 shows the adjusted ORs for variables associated with very high SSB intake (≥ 300 ml/day) among children (7-12 years) and adolescents (13-18 years) by gender. Based on multivariable logistic regression analysis, the adjusted OR for SSB intake of ≥ 300 ml/day was significantly higher among the high energy intake group (≥ 125% of EER) among those aged 7-12 years (OR = 3.17 in boys and OR = 2.74 in girls). In addition, among those aged 13-18 years, the adjusted OR was 3.0 among girls in the high energy intake group (≥ 125% of EER). The adjusted OR was also significantly higher among children and adolescents who consumed < 1 cup/day of milk (OR = 1.93 in boys aged 7-12 years; OR = 2.53 in girls aged 7-12 years; OR = 1.83 in boys aged 13-18 years). Being overweight/obese and eating less than 400 g/day of fruits and vegetables were significantly associated with an increased OR for SSB intake of ≥ 300 ml/day among boys aged 7-12 years (OR = 1.72 and OR = 1.71, respectively) (Table 3).
Discussion
In the present study, 20.8% of Korean children and adolescents (7-18 years) consumed ≥ 1 cup/day of SSBs (data not shown), which is lower than the figure of 22.8% reported in a study of Australian children aged 2 to 16 years [21]. On the other hand, the 2010 National Youth Physical Activity and Nutrition Study reported that 64.9% of high school students in the U.S. consumed SSBs ≥ 1 time/day [22]. In the present study, high SSB intake (≥ 300 ml/day) was almost twice as high in boys compared with girls (63.7% vs. 36.3%, Table 1). This finding is similar to previous studies that reported gender to be significantly associated with high SSB intake among U.S. adolescents [22,23].
Only a few studies have examined the relationships among SSB intake and other dietary or behavioral factors among children. Park and colleagues [24] found that being male was associated with a greater OR for high SSB intake of ≥ 3 times/day (OR = 1.66), while being physically active for ≥ 60 min/day on < 5 days/week was associated with a lower OR for high SSB intake (OR = 0.85); however, weight status was not associated with SSB intake. In the present study, SSB intake was inversely associated with milk consumption and fruit and vegetable intake, whereas high SSB intake was positively associated with high energy intake. Therefore, it may be important to develop strategies for providing children with better food environments and nutrition education to promote the consumption of milk, fruits, and vegetables instead of SSBs. However, as experience with nutrition education was not associated with SSB intake in this study, we may have to reassess the content and effectiveness of such education.
Findings from large studies [3,25,26] have shown a positive association between high SSB intake and obesity. However, Park and colleagues [24] noted that obese adolescents possibly trying to lose weight were less likely to drink SSBs [27]. In the present study, a significant association was found between overweight/obesity and high SSB intake in children aged 7-12 years, which raises the possibility that SSB intake plays an important role in increasing total energy intake and, thus, gaining weight [28].
The major strength of this study is that it is the first to investigate the association between SSB intake and other dietary or behavioral factors using a large, nationally representative sample of Korean children and adolescents. However, this study has some limitations. First, since we used cross-sectional data, the causality and directionality of the associations cannot be determined. Second, SSBs in this study included the beverage items in the KNHANES 24-hour recall data. However, detailed surveys on SSB items and SSB consumption patterns and behaviors might be needed for further research.
Conclusions
Korean children and adolescents aged 7-18 years reported drinking less than 1 cup per day (98.7 ml/day) of SSBs. However, this study identified factors significantly associated with a greater OR for drinking ≥ 300 ml/day of SSBs; these were high energy intake, low milk consumption, and not meeting the recommended fruit and vegetable intake. In addition, being overweight and obese was significantly associated with an increased OR for SSB intake of ≥ 300 ml/day among Korean children (7-12 years). Our findings may be used to develop effective strategies for encouraging Korean children and adolescents to choose healthier foods rather than SSBs.
 XML Download