

 PDF
PDF ePub
ePub Citation
 Print
Print


Introduction
Vitamin D is related to skeletal growth, calcium homeostasis, prevention of autoimmune disorders, and cell differentiation, proliferation, and growth [1]. Severe vitamin D deficiency during adolescence causes rickets due to inadequacy bone development [1]. Vitamin D, which can be obtained from food sources and from absorbing ultraviolet rays from the sun, became known in the early 20th century, when it was discovered that sufficient intake of this vitamin could prevent rickets. In adolescents, vitamin D intake also influences the occurrence of osteoporosis later in life as most bone growth occurs during adolescence and vitamin D increases the absorption of calcium, which plays an important role in achieving peak bone mass [1-6]. Despite the importance of vitamin D, 89% and 99% of male and female Korean adolescents aged 12-13 years were reported to have a serum 25-hydroxyvitamin D[25(OH)D] concentration of less than 20 ng/mL, suggesting that Korean adolescents have insufficient vitamin D intake [7].
The main food sources of vitamin D are liver, beef, egg, mushroom, fish, and milk and dairy products [1,8-11]. In the U.S., common vitamin D food sources were milk, milk drinks, ready-to-eat cereal, fish and shellfish, fruit juices, eggs, frankfurters, sausages, luncheon meats, and cheese, while in Taiwan, vitamin D sources were fish, dairy, meat, eggs, and mushrooms [12, 13]. Although one study has reported the prevalence of vitamin D deficiency in Korean adolescents according to age, season, and parental vitamin D status, it is necessary to analyze the relationship between vitamin D food sources and serum 25(OH) D concentration in Korean adolescents [14]. In the Korean National Health and Nutrition Examination Survey (KNHANES), vitamin D intake cannot be calculated as there is no database on vitamin D in Korean food sources. Therefore, this study used the KNHANES data from 2008-2009 to examine the seasonal serum 25(OH)D concentrations in 12-18 year old adolescents, and then the relationship between these concentrations and the consumption frequencies of main vitamin D food sources was analyzed to provide preliminary data for improving the vitamin D nutritional status of Korean adolescents.
Materials and Methods
Study population
The KNHANES began in 1998 and had been investigated by 3 year cycle until 2005. The KNHANES has been carried out annually since 2007. The KNHANES conducted by Ministry of Health and Welfare investigated health, nutritional status, and health-related awareness and behavior of Korean population. The subjects are aged ≥ 1 and are from stratified multistage samples of the South Korean population. KNHANES consists of health interview, nutrition survey, and health examination. Health interview and health examination survey were conducted in a mobile examination center and nutrition survey was conducted through visiting household. This study was conducted by using the 2008-2009 KNHANES data. The 2008-2009 KNHANES were conducted all the year round from 2008 to 2009. Subjects were adolescents aged 12 to 18 years participating the 2008-2009 KNHANES (n = 1,579).
Data collection on general characteristics
Data from health interview was used to collect information on sex, age, region (urban or rural), education, and exercise. Exercise was expressed as days of moderate physical activity having harder breathing than usual per week. Data from nutrition survey was used to collect information on dietary supplements and users of dietary supplements were defined as those who reporting a regular use for two weeks or longer in the past year. Body mass index (BMI) was calculated as weight (kg)/height (m2). Data from health examination survey was used to collect information of sun exposure time, which was classified as less than five hours or more than five hours.
Measurement of serum 25(OH)D concentration
Blood biochemical characteristics of the subjects were obtained from the health examination survey. Blood samples were collected after 8-12 hours of fasting. Serum 25(OH)D concentration was measured by Radioimmunoassay(RIA) using 25-Hydroxyvitamin D3 RIA CT (Biosource, Belgium) from July 2007 to February 15, 2008 and using 25-Hydroxyvitamin D 125I RIA kit (DiaSorin, USA) from February 20, 2008 to 2009. Vitamin D status was evaluated according to standard of the Institute of medicine (IOM). Vitamin D deficiency was defined as a 25(OH)D < 12 ng/mL, vitamin D inadequacy as a 25(OH)D of 12-20 ng/mL, and sufficiency as a 25(OH)D > 20 ng/mL [15].
Dietary intake analysis
A qualitative food frequency questionnaire (FFQ) with 63 food items was used to collect the dietary information. The frequency was classified into ten categories: never or seldom, 6-11 times per year, 1 time per month, 2-3 times per month, 1 time per week, 2-3 times per week, 4-6 times per week, 1 time per day, 2 times per day, and 3 times per day. In order to identify the association between serum 25(OH)D concentration and major vitamin D food sources, 13 foods and food groups were selected based on previous studies [1,8-11] : beef, egg, mushroom, mackerel, tuna, yellow corvine, pollack, anchovy, total fish, milk, yoghurt, ice cream, and dairy products. All consumption frequencies were standardized into frequency per day.
Statistical analysis
All statistical analyses were performed using the SAS software (version 9.3; SAS Institute Inc., Cary, NC, USA). Since a complex, multistage, and probability sampling design was used to select participants in KNHANES, the PROC SURVEY procedure was applied by using primary sampling units, stratification, and sample weight variables. Because data was integrated from 2008 through 2009, integrating weight variables were calculated based on the response rate in each year.
Serum 25(OH)D concentration is significantly affected by amount of sunshine [18,19]. Based on the monthly serum 25(OH)D concentrations of the subjects, we analyzed the data by season (June-November and December-May). The mean of serum 25(OH)D concentrations was 16.6 ng/mL, the monthly serum 25(OH)D concentrations from June to November were higher than 16.6 ng/mL and the monthly serum 25(OH)D concentrations from December to May were lower than 16.6 ng/mL. The subjects were then categorized into quintiles by serum 25(OH)D concentration. General characteristics variables were analyzed by using PROC SURVEYMEANS and PROC SURVEYREG for continuous variables and PROC SURVEYFREQ for categorical variables. Monthly serum 25(OH)D concentrations were calculated by using PROC SURVEYMEANS. Vitamin D status was analyzed by using PROC SURVEYFREQ. Mean of consumption frequencies were presented after adjusted for age and sex. p-values < 0.05 were considered significant.
Results
General characteristics
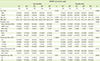
Table 1 presents general characteristics based on serum 25(OH)D concentrations in adolescents aged 12-18 years. From June to November, there were significant differences in serum 25(OH)D concentration according to age, BMI, and educational level. The group with the highest serum 25(OH)D concentration had lower means of age, BMI, and educational level compared to the group with the lowest concentration. From December to May, there were significant differences in serum 25(OH)D concentration according to age, educational level, and exercise. The group with the highest serum 25(OH) D concentration had a lower educational level but more days of exercise compared to the group with the lowest concentration. In addition, the mean age decreased as serum 25(OH)D concentration increased.
Monthly serum 25(OH)D concentrations
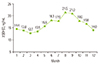
Figure 1 shows the monthly mean serum 25(OH)D concentrations. From May to August, the mean concentration increased to 15.6 ng/mL, 18.3 ng/mL, 17.9 ng/mL, and 21.5 ng/mL, respectively, while from September to December it decreased to 21.0 ng/mL, 18.0 ng/mL, 16.8 ng/mL, and 14.0 ng/mL. It was highest in August, at 21.5 ng/mL, and lowest in March, at 12.7 ng/mL. The mean serum 25(OH)D concentration in the period from June to November was 18.9 ng/mL, higher than the mean concentration of 14.0 ng/mL in the period from December to May.
Serum 25(OH)D concentrations by IOM standard
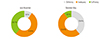
The seasonal serum 25(OH)D concentrations according to IOM standards are shown in Figure 2. The proportions of deficiency, inadequacy, and sufficiency of seasonal serum 25(OH)D concentrations were 9.9%, 51.4%, and 38.7%, respectively, for the period from June to November and 39.4%, 51.4%, and 9.2% for the period from December to May.
Association between serum 25(OH)D concentration and vitamin D food sources
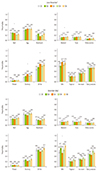
Figure 3 shows the daily consumption frequencies of major vitamin D food sources according to serum 25(OH)D concentration. From June to November, the daily consumption frequencies of mackerel, anchovy, and all fish products showed a significant tendency to increase with increasing serum 25(OH)D concentration, while the consumption frequency of beef showed a significant decrease. From December to May, the consumption frequency of milk significantly increased as serum 25(OH)D concentration increased. Consumption frequencies of other food sources showed no significant correlations with serum 25(OH)D concentration.
Discussion
This study analyzed seasonal serum 25(OH)D concentrations in adolescents aged 12-18 years and determined the association between serum 25(OH)D concentration and consumption frequencies of major vitamin D food sources. The means of seasonal serum 25(OH)D concentrations were 18.9 ng/mL for the period from June to November and 14.0 ng/mL for the period from December to May. High proportion of adolescents showed a state of vitamin D deficiency or inadequacy. When examining the relationship between serum 25(OH)D concentration and consumption frequencies of major vitamin D food sources, it was found that the consumption frequencies of mackerel, anchovies, all fish, and milk significantly increased as the serum 25(OH)D concentration increased.
The groups of adolescents with the highest and lowest serum 25(OH)D concentrations were compared. From June to November, the group with the highest serum 25(OH)D concentration had a lower mean age and BMI compared to the group with the lowest concentration. From December to May, the group with the highest concentration had a lower mean age and higher number of exercise days. Serum 25(OH)D can be synthesized by absorbing ultraviolet B (UVB) photons from sunlight as well as from food products; during winter, the ozone layer absorbs a large amount of UVB radiation, and results in lower concentrations of serum 25(OH)D synthesized in the skin [16,17]. When analyzing seasonal mean serum 25(OH)D concentrations in Korean adolescents aged 12-18 years, it was found that the mean concentrations from June to November and from December to May were 18.9 ng/mL and 14.0 ng/mL, respectively. The mean concentration was highest in August and lowest in March. In a seasonal comparison involving elderly people aged 72-86 years in England, the mean serum 25(OH)D concentrations in the July-August, September-November, December-February, and March-May periods were 10.1 ng/mL, 10.3 ng/mL, 3.5 ng/mL, and 4.8 ng/mL, respectively. In another study, the mean serum 25(OH)D concentrations in U.S. adolescents aged 12-19 years in the April-October and November-March periods were 35.8 ng/mL and 31.4 ng/mL in males and 32.2 ng/mL and 26.0 ng/mL in females. Based on these seasonal differences in serum 25(OH)D concentration, it was confirmed that seasonal differences in the amount of sunshine affect serum 25(OH)D concentrations in adolescents [18,19].
Because Korea lacks standards regarding the status of vitamin D in the body according to serum 25(OH)D concentration, vitamin D nutritional status was expressed through seasonal concentrations in adolescents based on IOM standards [15]. Regarding the seasonal vitamin D nutritional status of Korean adolescents, the proportion of deficiency or inadequacy was 61.3% for the period from June to November and 90.8% for the period from December to May. In comparison, among American adolescents aged 12-19 years, the proportion of deficiency or inadequacy was 22.5% for the period from May to October and 43.0% for the period from November to April. Thus, Korean adolescents showed higher proportion of deficiency or inadequacy than American adolescents [20].
In adolescence, the main function of vitamin D is to maintain the homeostasis of calcium and phosphorus related to bone formation and calcification. In people with vitamin D deficiency, there is decreased calcium absorption in the kidneys or small intestines, heightening the risk of growth impairment and rickets [21,22]. The results of the present study showed that, among Korean adolescents, deficiency and inadequacy proportions were higher than sufficiency proportions in both the June-November and December-May periods. Hence, there should be greater efforts to prevent health problems associated with vitamin D, including the increase in sufficiency vitamin D intake and outdoor activities.
When analyzing the relationship between serum 25(OH)D concentration and consumption frequencies of major vitamin D food sources, it was found that the consumption frequencies of mackerel, anchovies, all fish products, and milk significantly increased as serum 25(OH)D concentration increased in Korean adolescents. No significant tendencies were observed for dairy products other than milk, such as yogurt or icecream. Major food sources for vitamin D are known to include liver, beef, egg, mushroom, fish, milk, and dairy products [1,8-11]. In 2003-2006 data from the U.S. National Health and Nutrition Examination Survey (NHANES), vitamin D food sources were analyzed using the 24-hour recall method with subjects aged 2-18 years, with the most common sources being milk (60.4%), milk drinks (8.3%), and ready-to-eat cereal (8.2%) [12]. In 1993-2002 data from the Nutrition and Health Surveys in Taiwan (NAHSIT), 24-hour dietary records of subjects aged 13 years or older revealed major vitamin D food source groups: fish, dairy, meat, eggs, mushrooms, and other foods. In addition, the food frequency questionnaire (FFQ) was used to analyze vitamin D dietary sources. The results showed that males aged 13-15 years most often consumed fish (54.4%), meat (14.1%), and supplements (12.7%), while males aged 16-18 years consumed fish (60.3%), eggs (11.9%), and meat (10.9%). Females aged 13-15 years consumed fish (60%), eggs (8.9%), and supplements (8.7%), while females aged 16-18 years consumed fish (49.7%), supplements (11.8%), and eggs (11.2%) [13]. As there are many vitamin D-fortified milk and cereal products in the U.S., these may be becoming major food sources for vitamin D [23-25].
Conclusion
Based on the results of this study, it was confirmed that seasonal differences in the amount of sunlight affected serum 25(OH)D concentrations and the consumption frequencies of mackerel, anchovies, all fish, and milk were related to serum 25(OH)D concentrations. In addition, as vitamin D deficiency and inadequacy proportions were high in Korean adolescents aged 12-18 years, outdoor activity time and exercise days should be increased, and nutritional education on the intake of vitamin D food sources is necessary to improve the vitamin D nutritional status of adolescents. There should be a valid vitamin D database on Korean foods to allow estimation of vitamin D intake, but as no such database exists, vitamin D intake could not be estimated and we considered only consumption frequencies. The development and validation of a vitamin D database is necessary to facilitate future estimations of vitamin D intake. In addition, despite the importance of vitamin D during the rapid growth phase of adolescence, there is insufficiency research regarding vitamin D food sources among Korean adolescents; hence, further research is required.
 XML Download